Download presentation
Presentation is loading. Please wait.

1
Alameda Unified School District Demographic Trends and Forecasts Shelley Lapkoff, Ph.D. and Jeanne Gobalet, Ph.D. Lapkoff & Gobalet Demographic Research, Inc. March 13, 2007

2
Agenda How we categorized students in order to unravel the different factors that have affected enrollments Enrollment trends Revised enrollment forecasts Changes reflect latest information about Alameda Landing Capacity compared with enrollments, and comparing enrollees to residents Conclusions

3
Former Naval Base Marina Village North Village Alameda Point Enrollment Patterns, 1999 – 2006 Housing Growth Bayport Alameda Neighborhoods Bay Farm Island (BFI) East of Park, Main Island Park to Webster West of Webster, South of Atlantic IDTs (students who live outside Alameda) Harbor Island Apts. Categories of Students Charters

4
Former Naval Base Marina Village North Village Alameda Point Enrollment Patterns, 1999 – 2006 899 Student Loss Housing Growth Bayport Alameda Neighborhoods Bay Farm Island (BFI) East of Park, Main Island Park to Webster West of Webster, South of Atlantic IDTs (students who live outside Alameda) Harbor Island Apts. Enrollment Patterns by Category + + + _ _ _ Charters _ _ _ +

5
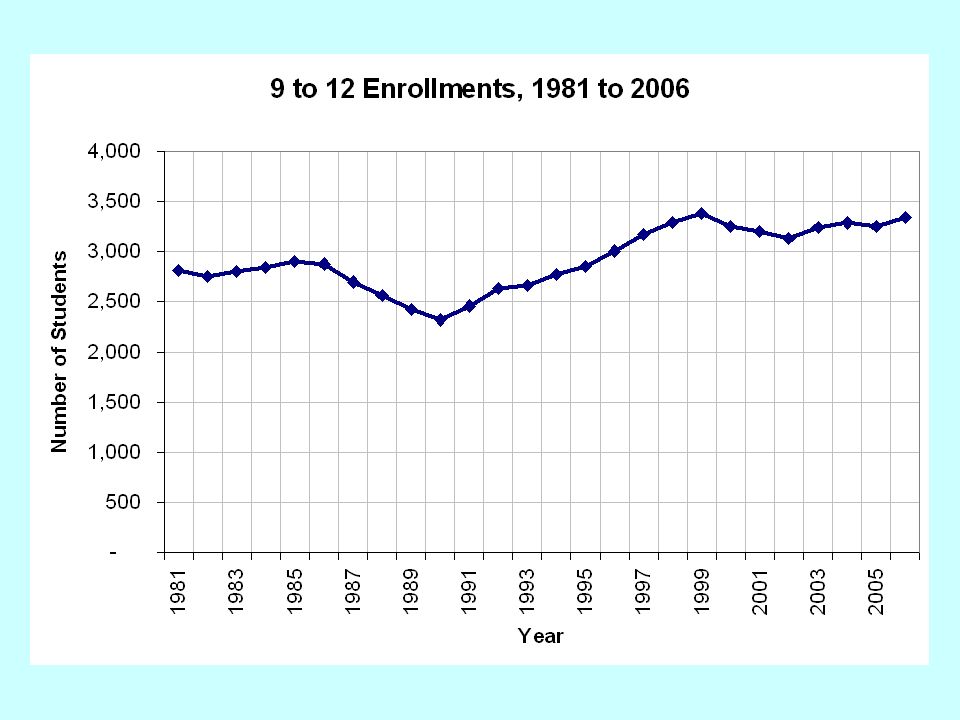
Enrollment Trend 899 Enrollment Decline between 2001-2006 Elementary: 627-student decline Middle school: 234-student decline High school: 38-student decline All enrollment figures exclude charter students, unless otherwise noted

9
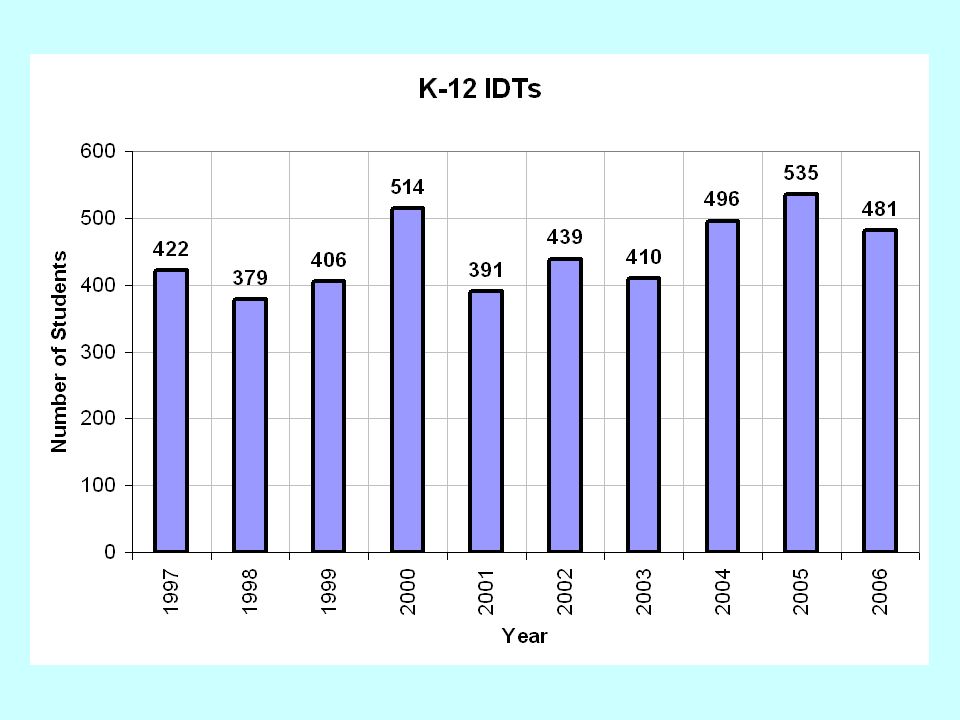
Inter-district Transfer Students AUSD has a large number of IDT students, which help buttress enrollments. Enrollments have been fairly stable over time. In analyzing historical trends it is important to separate the effect of IDTs to see true AUSD demographic patterns. The forecast assumes the average patterns of the last three years will equal each grades future enrollments (this assumption is easy to change).
..")
11
Former Naval Base Marina Village Housing – newer Coast Guard housing North Village Housing – older Coast Guard housing, now abandoned, and the site for future development Alameda Point – low-income housing assistance now operated by Alameda Point Collaborative New Housing – Bayport, other redevelopment areas on the former base

13
Evictions at Harbor Island Apts. (now Summer House) Occupants left 615 apartments in 2004 and 2005 About 500 K-12 students lived in units About half of the students continued in AUSD 35 percent went to other Alameda housing 15 percent left Alameda and became inter-district transfer students Summer House 144 units are now occupied Remaining units will be occupied by the summer (units being released continuously); total will be 615 units There are now 11K-12 students in Summer House; forecast assumes 44 total
 Occupants left 615 apartments in 2004 and 2005 About 500 K-12 students lived in units About half of the students continued in AUSD 35 percent went to other Alameda housing 15 percent left Alameda and became inter-district transfer students Summer House 144 units are now occupied Remaining units will be occupied by the summer (units being released continuously); total will be 615 units There are now 11K-12 students in Summer House; forecast assumes 44 total.")
15
Alameda Neighborhoods or Subareas Bay Farm Island 2,202 students in 2006-07 East of Park Street, Main Island 1,974 students in 2006-07 Between Park and Webster Street 3,818 students in 2006-07 West of Webster, South of Atlantic 1,064 students in 2006-07

16
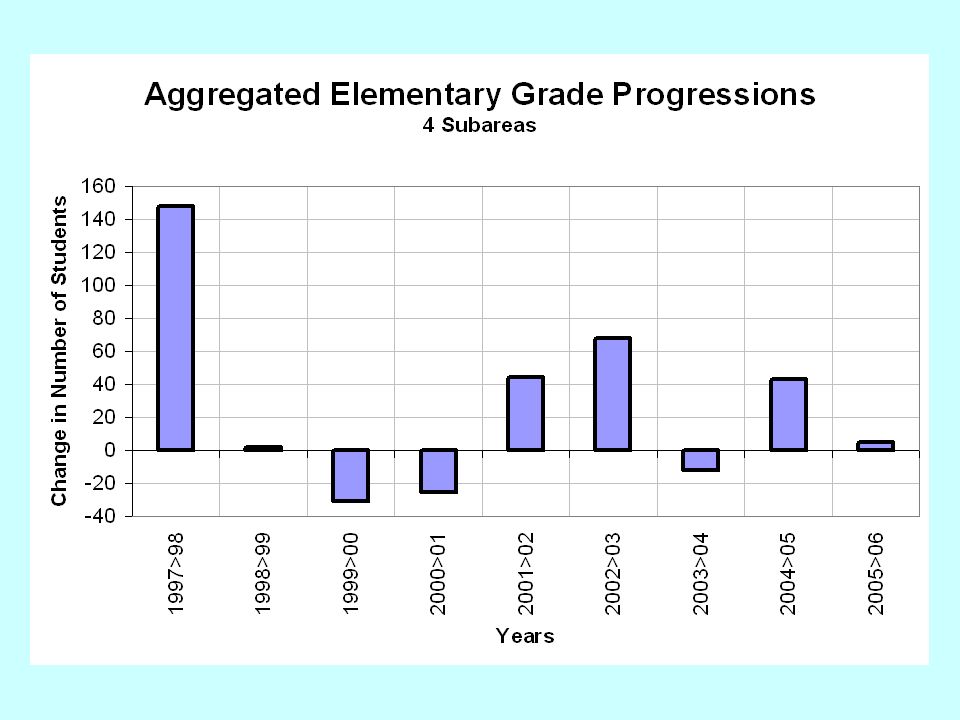
Migration and Housing Turnover (Grade Progressions)
")
17
Start with todays students by grade, then age the students one grade K 1 2 3 4 etc. 1 2 3 4 5 etc. some students leave, others enter

19
Grade Progressions Grade progressions are the key assumption used in the forecast. We start with the current students and age them for each year of the forecast. The choice of grade progression determines how their numbers will shrink or grow as the cohort moves to the next grade. The forecast uses an average of the last three years grade progressions.

21
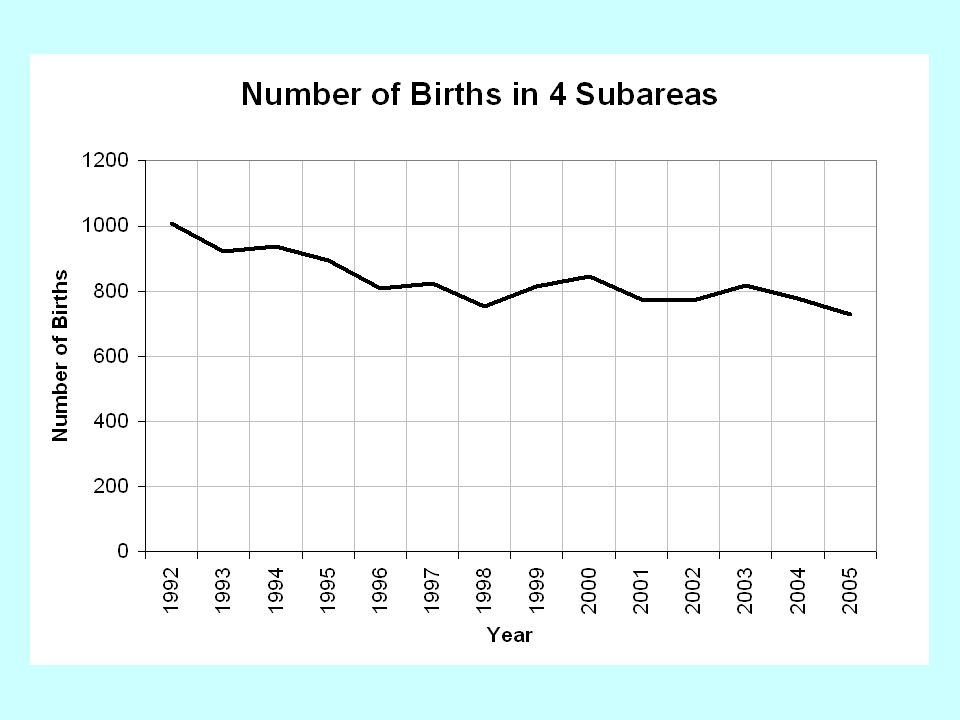
Kindergarten Enrollment and Birth Trends

25
New Housing

26
Housing Forecast Number of Students = Number of housing units * Student Yield Student Yield = average number of students per housing unit

27
Housing Forecast Number of future housing units anticipated – Bayport: Under construction, 70 students in October, 2006. 145 more students expected (including residents of 39 subsidized apartment units) – Alameda Point Comprehensive Plan: timing is uncertain; 1,735 units in latest document – Alameda Landing: expected in 2010-11; up to 300 housing units – Northern Waterfront: timing uncertain, though 40 units are approved; 500 units total Student Yield: Average number of students per unit – Varies by type, price, and age of housing – Assume.50 yield in redevelopment areas – Adjust assumption after Bayport has been completed
 – Alameda Point Comprehensive Plan: timing is uncertain; 1,735 units in latest document – Alameda Landing: expected in ; up to 300 housing units – Northern Waterfront: timing uncertain, though 40 units are approved; 500 units total Student Yield: Average number of students per unit – Varies by type, price, and age of housing – Assume.50 yield in redevelopment areas – Adjust assumption after Bayport has been completed.")
28
Long-run Perspective Eventually, about 1,200 students expected from redevelopment areas Timing is uncertain; we assume development on the former Naval base begins in 2015 Likely to take many years to complete, so AUSD should be able to adjust gradually to steady student increase

29
Former Naval Base.Marina Village.North Village.Alameda Point Enrollment Forecast, 2006 – 2011 20 Student Loss Housing Growth Bayport Former Naval Base redevelopment Alameda Landing Northern Waterfront Alameda Neighborhoods.Bay Farm Island (BFI).East of Park, Main Island.Park to Webster.West of Webster, South of Atlantic IDTs (students who live outside Alameda) Summer House Apts. Enrollment Forecast by Category + + _ _ Charters + + _ ? ? +

30
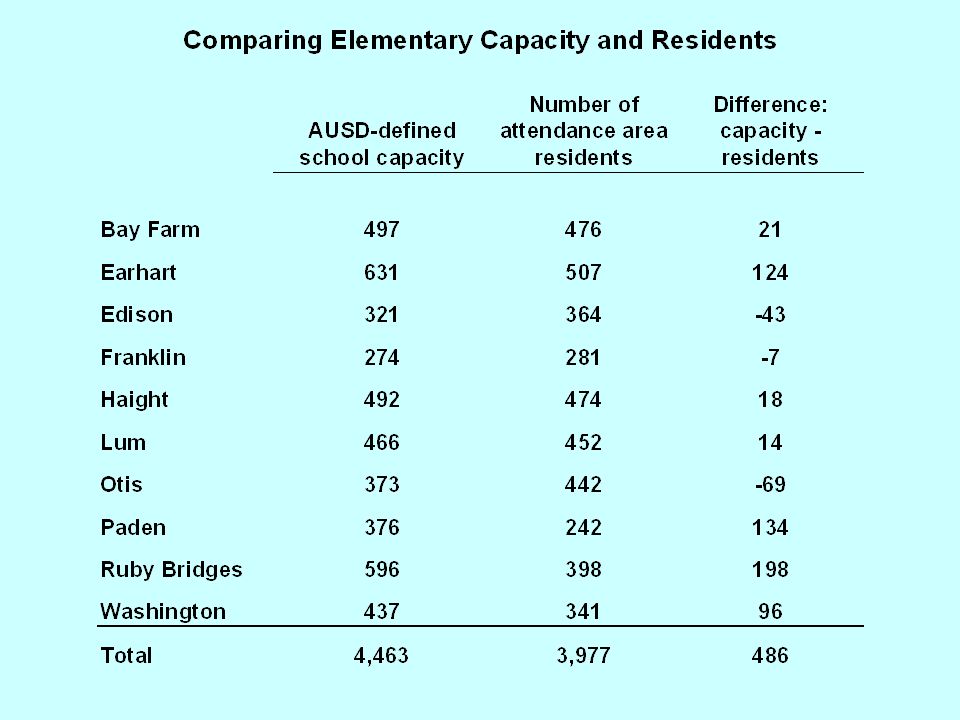
Comparison of Current Residents with Facilities Capacity

31
Comparison of Residents and Enrollees

36
Conclusions AUSD experienced a severe enrollment decline between 1999 and 2006. This resulted from a variety of factors. The enrollment decline has nearly ended. Eventually, about 1,200 students are expected from redevelopment areas, but this is in the long run. Currently, the District has excess capacity at each school level. IDTs use some of this capacity. A few areas have facilities shortages despite the district- wide excess capacity: East of Park elementary attendance areas have more residents than seats Lincoln and AHS are close to having more residents than capacity AUSD may want to convene a study group to consider options regarding excess capacity and the mismatch of facilities and residents in East of Park (and perhaps other areas)
.")
37
Revised Table 1

38
Revised Table 6

39
Revised Table 6, cont.

Similar presentations


 Shall Rise Again – Just you Wait! 48 th ASU/Chase Economic Forecast>")


