Download presentation
Presentation is loading. Please wait.

1
WECC Composite Load Model
WECC MVWG Meeting Bellevue, WA August 25, 2011

2
Motion Approve the implementation plant for replacing the “interim” load model with a Phase 1 “composite” load model Use default data sets Residential air-conditioner stalling disabled* * No revision of the WECC reliability criteria is needed

3
Composite Load Model Development

4
Load Modeling In the first 40 years of digital simulations, the focus was on modeling the supply side We have reasonably good power plant models Models data is to get more consistent as more plants have digital controls We have tools for power plant model validation using disturbance data Now, the focus is shifting on modeling the supply side

5
Load Modeling Upcoming big changes on demand-side:
Loads will play much more influential role in power system stability Resistive-type loads are phasing out (incandescent lights and resistive heating) Energy inefficient but exhibit “grid-friendly” behavior Power Electronic loads, VFDs, AC compressors, heat pumps, CFLs, LEDs are gaining their presence Energy efficient but have undesirable characteristics from standpoint of dynamic stability Increasing penetration of residential air-conditioners Upcoming big changes on demand-side: Electric vehicl chargers Distributed generation Reasonable models are needed to understand the system impacts of these changes, to plan and operate the system and to develop appropriate standards
 Energy inefficient but exhibit grid-friendly behavior. Power Electronic loads, VFDs, AC compressors, heat pumps, CFLs, LEDs are gaining their presence. Energy efficient but have undesirable characteristics from standpoint of dynamic stability. Increasing penetration of residential air-conditioners. Upcoming big changes on demand-side: Electric vehicl chargers. Distributed generation. Reasonable models are needed to understand the system impacts of these changes, to plan and operate the system and to develop appropriate standards.")
6
Load Modeling – Setting Expectations
We can now achieve the great accuracy with generator models: We model physical equipment that is well defined and under our control We will never be able to achieve a comparable level of accuracy with load models Load models will not be able to predict details Load models should be capable of representing the load response in principle

7
WECC Load Modeling Philosophy
WECC uses a physical-based modeling approach: Bottom-up model development Develop models that represent physics and characteristics of the actual end-use components Top-down model validation Validate and calibrate model data using disturbance recordings

8
History Of Load Modeling in WECC
1980’s – Constant current real, constant impedance reactive models connected to a transmission bus Reflected the limitation of computing technologies of that time 1990’s – EPRI Loadsyn effort Several utilities use static polynomial characteristics for load representation 1990’s – IEEE Task Force recommends dynamic load modeling The recommendation does not get much traction in the industry 1996 – BPA model validation study for August outage: Need for motor load modeling to represent oscillations and voltage instability

9
History Of Load Modeling in WECC
2000 – 2001 – WECC “Interim” Load Model: Presently used in planning and operational studies in WECC 20% of load is represented with induction motors, the remaining load is static, mainly constant current active, constant impedance reactive components Tuned to match inter-area oscillations for August and August 4, 2000 events “Interim” load model was intended as a temporary solution to address oscillation issues observed at California – Oregon Intertie The model limitations and the need for a composite load model were recognized

10
History Of Load Modeling in WECC
Late 1980’s – Southern California Edison observed events of delayed voltage recovery attributed to stalling of residential air-conditioners Tested residential air-conditioners, developed empirical AC models 1997 – SCE model validation study of Lugo event: Need to represent a distribution equivalent Need to have special models for air-conditioning load

11
Southern California Edison
Lugo Event – Load Modeling Lessons: A. Need to represent a distribution equivalent B. Need to have special models for residential air-conditioners

12
Load Modeling Efforts in the East
1994 – Florida Power published an IEEE paper, used a similar load model 1998 – Events of delayed voltage recovery were observed in Atlanta area by Southern Company, the events are analyzed and modeled Southern Company and Florida Power used in principle similar approaches to SCE’s and eventually WECC model

13
WECC Load Modeling Task Force
2005 – WECC developed “explicit” load model: Adding distribution equivalent to powerflow case (PG&E) Modeling load with induction motors and static loads Numerically stable in WECC-wide studies ! 2007 – PSLF has the first version of the composite load model (three-phase motor models only) – SCE-BPA-EPRI testing residential air-conditioners and developing models 2009 – residential air-conditioner model is added to the composite load mode
 Modeling load with induction motors and static loads. Numerically stable in WECC-wide studies ! 2007 – PSLF has the first version of the composite load model (three-phase motor models only) – SCE-BPA-EPRI testing residential air-conditioners and developing models – residential air-conditioner model is added to the composite load mode.")
14
WECC Load Modeling Task Force
Composite Load Model Structure Default data sets Load composition Load component data Distribution equivalent Tools for data management Validation studies System impact studies

15
WECC Composite Load Model (CMPLDW)
12.5-kV 13.8-kV M 69-kV 115-kV 138-kV M AC UVLS Electronic UFLS Static

16
Composite Load Model Structure
Composite load model structure is implemented in General Electric’s PSLF, Siemens PTI PSS®E, Power World Simulator Similar model exists in PowerTech’s TSAT TSS approved Composite Load Model Structure

17
Load Model Data

18
WECC Composite Load Model
Load Component Model Data Distribution Equivalent Data M M 115-kV 230-kV M Load Model Composition Data M UVLS and UFLS Data Electronic Static

19
Distribution Equivalent Data
M M R + j X 69-kV 115-kV 138-kV M M B1 B2 Bss Electronic DV = 4 to 6% X/R = 1.5 PL < 7% B1:B2 = 3:1 X = 8% LF = 110% Tap = +/- 10% Static

20
WECC Climate Areas ID Climate Zone Representative City NWC
Northwest Coast Seattle, Vancouver BC NWV Northwest Valley Portland OR NWI Northwest Inland Boise, Tri-Cities, Spokane RMN Rocky Mountain North Calgary, Montana, Wyoming NCC Northern California Coast Bay Area NCV Northern California Valley Sacramento NCI Northern California Inland Fresno SCC Southern California Coast LA, San Diego SCV Southern California Valley SCI Southern California Inland DSW Desert Southwest Phoenix, Riverside, Las Vegas HID High Desert Salt Lake City, Albuquerque, Denver, Reno

21
Load Composition Information
California Energy Commission: 2006 California Commercial End-Use Survey (CEUS) LBNL Reports on Electricity Use in California PNNL DOE2 building simulations BPA-PNNL End-Use Load Characterization Assessment Program (ELCAP) BPA Building Data Load shapes provided by WECC members
 LBNL Reports on Electricity Use in California. PNNL DOE2 building simulations. BPA-PNNL End-Use Load Characterization Assessment Program (ELCAP) BPA Building Data. Load shapes provided by WECC members.")
22
California Commercial End-Use Survey
15 climate zones in California Four seasons Typical, Hot, Cold, Weekend 24-hour data Data is available on CEC web-site bottom top

23
LBNL Electricity Use In California Study
Residential AC Lighting Commercial AC

24
PNNL Load Composition Model
CEC / BPA hired PNNL to develop load composition data Detailed models of various building types Residential loads are modeled using ELCAP data and DOE-2 models Commercial loads are taken from CEUS WECC developed mapping from end-uses to models

27
Load Class Model Components

28
Portland Metro Area – BPA SCADA

29
Portland Metro Area – BPA SCADA

30
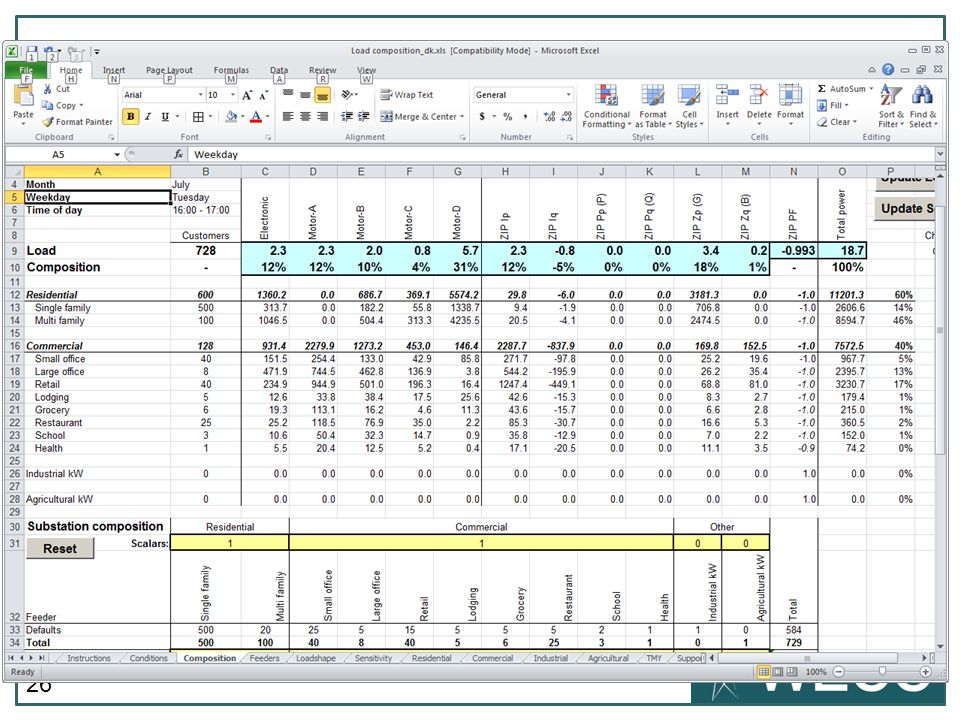
WECC Load Composition Model
There is a balance between precision and the amount of effort required to maintain the data sets Based on the understanding developed using PNNL tool, WECC developed a simplified LCM version to create default data sets Produces load composition data for summer (normal, peak, cool), shoulder (normal) and winter (normal) days
, shoulder (normal) and winter (normal) days.")
31
WECC Load Composition Model (Light)
")
32
Future work Better understanding of “electrification” by regions, and ultimately by substations Validation of building models Right now commercial data is extrapolated from California CEUS, and residential data is used from ELCAP Validation of load shapes at substation level: Use customer mix data and models to produce load shapes Validate the load shapes using SCADA data (5-min and 1–hour are available from BPAT)
")
33
Expert Help is Available
If you want detailed load composition information for your specific area, please contact David Chassin at PNNL Detailed analysis is currently done for substations in Seattle, Portland and Phoenix

34
Motor Data

35
Commercial Compressor Motor

36
Commercial Fan and Pump Motors

37
Commercial Fan and Pump Motors

38
Protection Industrial compressors: Industrial fans and pumps
Trip and lock-out - half at 75%, half at 65%, 3 to 5 cycles Industrial fans and pumps Trip and lock-out - half at 75%, half at 65%, 3 to 5 cycles Commercial compressors Trip and lock-out: 20% of motors, trip < 60% 2 cycles Trip and reclose: remaining, trip < 50% 2 cycles , reclose > 60% for 0.2 sec Fans and pumps

39
Tools for Load Model Data Management

40
WECC Composite Load Model
cmpldw "CANYON " "1 " : #1 mva= "Bss" 0 "Rfdr" "Xfdr" 0.04 "Fb" 0.749/ "Xxf" 0.08 "TfixHS" 1 "TfixLS" 1 "LTC" 1 "Tmin" "Tmax" 1.1 "step" / "Vmin" "Vmax" 1.04 "Tdel" 30 "Ttap" 5 "Rcomp" 0 "Xcomp" 0 / "Fma" "Fmb" "Fmc" "Fmd" "Fel" / "PFel" 1 "Vd1" 0.75 "Vd2" 0.65 "Frcel" 0.35 / "Pfs" "P1e" 2 "P1c" "P2e" 1 "P2c" "Pfreq" 0 / "Q1e" 2 "Q1c" -0.5 "Q2e" 1 "Q2c" "Qfreq" -1 / "MtpA" 3 "MtpB" 3 "MtpC" 3 "MtpD" 1 / "LfmA" 0.75 "RsA" 0.04 "LsA" 1.8 "LpA" 0.12 "LppA" / "TpoA" "TppoA" "HA" "etrqA" 0 / "Vtr1A" 0.7 "Ttr1A" "Ftr1A" 0.2 "Vrc1A" 1 "Trc1A" 9999 / "Vtr2A" 0.55 "Ttr2A" "Ftr2A" 0.75 "Vrc2A" 0.65 "Trc2A" 0.1 / "LfmB" 0.75 "RsB" 0.03 "LsB" 1.8 "LpB" 0.19 "LppB" / "TpoB" 0.2 "TppoB" "HB" "etrqB" 2 / "Vtr1B" 0.65 "Ttr1B" "Ftr1B" 0.1 "Vrc1B" 1 "Trc1B" 9999 / "Vtr2B" 0.6 "Ttr2B" "Ftr2B" 0.1 "Vrc2B" 1 "Trc2B" / "LfmC" 0.75 "RsC" 0.03 "LsC" 1.8 "LpC" 0.19 "LppC" / "TpoC" 0.2 "TppoC" "HC" "etrqc" 2 / "Vtr1C" 0.65 "Ttr1C" 0.05 "Ftr1C" 0.1 "Vrc1C" 1 "Trc1C" 9999 / "Vtr2C" 0.6 "Ttr2C" 0.03 "Ftr2C" 0.1 "Vrc2C" 1 "Trc2C" / "LfmD" 1 "CompPF" 0.98 / "Vstall" 0.54 "Rstall" 0.1 "Xstall" 0.1 "Tstall" "Frst" 0.14 "Vrst" 0.95 "Trst" 0.3 / "fuvr" 0.1 "vtr1" 0.6 "ttr1" 0.02 "vtr2" 0.9 "ttr2" 5 / "Vc1off" 0.5 "Vc2off" 0.6 "Vc1on" 0.4 "Vc2on" 0.5 / "Tth" 15 "Th1t" 0.7 "Th2t" 1.9 "tv" 0.025

41
LMDT 3A Powerflow case (done by SRWG)
Climate zone and load type are identified in “Long_ID” column of “load” table in PSLF E.g. DSW_RES = Desert Southwest, predominantly residential loads EPCL Programs (done by WECC Staff) Default data sets for each climate zone and feeder type Ability to over-ride defaults with specific information Creates composite load model records for PSLF PTI PSS®E Users Convert from PSLF models IPLAN tolls may be available ? Load models will be distributed by WECC staff with study cases LMDT 3A is posted on WECC web-site, including user’s manual
 Default data sets for each climate zone and feeder type. Ability to over-ride defaults with specific information. Creates composite load model records for PSLF. PTI PSS®E Users. Convert from PSLF models. IPLAN tolls may be available Load models will be distributed by WECC staff with study cases. LMDT 3A is posted on WECC web-site, including user’s manual.")
42
Load Model Validation Studies

43
August 4, 2000 Oscillation - CMPLDW

44
August 4, 2000 Oscillation - MotorW

45
August 4, 2000 Oscillation - CmpldW
Default Data Set

46
August 4, 2000 Oscillation - CmpldW
Tuning

47
June 14, 2004 Westwing Fault - CmpldW

48
July 28, 2003 Hasayampa Fault

49
July 28, 2009 Mid-Valley Fault Voltage Frequency

50
System Impact Studies

51
2011HS – Chief Joseph Brake Blue = MotorW Red = CmpldW phase 1
Green = CmpldW phase 2

52
2011HS – BC-Alberta Loss (546 MW)
Blue = MotorW Red = CmpldW phase 1 Green = CmpldW phase 2

53
2011HS – 2 Palo Verde Outage Blue = MotorW Red = CmpldW phase 1
Green = CmpldW phase 2

54
2011HS – 2 Palo Verde Outage Blue = MotorW Red = CmpldW phase 1
Green = CmpldW phase 2

55
2014LS – Montana Blue = MotorW, 77% dip Green = CmpldW, 22:00, 82% dip
Brown = CmpldW, 6:00, 82% dip

56
2014LS – Montana Blue = MotorW Red = CmpldW,
Grey/Green = CmpldW, improved exciters at a hydro plant

57
Next Steps

58
Conclusions WECC Composite load model is implemented in GE PSLF, Siemens PTI PSS®E, Power World, Power Tech TSAT Tools are developed for load model data management Default sets are developed: 12 climate zones in WECC, four types of feeders Summer, winter and shoulder conditions

59
Conclusions Validation studies are done for FIDVR events and oscillations System impact studies Significant impact on faults in large load centers FIDVR Impact on inter-area oscillations

60
FIDVR Composite load model is capable of reproducing the FIDVR phenomenon Composite load model can be tuned with reasonable data sets to match the historic events MVWG at this point is not comfortable recommending using CMPLDW for FIDVR studies for compliance purposes There is a concern that the FIDVR modeling can result in over- investment or unnecessary operational restrictions

61
FIDVR – Planned Work Continue work on understanding the phenomenon of air-conditioner stalling in distribution systems (supported by DOE) Work with AHRI Feeder simulations Speed up efforts on collecting disturbance recordings SCE, SRP, Center Point Energy, PSE, BPA/PGE A letter was sent to grid operators in the East Tools for detecting FIDVR events in PMU data

62
CMPLDW – Phased Approach

63
CMPLDW CMPLDW has many benefits beyond FIDVR
TSS delayed PSS Policy review until appropriate load models are developed Frequency response review studies are required

64
CMPLDW Plan Today – Approve the implementation plan for adopting Phase 1 CMPLDW for system studies Continue improvement of FIDVR modeling Disturbance recordings, system impact studies Start using the CMPLDW for studies to support the review of the WECC voltage dip criteria Seek the approval of the “CMLDW with FIDVR enabled” and the new reliability criteria by Fall 2012

65
Motion Approve the implementation plant for replacing the “interim” load model with a Phase 1 “composite” load model Use default data sets Residential air-conditioner stalling disabled* * No revision of the WECC reliability criteria is needed

Similar presentations


 Request For Information.>")


 Scope of Work Approval January 25, 2013 Joe Seabrook Puget Sound Energy.>")


