Download presentation
Presentation is loading. Please wait.

1
The Theory of Consumer Choice
Chapter 21 The Theory of Consumer Choice © 2002 by Nelson, a division of Thomson Canada Limited 1 1 1 1

2
Overview The budget constraint Indifference curves
The consumer’s optimal choice Income and substitution effects on choice Deriving the demand curve 2 2

3
The Theory of Consumer Choice...
... addresses the following questions and links them in understanding: Do all demand curves slope downward? How do wages affect labour supply? How do interest rates affect household saving? Do the poor prefer to receive cash or in-kind transfers? 2 2 3 3

4
The Budget Constraint: What Consumers Can Afford
“The budget constraint depicts the consumption possibilities available to the individual.” People consume less than they desire because their spending is constrained, or limited, by their income. 3 3 4 4

5
The Budget Constraint Shows what combination of goods the consumer can afford given his income and the prices of the two goods. 4 4 5 5
6
The Budget Constraint Pepsi ($2) Pepsi Pizza Pizza ($10) 5 5 6 6
 Pepsi Pizza Pizza ($10)")
7
The Budget Constraint Pepsi Pepsi Pizza Pizza 500 100 ($2) ($10) 6 6 7
 ($10) 6 6 7")
8
The Budget Constraint Pepsi Pepsi B A Pizza Pizza 500 100 ($2) ($10) 7
8 8

9
The Budget Constraint Pepsi Pepsi B C A Pizza Pizza 500 250 50 100
($2) Pepsi B 500 C 250 A Pizza Pizza ($10) 50 100 8 8 9 9
 Pepsi. B C A. Pizza. Pizza. ($10)")
10
The Budget Constraint Pepsi
($2) Any point on the constraint line equals $1,000, the income available to spend on the two products. B 500 C 250 A Pizza ($10) 50 100 9 9 10 10
 Any point on the constraint line equals $1,000, the income available to spend on the two products. B C A. Pizza. ($10)")
11
The Budget Constraint The slope of the budget constraint measures the rate at which the consumer can trade one good for the other. The slope equals the relative price of the two goods, i.e. the price of one good compared to the price of the other. 10 10 11 11

12
Overview The budget constraint Indifference curves
The consumer’s optimal choice Income and substitution effects on choice Deriving the demand curve 12 12

13
Preferences: What the Consumer Wants
A consumer’s preference (choice) between different bundles of goods and services may be illustrated with indifference curves. An indifference curve depicts bundles of goods that leave the consumer equally well-off. It shows the combinations of goods that give the consumer a constant level of utility. 11 11 13 13
 between different bundles of goods and services may be illustrated with indifference curves. An indifference curve depicts bundles of goods that leave the consumer equally well-off. It shows the combinations of goods that give the consumer a constant level of utility")
14
Indifference Curves Pepsi I2 I1 Pizza 12 12 14 14

15
Indifference Curves Pepsi . C . . B I2 I1 A Pizza 13 13 15 15

16
Indifference Curves The consumer is indifferent among combinations A, B, and C, because they are all on the same curve. The slope at any point on an indifference curve equals the rate at which the consumer is willing to substitute one good for the other. 14 14 16 16

17
Indifference Curves Pepsi . C . . . B D I2 I1 A Pizza 15 15 17 17

18
. . . . Indifference Curves Slope between points A and B.
Pepsi Slope between points A and B. Tradeoff between the two bundles. . C . . . B D I2 I1 A Pizza 16 16 18 18

19
The Marginal Rate of Substitution
The slope is called the marginal rate of substitution. The rate at which consumers are willing to trade one good for another. The amount that the consumer must receive as compensation in order to give up something else that he/she desires. 17 17 19 19

20
Preferences: What the Consumer Wants
The consumer prefers some indifference curves to others. Because he prefers more consumption to less, higher indifference curves are preferred to lower ones. Points on a higher indifference curve are preferred to any point on lower curves. 18 18 20 20

21
Indifference Curves Pepsi . C . . D . B I2 I1 A Pizza 19 19 21 21

22
Properties of Indifference Curves
Higher indifference curves are preferred to lower ones. Indifference curves are downward sloping. Indifference curves do not cross. Indifference curves are bowed inward. 20 20 22 22

23
Higher indifference curves are preferred to lower ones
Indifference curves further from the origin represent higher levels of well-being or utility. Consumers prefer to be on an indifference curve that is as far from the origin as possible. 21 21 23 23

24
Indifference curves are downward sloping
The fact that the consumer is willing to give up one of the goods only if he/she is given some more of the other good results in the indifference curve being downward sloping. 22 22 24 24

25
Indifference curves do not cross
In order for preference rankings to be consistent, indifference curves cannot intersect or cross. If indifference curves were to cross the assumption that “more is preferred to less” would be violated. 23 23 25 25

26
Indifference curves are bowed inward
Since goods are subject to diminishing marginal utility, indifference curves are bowed inward. We are willing to give up a lot of a good with low marginal utility to get some more of the good that has a high marginal utility. 24 24 26 26

27
Extreme Indifference Curves
Perfect Substitutes: The indifference curves have a constant marginal rate of substitution and the curves are straight lines. 25 25 27 27

28
Perfect Substitutes Nickels 6 4 2 I1 I2 I3 Dimes 1 2 3 26 26 28 28

29
Extreme Indifference Curves
Perfect Substitutes: The indifference curves have a constant marginal rate of substitution and the curves are straight lines. Perfect Complements: The indifference curves have lines that are at right-angles to each other. 27 27 29 29

30
Perfect Complements Left Shoes I2 I1 Right Shoes 28 28 30 30

31
Quick Quiz! Draw some indifference curves for Pepsi and pizza.
Explain the four properties of these indifference curves. 29 29 31 31

32
Overview The budget constraint Indifference curves
The consumer’s optimal choice Income and substitution effects on choice Deriving the demand curve 32 32

33
Optimization: What the Consumer Chooses
Consumers would like to obtain the combination of goods on the highest possible indifference curve. However, the budget constraint may restrict or limit the consumer to a lower indifference curve. Combining the indifference curve and budget constraint determines the optimum choice. 30 30 33 33

34
The Consumer’s Optimal Choice
Pepsi Consumer’s indifference curves, based on personal preferences. I3 I2 I1 Pizza 31 31 34 34

35
The Consumer’s Optimal Choice
Pepsi Consumer’s budget constraint. I3 I2 I1 Pizza 32 32 35 35

36
The Consumer’s Optimal Choice
Pepsi Optimal Choice given personal preference and budget constraint. . QPepsi I3 I2 I1 Pizza QPizza 33 33 36 36

37
The Consumer’s Optimal Choice
The point at which the indifference curve and the budget constraint touch (i.e. its tangent) is called the optimum. The consumer chooses consumption of the two goods so that the marginal rate of substitution equals the relative price. The consumer’s valuation of the two goods equals the market’s valuation. 34 34 37 37
 is called the optimum. The consumer chooses consumption of the two goods so that the marginal rate of substitution equals the relative price. The consumer’s valuation of the two goods equals the market’s valuation")
38
How Changes in Income Affect the Consumer’s Choices
The increase in income shifts the budget constraint outward. This results in two affects: A parallel shift in the budget constraint. Allows the consumer to choose a better combination of goods on a higher indifference curve. 35 35 38 38

39
A Change in Income Affects Choices
Pepsi Optimal Choice given personal preference and budget constraint. . QPepsi I3 I2 I1 Pizza QPizza 36 36 39 39

40
A Change in Income Affects Choices
Pepsi An Increase in income shifts the budget constraint. . QPepsi I3 I2 I1 Pizza QPizza 37 37 40 40

41
A Change in Income Affects Choices
Pepsi A new choice of goods is chosen on a higher indifference curve. . QNew QPepsi I3 I2 I1 Pizza QPizza QNew 38 38 41 41

42
A Change in Income Affects Choices
Pepsi A new optimum . QNew QPepsi I3 I2 I1 Pizza QPizza QNew 39 39 42 42

43
Normal versus Inferior Goods
If a consumer wants more of a good when his income rises, the good is called a normal good. If a consumer buys less of a good when his income rises, the good is called an inferior good. 40 40 43 43

44
Changes in Prices Affect Consumer’s Choices
A fall in the price of any good will shift the budget constraint outward and will change the slope of the budget constraint. 41 41 44 44

45
A Change in Prices Affects Choices
Pepsi A decrease in price changes the slope of the budget constraint. . QPepsi I3 I2 I1 Pizza QPizza 42 42 45 45

46
A Change in Prices Affects Choices
Pepsi A decrease in price changes the slope of the budget constraint. . QPepsi I3 I2 I1 Pizza QPizza 43 43 46 46

47
Overview The budget constraint Indifference curves
The consumer’s optimal choice Income and substitution effects on choice Deriving the demand curve 47 47

48
Income and Substitution Effects
A price change will have two effects upon the consumer: an income effect a substitution effect 44 44 48 48

49
Income and Substitution Effects
The substitution effect is the change in consumption that results from being at a point on an indifference curve with a different marginal rate of substitution. When the price of a good increases, the amount of other goods that have to be given up increases. 45 45 49 49

50
Substitution Effect Pepsi . Initial optimum A I2 I1 Pizza 46 46 50 50

51
. Substitution Effect Pepsi B A I2 I1 Pizza New optimum
47 47 51 51

52
Income and Substitution Effects
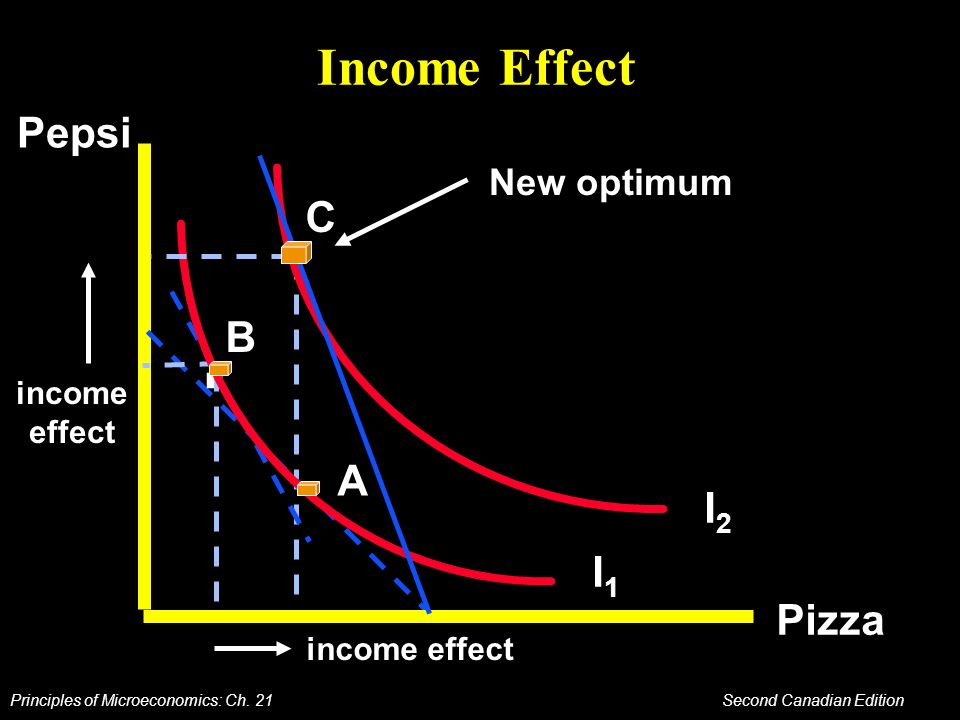
The income effect is the change in consumption that results from the movement to a higher or lower indifference curve because of the price change of one good. The consumer is: worse off when prices increase better off when prices decrease 48 48 52 52

53
Income Effect Pepsi . B Inital optimum A I2 I1 Pizza 49 49 53 53

54
. Income Effect Pepsi C B A I2 I1 Pizza New optimum income effect
50 50 54 54
55
Income and Substitution Effects
A price change first causes the consumer to move from one point on a indifference curve to another point on the same curve, a substitution effect (A to B). After moving from one point to another on the same curve, the consumer will move to another indifference curve, the income effect (B to C). 51 51 55 55
. After moving from one point to another on the same curve, the consumer will move to another indifference curve, the income effect (B to C)")
56
Income and Substitution Effects
Pepsi C B . A I2 I1 Pizza 52 52 56 56

57
Quick Quiz! Draw a budget constraint and indifference curves for Pepsi and pizza. Show what happens to the budget constraint and the consumer’s optimum when the price of pizza rises. Identify income and substitution effects. 53 53 57 57

58
Overview The budget constraint Indifference curves
The consumer’s optimal choice Income and substitution effects on choice Deriving the demand curve 58 58

59
Deriving the Demand Curve
A consumer’s demand curve is a summary of the optimal decisions that arise from his budget constraint and indifference curves. 54 54 59 59

60
Do all demand curves slope downward?
Demand curves can sometimes slope upward when consumers buy more of a good when the price rises. Giffen Goods are inferior goods for which the income effect dominates the substitution effect. Therefore, they have demand curves that slope upward. 55 55 60 60

61
How do wages affect labour supply?
If substitution effect is greater than the income effect for the consumer he/she will work more. If income effect is greater than the substitution effect for the consumer he/she will work less. 56 56 61 61

62
How do interest rates affect household saving?
If the substitution effect of a higher interest rate is greater than the income effect, the consumer will save more. If the income effect of a higher interest rate is greater than the substitution effect, the consumer will save less. An increase in the interest rate could either encourage or discourage saving. 57 57 62 62

63
Do the poor prefer to receive cash or in-kind transfers?
If an in-kind transfer of a good forces the recipient to consume more of the good than he would on his own, then the recipient prefers the cash transfer. If the recipient does not consume more of the good than he would on his own, then the cash and in-kind transfer have exactly the same effect as before the transfer. 58 58 63 63

64
Conclusion Indifference curve analysis describes how individuals make decisions. It has many relevant and interesting applications. If people behave as if they followed the model, then the model will yield accurate and useful predictions and results. 59 59 64 64

65
Overview The budget constraint Indifference curves
The consumer’s optimal choice Income and substitution effects on choice Deriving the demand curve 65 65

Similar presentations


