Download presentation
Presentation is loading. Please wait.

1
Ecology

2
C. Levels of Organization
I. Introduction A. Definition The study of the interactions between organisms & organisms with their environment. B. Parameters 1. Abiotic – non-living. Like? 2. Biotic C. Levels of Organization

3
D. Distribution of Life 1. Chemistry 2. Biology 3. Ecology
Subatomic Particles Atoms Molecules Macro - Molecules 2. Biology Tissues Organs Organisms Organelles Cells 3. Ecology Population Community Ecosystem Biome Biosphere D. Distribution of Life

4
1. Dispersal Limitations
a. Not all areas are accessible – geographic isolation b. Each species has an actual and a potential range Potential range = area over which a species could survive if transplanted

5
2. Behavior and Habitat Selection
a. Animals mainly 3. Biotic Factors a. Disease b. Herbivory c. Absence of symbionts d. Lack of pollinators e. Competition

6
4. Competition a. Factors i. Whenever the quantity of useful matter or
energy falls below the level needed for the maximal growth of two or more organisms which must draw on the same supply, a contest begins. ii. The more similar the needs the greater the intensity of competition. iii. Competition from introduced species can shrink an organism’s actual range

7
b. Reasons? i. water ii. nutrients iii. light iv. heat v. carbon dioxide, oxygen vi. space vii. pollinators

8
5. Abiotic Factors a. Limits i. Climate
Varies from place to place, season to season. Each organism has an optimum environment needed for maximum growth.

9
Temperature & annual precipitation (climate vs
Temperature & annual precipitation (climate vs. weather) are the most important factors determining the distribution of organisms on a global scale (biomes). ……Thus scientists predict that climate change may radically alter the distribution of organisms/ecosystems on earth.
 are the most important factors determining the distribution of organisms on a global scale (biomes). ……Thus scientists predict that climate change may radically alter the distribution of organisms/ecosystems on earth.")
10
Fig 52.20

11
Effects of climate on biogeography
Climate varies with latitude because of differences in the angle of sunlight (seasons) Solar radiation creates wind currents, ocean currents, and precipitation (from evaporation)
 Solar radiation creates wind currents, ocean. currents, and precipitation (from evaporation)")
12
Fig 52.10

13
Fig 52.10

14
ii. Weather = Local climate
Proximity to water, mountains E or W side of land mass S slope drier than N slope (thus different plant communities) iii. Precipitation = Microclimate Forest floor vs. canopy Under a log Within the litter layer
 iii. Precipitation = Microclimate. Forest floor vs. canopy. Under a log. Within the litter layer.")
15
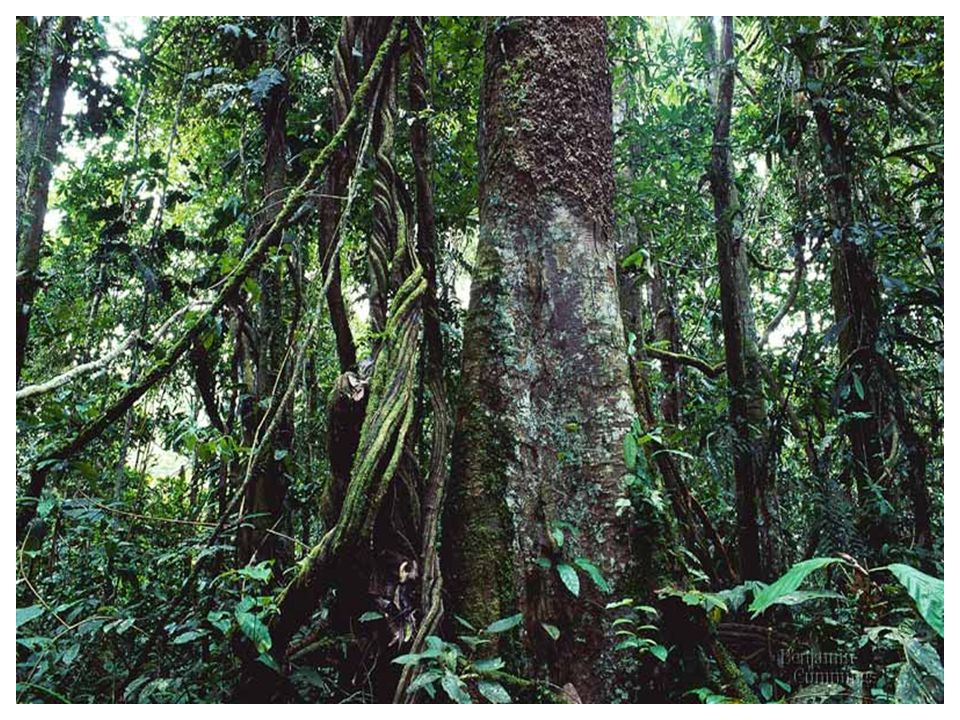
Your ecosystem type: coastal temperate rainforest
Fig

16
II. Biomes A. General Characteristics
1. Limits Locations of the earth’s biomes due to: a. Latitude – affects temperature, precipitation b. Positions of the continents 2. Structure One biome type may occur in different areas of the world but different plant species but same: a. Physiognomic structure – size; shape; types of organisms & their relation to each other & the physical environment b. Due to convergent evolution – similar phenotypes due to similar selection pressures over time. Similar climate, soils, disturbance patterns,…

17
B. Types Fig

18
1. Terrestrial a. Name Tropical rainforest b. Location
Equatorial region c. Characteristics High average annual temp and precipitation, Lush, dense vegetation, Very diverse! Large vertical stratification due to competition for light

20
a. Name Savanna b. Location rimming Equatorial region c. Characteristics Grasslands with scattered trees, Large herbivores & predators, Rainy & dry season! Fire adapted

22
a. Name Desert b. Location Along Tropic of Cancer and Capricorn c. Characteristics < 30 cm of rain per year, High temperatures, CAM plants! Unique plants with adaptations to harsh environment

24
a. Name Chapparal b. Location Along rugged hilly salt water coasts c. Characteristics Evergreen shrubs, Hot dry summers, mild wet winters, Fire-dependent! – seeds germinated after fire, roots fire-resistant

26
a. Name Temperate Grassland b. Location Along 30o N and S parallel inland c. Characteristics No trees, Typically 4 seasons, Occasional fire, Fertile soils

28
a. Name Temperate deciduous forest b. Location Along 30o N and S parallel coastal c. Characteristics Deciduous trees, 4 seasons (cold winter – dormant), Open forests
, Open forests.")
30
a. Name Coniferous Forest b. Location N hemisphere above 30o c. Characteristics Evergreen trees (gymnosperms), Largest biome on earth, 4 seasons, large amounts of snowfall

32
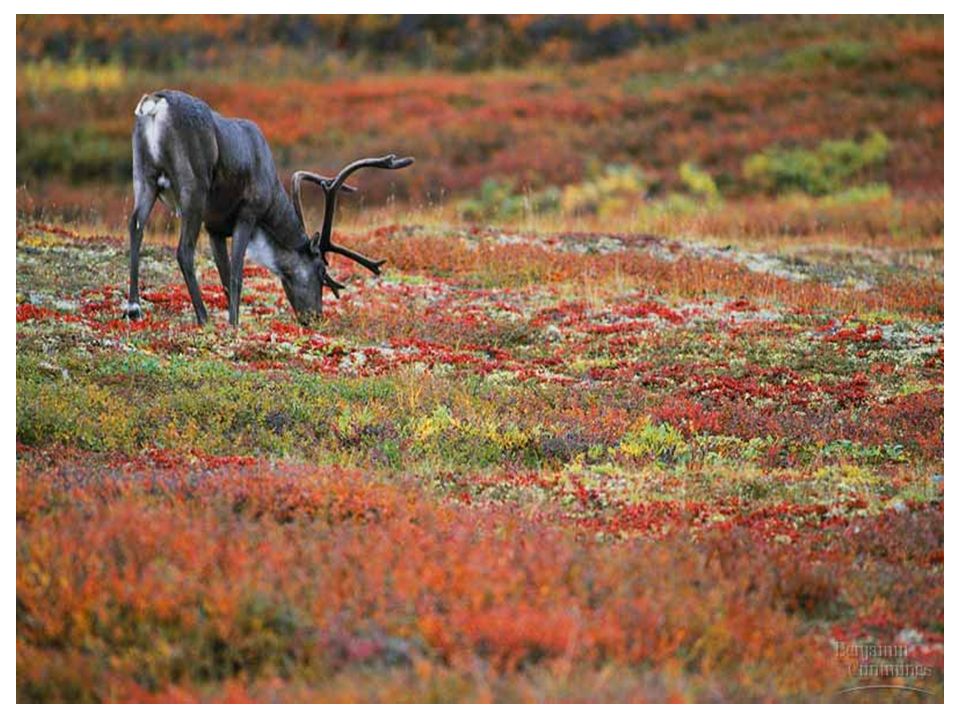
a. Name Tundra b. Location N hemisphere or high altitude c. Characteristics Permafrost – permanently frozen subsoil, Very cold, high winds, No trees or tall plants, 20% of land area on earth, Low annual precipitation

34
2. Aquatic a. Name Fresh relatively still - Lakes b. Location ???
c. Characteristics Thermocline, tubidity varies, oligotrophic versus eutrophic

36
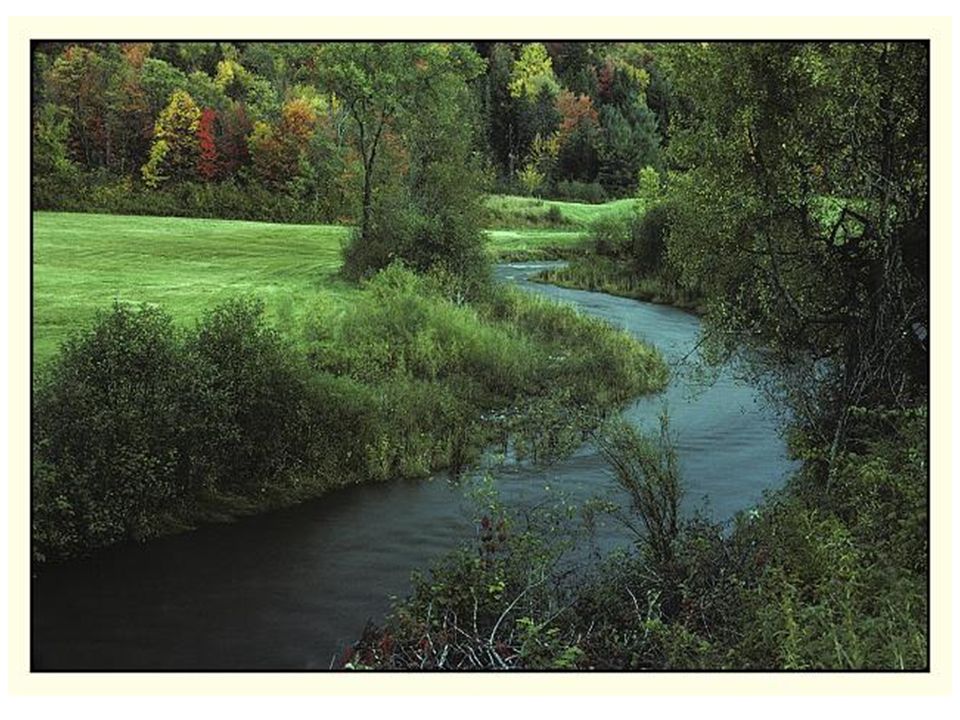
a. Name Fresh moving water - Rivers and Streams b. Location ??? c. Characteristics Current, temperature and turbidity varies, vertical zones

38
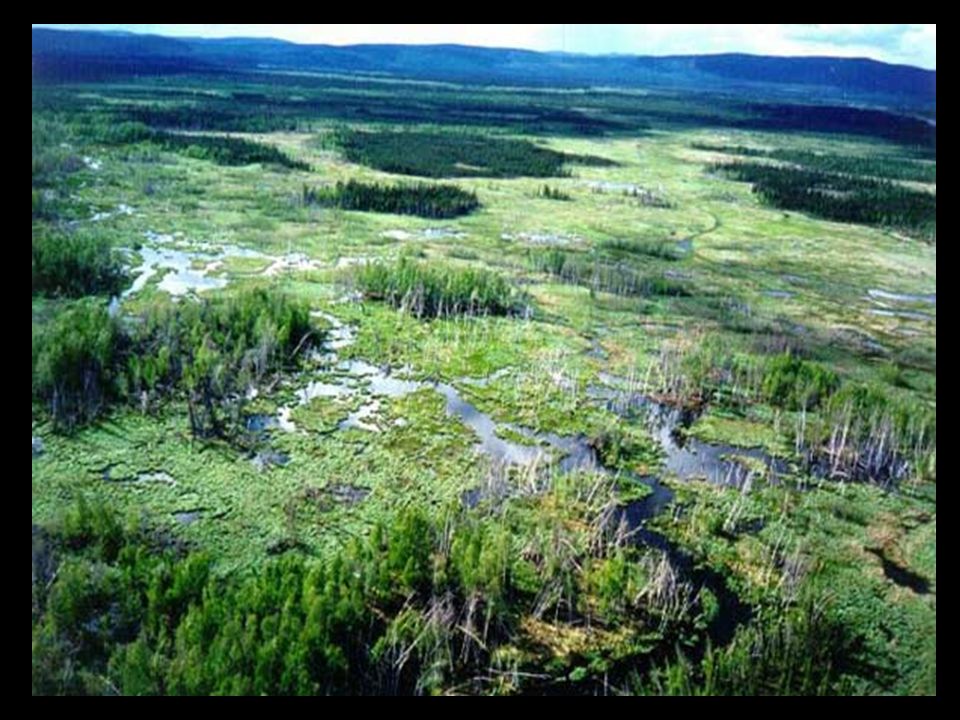
a. Name Wetlands b. Location ??? c. Characteristics Temporary to semi-permanent, temperature and turbidity varies

40
a. Name Estuaries b. Location ??? c. Characteristics Salt fluctuations, temperature, depth, and turbidity varies

42
a. Name Oceanic b. Location ??? c. Characteristics Salt fluctuations, temperature, depth, and turbidity varies, vertical zones

44
Plant Population Ecology I. Introduction
A. Characteristics 1. Dispersion a. Patterns of Dispersion: i. Clumped – individuals in patches (ex. due to soil types, seed dispersal by animals) ii. Uniform – evenly spaced due to: Competition for resources or Allelopathy – plants secrete chemicals to inhibit nearby growth iii. Random – unpredictable; position of one individual cannot be predicted from position of another.
 ii. Uniform – evenly spaced due to: Competition for resources or Allelopathy – plants secrete. chemicals to inhibit nearby growth. iii. Random – unpredictable; position of one individual. cannot be predicted from position of another.")
45
Clumped lupine

46
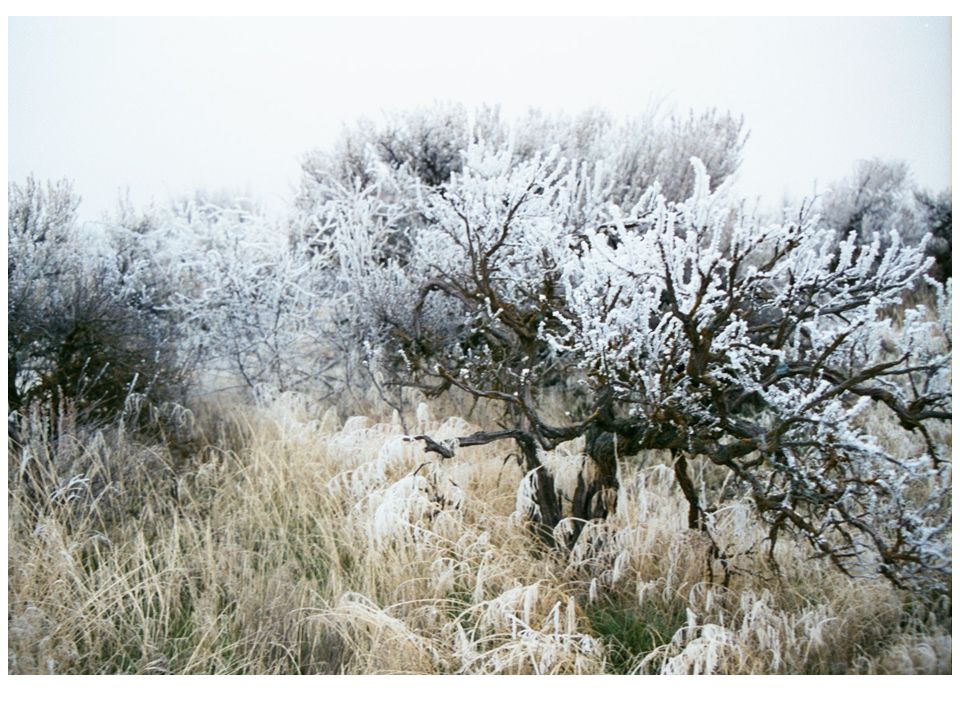
Uniform dispersal of sagebrush

47
Random trees

48
2. Population Size a. Demography = study of factors that affect the
growth & decline of populations i. Increase by reproduction, immigration ii. Decrease by death, emigration Change in Population size = (B + I) – (D + E) If B – D = 0, then zero population growth
 – (D + E) If B – D = 0, then zero population growth.")
49
Fig. 53.9

50
b. Life History = events from birth through
reproduction to death i. Dormancy, germination, growth, reproduction, dispersal, death ii. Trade-offs between investments in reproduction & survival when there are limited resources

51
Controls at every stage of life history
Dormancy (seed bank) seedling growth mature plant reproduction death Seeds washed away, eaten, decomposed Seeds rain from mature plants Herbivory, disease, competition, drought, flood, freeze New resources available, perfect growing conditions, freedom from disease, competition, drought
 seedling. growth. mature plant. reproduction. death. Seeds washed away, eaten, decomposed. Seeds rain from mature plants. Herbivory, disease, competition, drought, flood, freeze. New resources available, perfect growing conditions, freedom from disease, competition, drought.")
52
3. Growth The j-shaped curve a. Patterns i. Exponential
Occurs when resources are abundant or when an important constraint has be removed. Ex. Recolonization after fire Represents a doubling of the population in a specified time. Time Number of Individuals The j-shaped curve

53
Initial carrying capacity
i. Logistical Steady increase followed by a plateau due to ????. Time Number of Individuals Initial carrying capacity New carrying capacity Logistic growth

54
b. Limits Biotic Potential (r)
i. Intrinsic Factors Plenty of food, living space, and other resources. No competition Habitat is free of predators and pathogens. Density & competition for resources will cause reproduction rates to decline or stabilize

55
Any essential resource that is in short supply is a limiting factor on population growth.
food micro-nutrients refuge from predators living space pollution-free environment

56
ii. Environmental resistance affects the number of
individuals of a given species that can be sustained indefinitely in a particular area. K Time Number of Individuals Introduction Colonization Naturalization

57
iii. Carrying Capacity (K)
The maximum population size a particular area or habitat can support at a particular time. Is not fixed - K may decrease when a large population damages or depletes its own resource supply.

58
4. Control a. Factors i. Density Independent Control
ii. Density Dependent Control

59
5. Adaptations a. At low density, population is limited only by
intrinsic rate of growth (r) b. At high density, population is limited by carrying capacity (K) c. r versus K strategy d. Competitive, Ruderals, and Stress Tolerant
 b. At high density, population is limited by. carrying capacity (K) c. r versus K strategy. d. Competitive, Ruderals, and Stress Tolerant.")
60
i. r - selection Disturbance creates low-density conditions, frees resources (fire, flood, volcano) Biotic potential (r) limits population size Adaptations that are successful for these conditions: Produce large # of seeds fast Wind dispersal of seed Plants grow & flower quickly (annuals) Few chemical/mechanical defenses
 limits population size. Adaptations that are successful for these conditions: Produce large # of seeds fast. Wind dispersal of seed. Plants grow & flower quickly (annuals) Few chemical/mechanical defenses.")
61
ii. K-selection High density, population size close to K Not much “new” space – competition for resources Adaptations that are successful for these conditions: Perennial Fewer, larger seeds Defenses against herbivores, pathogens Adaptations to shading, poor soils

62
K & r selected species exist together because small-
scale disturbances create space (exposed soil) for r species (colonizers) Ex. Downed tree, badger holes, grazing disturbance
 for r. species (colonizers) Ex. Downed tree, badger holes, grazing disturbance.")
64
Plant Community Ecology
I. Background A. Definition 1. Groups of organisms of different species (populations) living and interacting with each other and the habitat
 living and interacting with each other and the habitat.")
65
B. Hypothesis of Structure
1. Question? Are plant communities a real entity in nature? Why are certain species found together? 2. Hypotheses: a. Individualistic hypothesis - Gleason i. Species are found together in nature because they have similar abiotic requirements ii. No distinct boundaries between communities iii. Each species distributed along its tolerance range iv. Thus communities change continuously along a gradient

66
b. Integrated Hypothesis - Clements
i. Plant communities function as a real, integrated unit. ii. Plant species found together because of interactions with each other & the rest of the ecosystem. iii. Thus species are clustered into discrete communities with definite distribution boundaries.

67
Fig 53.29 Which is correct?

68
c. So? Individualistic/Continuum “more correct”, but evidence of both – some sharp boundaries due to dramatic environmental changes.

69
II. Characteristics of communities
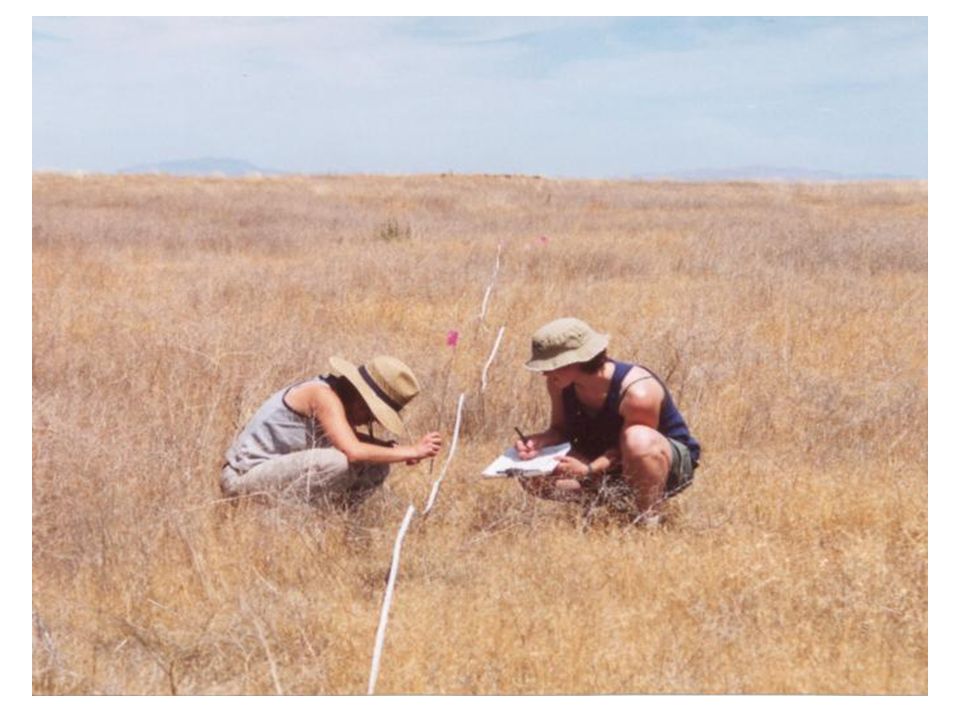
A. Diversity – composed of: 1. Richness – the total number of species in the community 2. Evenness – the relative abundance of species in the community (some dominant, some rare) a. Relative abundance = # individuals of species X divided by total # of individuals in the community
 a. Relative abundance = # individuals of. species X divided by total # of individuals in the. community.")
70
Which community is more diverse??
Fig 54.9 Which community is more diverse??

71
Fig. 54.9

72
B. Factors 1. Abiotic a. Each species has a tolerance range – range
of conditions under which it can survive & reproduce b. Climate – temp, moisture c. Soil – types, pH d. Latitude & altitude

73
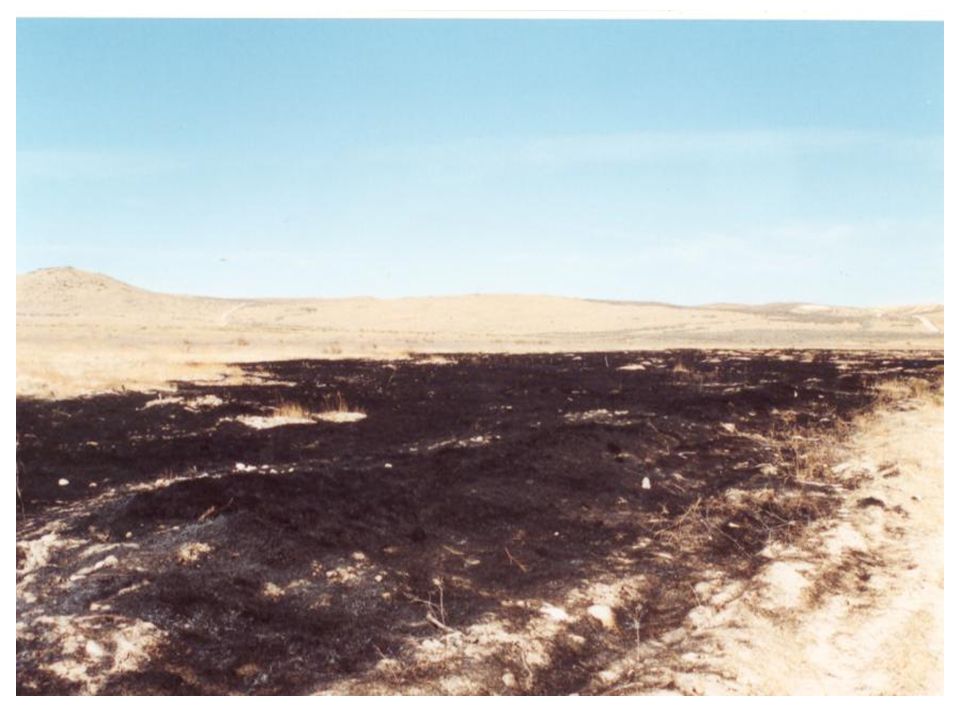
e. Disturbance i. Decrease or total elimination of the biotic components of the habitat ii. Results: decrease in biomass, diversity iii. Natural events – fire, flood, volcano, avalanche iv. Human-caused – herbicides, roads, development, logging, grazing, farming, mining v. Opens resources, creating opportunities for new species, different composition vi. All communities have evolved with some type of disturbance, varying in type, frequency, & severity

74
vii. Small-scale, frequent disturbance
Creates patches within the ecosystem Thus increase in diversity Ex. Trees downed in wind storm Can prevent large-scale disturbance – fire! Ex. Yellowstone fire of 1988 Fire suppression in fire-dependent ecosystem caused massive, stand-replacing fire

77
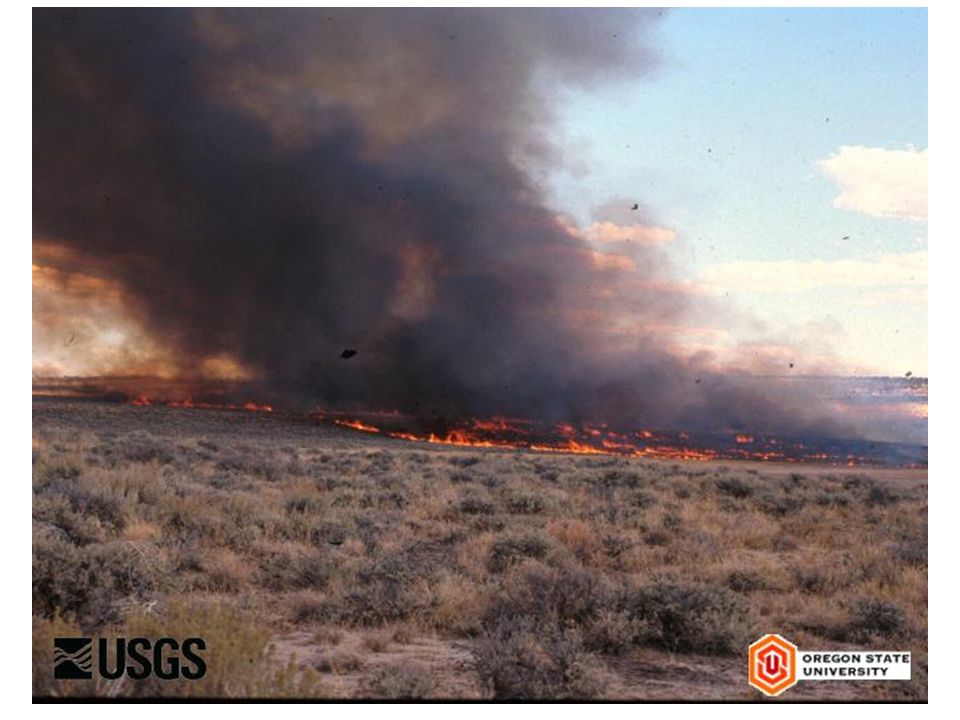
viii. Human Caused Example Cheatgrass – wildfire cycle Overgrazing in ecosystem that did not evolve with large herbivores Cheatgrass introduction Decrease in fire frequency (100 yr to 5 year cycle) Conversion of ecosystem with tremendous loss of Diversity These types of problems creating mass extinction worldwide.
 Conversion of ecosystem with tremendous loss of. Diversity. These types of problems creating mass extinction. worldwide.")
84
2. Biotic a. The plant itself i. Can modify the environment
ii. Modifications can be +, -, or neutral to the plant iii. Benefit ex: beech/oak forest creates shade needed for other young beech & oak to grow iv. Detriment ex: pine forest creates shade but pines need lots of light to grow (succession)
")
85
b. Other plant species i. Theory of competitive exclusion: When two
species compete for the same limiting resource (occupy the same niche), the species that is less adapted will be excluded from the community by the superior competitor. If this theory is true, then actually very little competition in nature, because each plant occupies a niche.
, the species that is less. adapted will be excluded from the community by the. superior competitor. If this theory is true, then actually very little competition in. nature, because each plant occupies a niche.")
86
low high Light intensity Species Abundance Species A Species B A B C D

87
Resource partitioning creates niches
B C D Species A Species B

88
ii. Niche A set of conditions exploited best by only one species Includes all aspects of a species’ use of biotic & abiotic resources (microclimate, rooting zone, pollinators, etc) A species’ role in the ecosystem.
 A species’ role in the ecosystem.")
89
c. Other (non-plant species)
i. Mutualism – both organisms benefit Examples: Mycorrhizal fungi, N-fixing bacteria in root nodules Pollinator gets nectar and plant gets pollen transfer Animals eat fruit (nutrition) and seeds are dispersed Acacia trees get defense from herbivores & ants get home, food
 and seeds are dispersed. Acacia trees get defense from herbivores & ants get. home, food.")
91
ii. Commensalism – one species benefits & other is
not affected Bird nests in trees, seeds stuck on animal fur iii. Competition – both harmed iv. Predation – one harmed, other benefits Herbivory Pathogens

92
Predation or the need to keep your wits about you?

93
C. Controls on community structure
a. Dominant species = species with the highest abundance or biomass in the community i. Best species among all species in the community at exploiting the limiting resource ii. Controls occurrence & distribution of other species iii. If eliminated, other species take over Example: Douglas fir

94
b. Keystone species i. Control community structure by their ecological role ii. If eliminated, drastic change in community structure or composition Example Sea otter – reduction in populations caused boom in sea urchin population, destroying kelp forests (drastic decline in diversity)
")
95
III. Succession A. Definition 1. Changes in community structure &
composition over time following a disturbance 2. Species thriving on a site are gradually replaced by other species. 3. Species replacement continues until the composition of species becomes relatively steady under prevailing climatic conditions & disturbance regimes (dynamic equilibrium, not climax).
.")
96
B. Types 1. Primary Succession a. Characteristics
i. New area of mineral rock – no soil yet (volcano, glacier retreat)
")
97
b. Sequence: i. Lichens & mosses colonize bare rock ii. As these decay, acids weather the rock & primitive soil forms iii. Pioneer plants establish (r-selected or Stress tolerant) iv. Pioneers replaced by K-selected (Ruderal and Competitive)
 iv. Pioneers replaced by K-selected (Ruderal and. Competitive)")
98
c. The Nature of Pioneer Species
i. Adapted to growing in habitats that cannot support most species: intense sunlight, wide swings in temperature, moisture deficits. ii. Typically small plants, short life cycles, producing an abundance of small seeds which are quickly dispersed (wind & water) iii. Can grow in N-poor soil because of their mutualistic interactions with nitrogen-fixing bacteria.
 iii. Can grow in N-poor soil because of their. mutualistic interactions with nitrogen-fixing bacteria.")
99
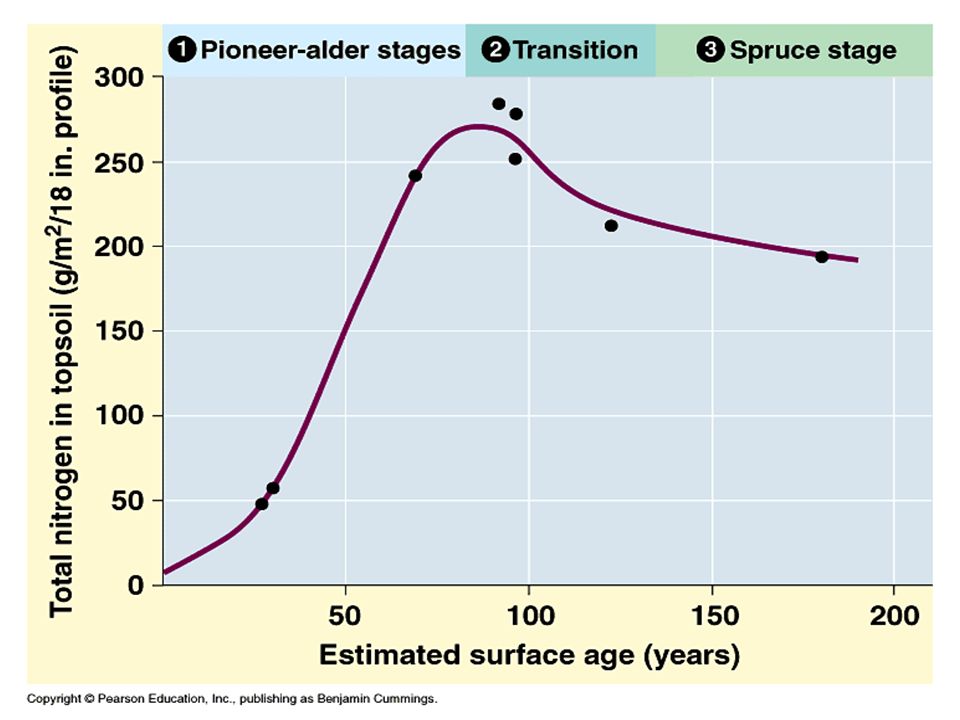
Example of primary succession: glacial retreat

103
Alders & cottonwoods dominate

104
Spruce enter forest and replace alders/cottonwoods

105
Hemlock slowly replace Spruce. Hemlock is “climax”

106
iv. Facilitation Improve the living conditions for other species, setting the stage for their own replacement. Accumulation of their wastes and remains adds volume to the soil and enriches it with nutrients that allow other species to take hold.

107
2. Secondary Succession a. Characteristics
i. Plant community is destroyed but soil remains while new soil exposed ii. Examples? abandoned farm fields, clear cuts, wind storms, fire. iii. Typical progression: small herbs & grasses shrubs trees

108
b. Pioneer species i. r-selected (stress tolerant) (species move in first when competition is low (low density). ii. Sometimes these opportunistic species (especially invasive weeds!) inhibit the growth of the native climax species changing the structure and type of climax community forever. Ex. cheatgrass
 inhibit the growth of the native climax. species changing the structure and type of climax. community forever. Ex. cheatgrass.")
109
It has been a journey worth taking.

Similar presentations


 l temperature l light l water l nutrients l wind l disturbance l Biotic (living) l.>")


