Download presentation
Presentation is loading. Please wait.

1
Population Dynamics, Carrying Capacity and Conservation Biology
CHAPTER 9 Population Dynamics, Carrying Capacity and Conservation Biology

2
A. Characteristics of a population
I. Population Dynamics A. Characteristics of a population 1. Size - number of individuals 2. Density - number of individuals per space 3. Age Distribution – portions of individuals of each age

3
4. Dispersion – spatial patterns of organisms

4
B. Factors that govern population size
Immigration Births Deaths Emigration

5
C. Terms Related to Populations
1. Zero Population Growth Lost = Gains 2. Biotic Potential Populations Capacity for growth

6
3. Intrinsic Rate of Increase (r)
Rate at which a population would grow with unlimited resources Populations with a high “r”… Reproduce early in life Short generation times Can reproduce many times Have many offspring each time they reproduce

7
4. Environmental Resistance
All factors acting jointly to limit the growth of a population Together biotic potential and environmental resistance determine…

8
5. Carrying Capacity “k” -Number of individuals of a given species that can be sustained in a given space indefinitely

9
6. Minimum Viable Population (MVP)
Fewest number of members of a species needed to insure the species survives If a population declines below MVP… - Certain individuals may not be able to find a mate -Interbreeding occurs (weak or mutant offspring) -Genetic diversity may be too low to adapt to environmental changes
 -Genetic diversity may be too low to adapt to environmental changes.")
10
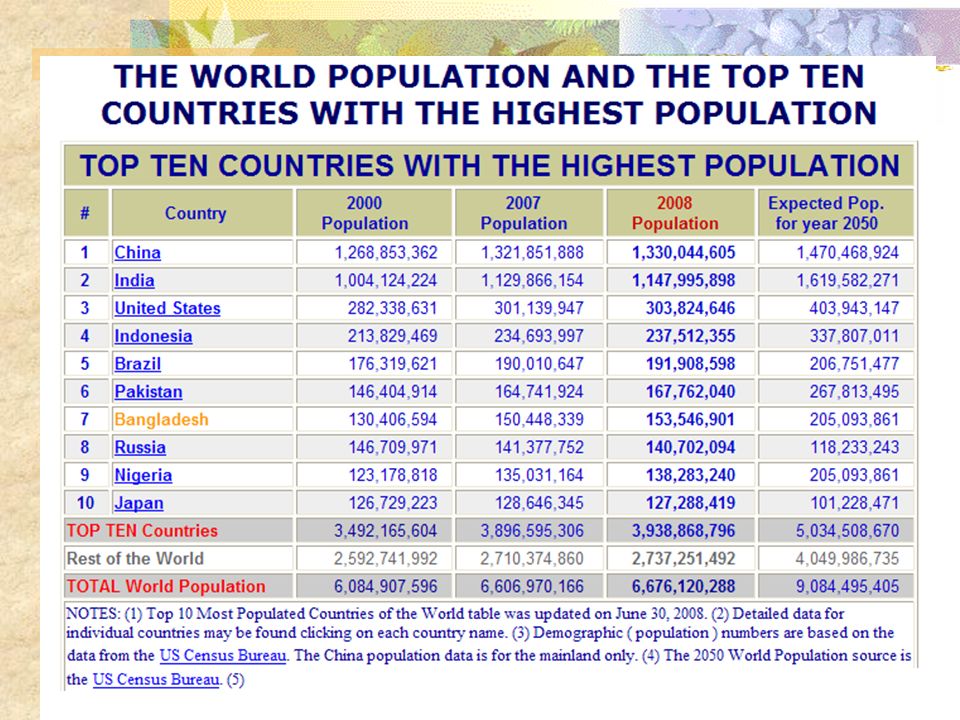
D. Estimating Carrying Capacity
Best done using an ecological footprint “The total area of productive land and water required on a continuous basis to produce the resources consumed, and to assimilate the wastes produced, by that population, wherever on Earth the land (and water) is located”
 is located")
11
Six Types of Productive Areas Used to Calculate Ecological Footprint
*Arable land *Ocean *Pasture *Built-up Land *Forest *Fossil Energy Land All converted to Hectares (1 ha = 2.47 acres) About 2 ha per person on planet (1.7 if use land for parks)
 About 2 ha per person on planet. (1.7 if use land for parks)")
12
*U.S. has footprint of 8.4 ha/person but only 6.2 ha/person available
*Counties vary greatly in their individual footprint size and ecological capacity. *U.S. has footprint of 8.4 ha/person but only 6.2 ha/person available *Overall analysis suggests world is over carrying capacity. U.S. World

13
II. POPULATION GROWTH Growth occurs in two ways… A. Exponential:
Population with few or no resource limitations. Starts slow and increases “J-shaped curve” Population size (N) Time (t)
 Time (t)")
15
Slowing as the population encounters environmental resistance
B. Logistic: Exponential at first… Slowing as the population encounters environmental resistance “S- shaped curve” K Population size (N) Time (t)
 Time (t)")
16
Number of sheep (millions)
2.0 1.5 1.0 .5 Number of sheep (millions) 1800 1825 1850 1875 1900 1925
")
18
What if Population Size Exceeds “k”
-A population may use up resources and overshoot the “k” -Overshoot occurs due to… Reproductive Lag Time Period needed for the birth rate to fall and the death rate to rise in response to overconsumption

19
- This lag can cause Dieback or Crash
-Occurs unless the excess individuals… Switch to new resources Move to an area with more favorable conditions

20
Reindeer in Alaska 2,000 1,500 Number of reindeer 1,000 500 1910 1920
1930 1940 1950 Fig. 9.6, p. 201 Year

21
-Potato Famine -Ireland (1845)
Humans are not exempt from carrying capacity diebacks and crashes… -Easter Island -Potato Famine -Ireland (1845)
")
22
SHOW VIDEO http://www.youtube.com/watch?v=-hO-vCPuuQQ

23
The earth’s carrying capacity has been extended by…

24
III. Factors that Affect Carrying Capacity
Competition Immigration and Emigration Catastrophic Events Seasonal Fluctuations

25
(environmental resistance)
POPULATION SIZE Growth factors (biotic potential) Favorable light Favorable temperature Favorable chemical environment (optimal level of critical nutrients) Abiotic Biotic High reproductive rate Generalized niche Adequate food supply Suitable habitat Ability to compete for resources Ability to hide from or defend against predators Ability to resist diseases and parasites Ability to migrate and live in other habitats Ability to adapt to environmental change Decrease factors (environmental resistance) Too much or too little light Temperature too high or too low Unfavorable chemical environment (too much or too little of critical nutrients) Low reproductive rate Specialized niche Inadequate food supply Unsuitable or destroyed habitat Too many competitors Insufficient ability to hide from or defend Inability to resist diseases and parasites Inability to migrate and live in other Inability to adapt to environmental
 Favorable light. Favorable temperature. Favorable chemical environment. (optimal level of critical nutrients) Abiotic. Biotic. High reproductive rate. Generalized niche. Adequate food supply. Suitable habitat. Ability to compete for resources. Ability to hide from or defend. against predators. Ability to resist diseases and parasites. Ability to migrate and live in other. habitats. Ability to adapt to environmental. change. Decrease factors. (environmental resistance) Too much or too little light. Temperature too high or too low. Unfavorable chemical environment. (too much or too little of critical. nutrients) Low reproductive rate. Specialized niche. Inadequate food supply. Unsuitable or destroyed habitat. Too many competitors. Insufficient ability to hide from or defend. Inability to resist diseases and parasites. Inability to migrate and live in other. Inability to adapt to environmental.")
26
IV. Population Limiting Factors
A. Density-Independent Controls: Affect a population size regardless of the density Flood, hurricanes, drought, fire, habitat destruction, pesticide spraying

27
B. Density-Dependent Controls:
Greater effect as density increases Competition, predation, parasitism and disease

28
C. Natural Population Curves
1. Stable: Fluctuates slightly above and below the “k” 2. Irruptive: Population explodes and crashes back to a lower level 3. Irregular: Changes irregularly for unknown reasons 4. Cyclic: Sharp increases followed by crashes in a regular pattern

29
Time Number of individuals 3. Irregular 1. Stable 4. Cyclic
2. Irruptive 1. Stable 4. Cyclic 3. Irregular

30
V. Predation and Population Control
1. Top-Down Hypothesis -Possible explanation for the 10-year population cycles of Hare and Lynx -Lynx preying on hares reduce their population -Shortage of hares reduces the lynx population -Lower # of Lynxes, hares increase -Lynx pop. Increases due to greater food supply

32
2. Bottom-Up Control *Second possible reason for hare decline
Based on study where hare numbers decreased on island w/o lynx members Believed that population crashes may be a result of decreases in primary producers

33
Population size (thousands)
The Lynx-Hare Cycle Population size (thousands) 160 140 120 100 80 60 40 20 1845 1855 1865 1875 1885 1895 1905 1915 1925 1935 Year Hare Lynx
 Year. Hare. Lynx.")
34
VI. REPRODUCTION AND SURVIVAL
A. Types of reproduction: -Asexual: Creates a genetic clone Common in simple organism -Sexual: Create offspring by union of gametes Costly/risky to organisms Done by 97% of known organisms

35
B. Reproduction Patterns
1. Opportunists: (r-selected species) -Reproduce early and put most of their energy into it -Large litters -Reach reproductive age early -Short generation times Little or no care to the offspring -Reproduce quickly when a disturbance opens up a new niche -Often get displaced by a more competitive species
 -Reproduce early and put most of their energy into it. -Large litters. -Reach reproductive age early. -Short generation times Little or no care to the offspring. -Reproduce quickly when a disturbance opens up a new niche. -Often get displaced by a more competitive species.")
36
r-Selected Species Many small offspring
cockroach dandelion Many small offspring Little or no parental care and protection of offspring Early reproductive age Most offspring die before reaching reproductive age Small adults Adapted to unstable climate and environmental conditions High population growth rate (r) Population size fluctuates wildly above and below carrying capacity (K) Generalist niche Low ability to compete Early successional species
 Population size fluctuates wildly above and below. carrying capacity (K) Generalist niche. Low ability to compete. Early successional species.")
37
2. Competitor or (k-Selected Species)
-Put little energy into reproduction -Reproduce late in life -Few offspring -Long generations -Put energy into protection and nurturing -Display long growth -Thrive best in constant environments *Availability of habitat determines the population size

38
Fewer, larger offspring High parental care and protection of offspring
Later reproductive age Most offspring survive to reproductive age Larger adults Adapted to stable climate and environmental conditions Lower population growth rate (r) Population size fairly stable and usually close to carrying capacity (K) Specialist niche High ability to compete Late successional species elephant saguaro K-Selected Species
 Population size fairly stable and usually close. to carrying capacity (K) Specialist niche. High ability to compete. Late successional species. elephant. saguaro. K-Selected Species.")
39
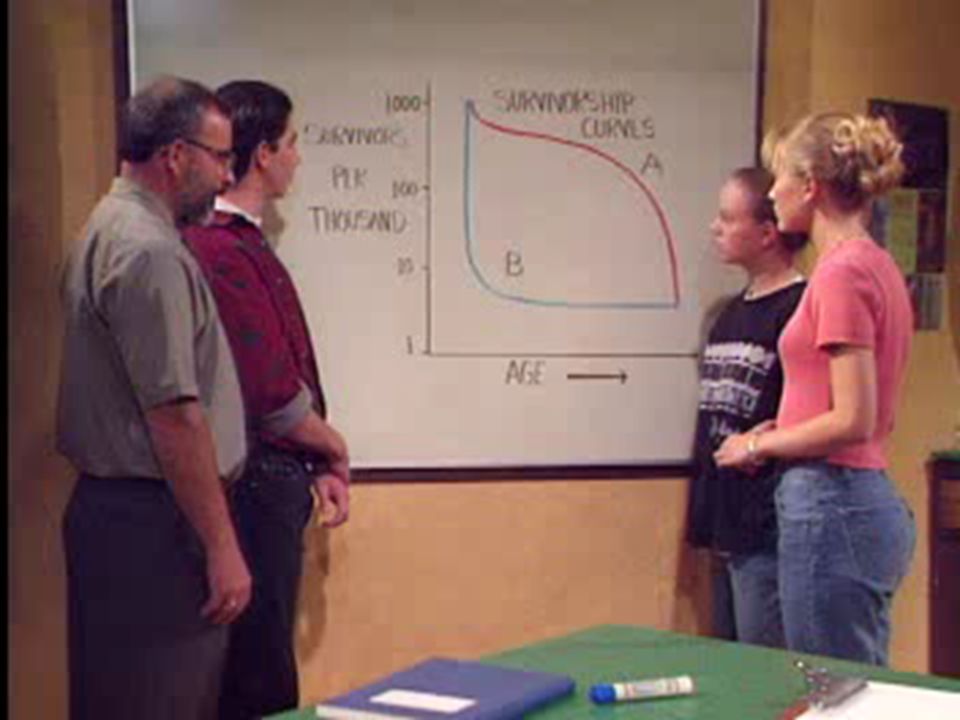
C. Survivorship Curves Shows the number of survivors at each age group of a particular species Late Loss: k-selected species, reduced juvenile mortality Ex: Humans and elephants Early Loss: r-selected species, high juvenile mortality Constant Loss: face mortality at all ages Songbirds, lizards, small mammals

40
Percentage surviving (log scale)
100 10 1 Age

42
VII. CONSERVATION BIOLOGY
Sustaining wildlife populations Goals: Investigate human impacts on biodiversity Develop practical approaches to maintain biodiversity Key Topics: Endangered species management Wildlife reserves Ecological Restoration Ecological Economics Environmental Ethics

43
3 Principles of Conservation Biology
Biodiversity is necessary to all life and should not be reduced by human actions Humans should not hasten extinction The best way to preserve biodiversity is to protect intact ecosystems and provide habitat

Similar presentations


 that live in the same place at the same time and compete for the same resources. Resources.>")


