Download presentation
Presentation is loading. Please wait.

1
2.6.1-.2 Populations

2
A look at the factors that tend to increase or decrease the size of a population.

3
The population size of a species in a given space at a given time is determined by the interplay between BIOTIC POTENTIAL and ENVIRONMENTAL RESISTANCE. Biotic potential = growth rate with unlimited resources. Environmental resistance = all the factors acting jointly to limit population growth.

4
POPULATION SIZE Growth factors (biotic potential) Favorable light Favorable temperature Favorable chemical environment (optimal level of critical nutrients) Abiotic Biotic High reproductive rate Generalized niche Adequate food supply Suitable habitat Ability to compete for resources Ability to hide from or defend against predators Ability to resist diseases and parasites Ability to migrate and live in other habitats Ability to adapt to environmental change Decrease factors (environmental resistance) Too much or too little light Temperature too high or too low Unfavorable chemical environment (too much or too little of critical nutrients) Abiotic Biotic Low reproductive rate Specialized niche Inadequate food supply Unsuitable or destroyed habitat Too many competitors Insufficient ability to hide from or defend against predators Inability to resist diseases and parasites Inability to migrate and live in other habitats Inability to adapt to environmental change
 Favorable light Favorable temperature Favorable chemical environment (optimal level of critical nutrients) Abiotic Biotic High reproductive rate Generalized niche Adequate food supply Suitable habitat Ability to compete for resources Ability to hide from or defend against predators Ability to resist diseases and parasites Ability to migrate and live in other habitats Ability to adapt to environmental change Decrease factors (environmental resistance) Too much or too little light Temperature too high or too low Unfavorable chemical environment (too much or too little of critical nutrients) Abiotic Biotic Low reproductive rate Specialized niche Inadequate food supply Unsuitable or destroyed habitat Too many competitors Insufficient ability to hide from or defend against predators Inability to resist diseases and parasites Inability to migrate and live in other habitats Inability to adapt to environmental change")
5
Four variables change population size: 1.NATALITY = birth rate 2.MORTALITY = death rate 3.IMMIGRATION = rate of organisms moving in 4.EMIGRATION = rate of organisms moving out

6
Number of individuals Time Carrying capacity K species; experience K selection r species; experience r selection K REPRODUCTIVE STRATEGIES

7
Opportunistic or r-Selected Species cockroachdandelion Many small offspring Little or no parental care and protection of offspring Early reproductive age Most offspring die before reaching reproductive age Small adults Adapted to unstable climate and environmental conditions High population growth rate (r) Population size fluctuates wildly above and below carrying capacity (K) Generalist niche Low ability to compete Early successional species
 Population size fluctuates wildly above and below carrying capacity (K) Generalist niche Low ability to compete Early successional species")
8
Fewer, larger offspring High parental care and protection of offspring Later reproductive age Most offspring survive to reproductive age Larger adults Adapted to stable climate and environmental conditions Lower population growth rate (r) Population size fairly stable and usually close to carrying capacity (K) Specialist niche High ability to compete Late successional species elephantsaguaro Competitor or K-Selected Species
 Population size fairly stable and usually close to carrying capacity (K) Specialist niche High ability to compete Late successional species elephantsaguaro Competitor or K-Selected Species")
9
SURVIVORSHIP CURVES

10
Population density affects population growth.

11
DENSITY INDEPENDENT FACTORS = affect a populations’ size regardless of its population density. 1.Weather 2.Earthquakes 3.Floods 4.Fires... Natural disasters R-strategists populations are most affected by these.

12
DENSITY DEPENDENT FACTORS = affect a populations’ size depending on its population density. 1.Predation 2.Disease 3.Availability of food and water 4.Space Negative Feedback!!

13
INTERNAL FACTORS = might include density-dependent fertility or size of breeding territory. EXTERNAL FACTORS = might include predation and disease.

14
Species interactions influence population growth and carrying capacity = SYMBIOSIS Competition for resources. High Low Relative population density 024681012141618 Days Each species grown alone Paramecium aurelia Paramecium caudatum High Low Relative population density 024681012141618 Days Both species grown together Paramecium aurelia Paramecium caudatum

15
Resource Portioning

16
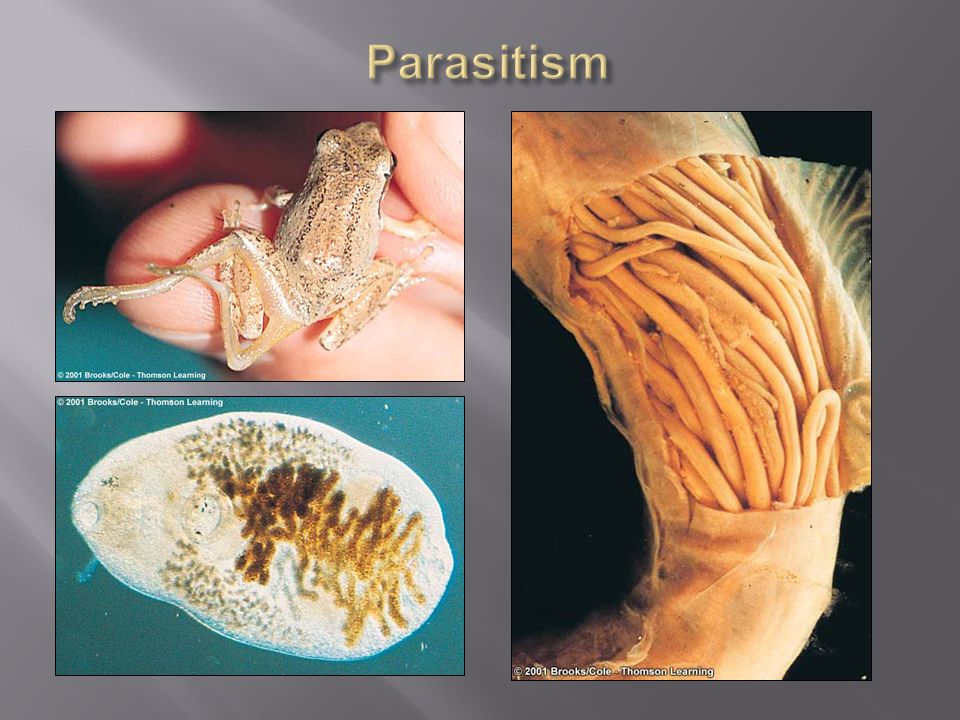
PREDATION PREY POPULATION PREDATOR POPULATION

17
Span worm Bombardier beetle Viceroy butterfly mimics monarch butterfly Foul-tasting monarch butterfly Poison dart frog When touched, the snake caterpillar changes shape to look like the head of a snake Wandering leaf insect Hind wings of io moth resemble eyes of a much larger animal Avoiding predators

19
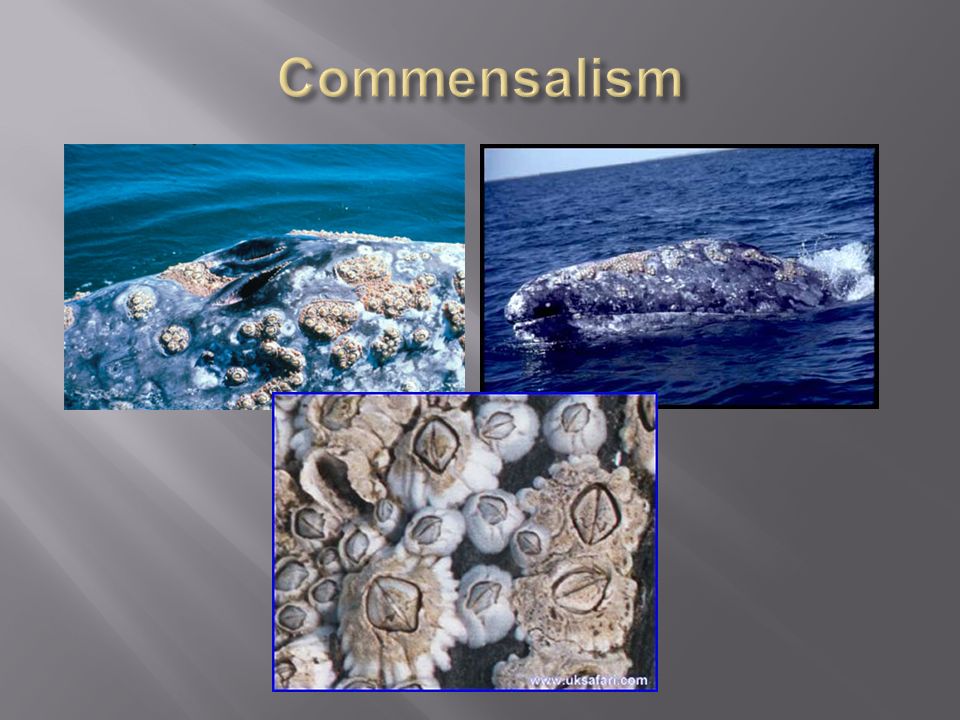
Oxpeckers and black rhinocerosClown fish and sea anemone

20
Shark and ramora

21
Cleaning station Sabertooth blenny Cleaner blenny

24
change in the size of a population over time.

25
POPULATION = a group of interbreeding organisms (same species) that live in the same place at the same time and compete for the same resources. Resources = food, water, shelter, mates, and so on... resources pop. size

26
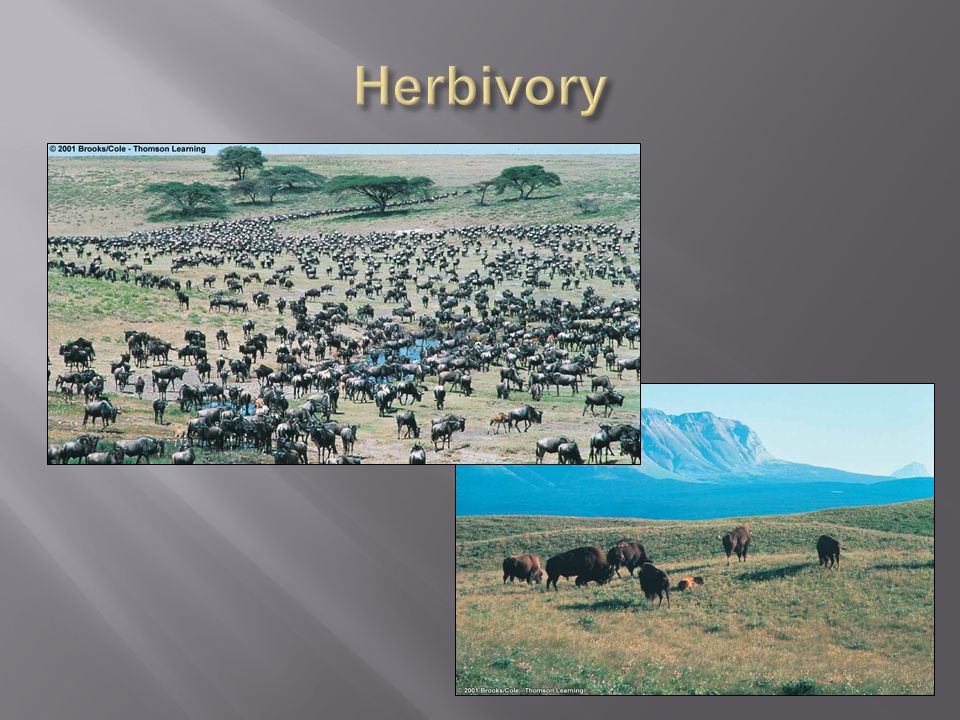
Populations change in response to environmental stress or changes in environmental conditions. 1.In size = # of individuals 2.Density = # of individual / specific space 3.Age distribution = proportions / age group 4.Dispersion = Clumped (elephants) Uniform (creosote bush) Random (dandelions)
 Uniform (creosote bush) Random (dandelions).")
28
No population can grow indefinitely! Every environment has a CARRYING CAPACITY = the maximum number of individuals of a given species that can be sustained indefinitely in a given space. 2.0 1.5 1.0.5 Number of sheep (millions) 180018251850187519001925 Year
 Year.")
29
Factors that affect carrying capacity: 1.Competition with/in and between species. 2.Natural and human caused catastrophes. 3.Immigration and emigration. 4.Seasonal fluctuations in food, water, shelter, and nesting sites.

30
A population that has few if any resource limitations grows exponentially. EXPONENTIAL GROWTH starts out slowly and then proceeds faster and faster as the population increases. Time ( t ) Population size ( N ) “J” population growth curve
 Population size ( N ) J population growth curve.")
31
8 10 24 24 hours later

33
LOGISTIC GROWTH involves initial exponential growth and then there is a steady decrease in growth as the population encounters environmental resistance and approaches carrying capacity and levels off. “S or sigmoid” population growth curve Time ( t ) Population size ( N ) K
 Population size ( N ) K.")
34
Time ( t ) Population size ( N ) K Exponential phase Transitional phase Plateau phase
 Population size ( N ) K Exponential phase Transitional phase Plateau phase")
35
2,000 1,500 Number of reindeer 19101920193019401950 Year 1,000 500

Similar presentations


 that live in the same place at the same time and compete for the same resources. Resources.>")


