Download presentation
Presentation is loading. Please wait.

1
f

3
Propagation of cardiac impulse

4
The Normal Conduction System

5
ECG machine

6
Generation of normal ECG complex

7
What is the heart rate? (300 / 6) = 50 bpm www.uptodate.com
 = 50 bpm")
8
What is the axis? Normal- QRS up in I and aVF

9
What is the diagnosis? Acute inferior MI with ST elevation in leads II, III, aVF Acute inferior MI with ST elevation in leads II, III, aVF

10
What is this rhythm? First degree AV block First degree AV block

11
What is this rhythm? Type 1 second degree block (Wenckebach)
")
12
What is this rhythm? Type 2 second degree AV block Dropped QRS

13
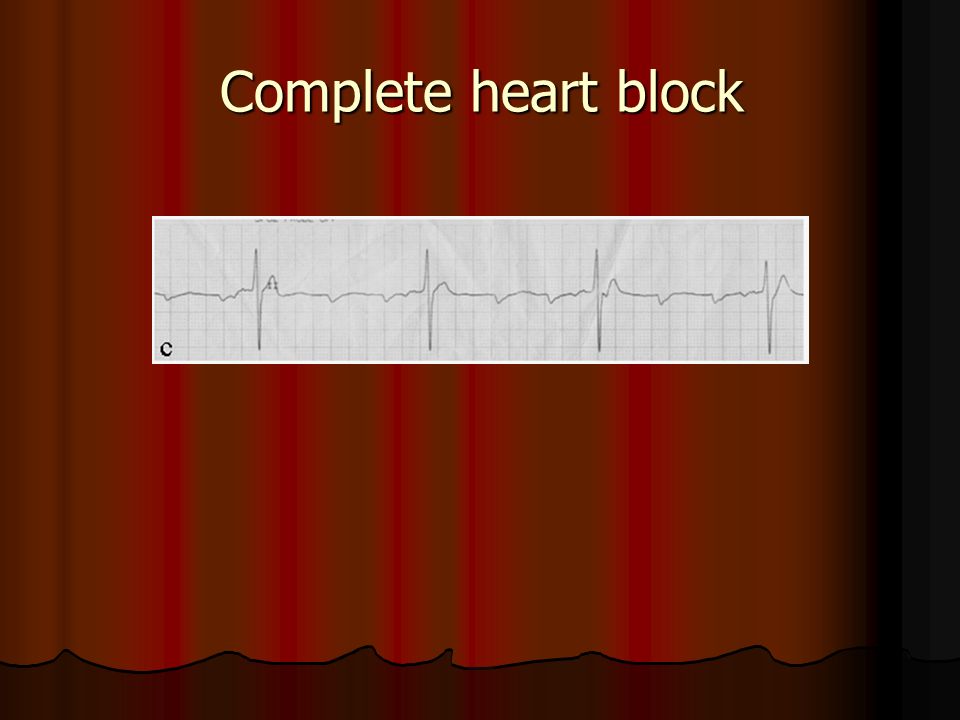
What is this rhythm? 3 rd degree heart block (complete)
")
14
14 ECTOPIC BEATS

15
15 ECTOPIC BEATS

16
16

17
ECG Leads Limb leads: I, II, III, aVR, aVL, aVF, Chest leads: V1-V6 Anterior surface: V1-4. Anterior surface: V1-4. Inferior surface: II, III and aVF. Inferior surface: II, III and aVF. Lateral surface: I, aVL and V5-6. Lateral surface: I, aVL and V5-6.

18
ECG Paper

19
Normal ECG

20
P-wave Normal values 1. Polarity. up in I&II and down in aVR. 2. Duration. < 2.5 mm. 3. Amplitude. < 2.5 mm. < 2.5 mm.Abnormalities 1. Inverted P-wave Junctional rhythm. Junctional rhythm. 2. Wide P-wave (P- mitrale) LAE LAE 3. Peaked P-wave (P-pulmonale) RAE RAE 4. Saw-tooth appearance Atrial flutter Atrial flutter 5. Absent P wave Atrial fibrillation Atrial fibrillation
 LAE LAE 3. Peaked P-wave (P-pulmonale) RAE RAE 4. Saw-tooth appearance Atrial flutter Atrial flutter 5. Absent P wave Atrial fibrillation Atrial fibrillation.")
21
P- mitrale P- pulmonale (LAE) (RAE)
 (RAE)")
22
PR interval Definition: the time interval between beginning of P-wave to beginning of QRS complex. Normal PR interval 3-5mm (0.12-0.2 sec) Abnormalities 1. Short PR interval WPW syndrome WPW syndrome 2. Long PR interval First degree heart block First degree heart block
 Abnormalities 1. Short PR interval WPW syndrome WPW syndrome 2. Long PR interval First degree heart block First degree heart block.")
23
QRS complex Normal values Duration: < 3 mm. Duration: < 3 mm. Morphology: progression from Short R and deep S (rS) in V1 to tall R and short S in V6 with small Q in V5-6 (qRs). Morphology: progression from Short R and deep S (rS) in V1 to tall R and short S in V6 with small Q in V5-6 (qRs). Abnormalities : 1. Wide QRS complex Bundle branch block. Bundle branch block. Ventricular rhythm. Ventricular rhythm. 2. Tall R in V1 RVH. RVH. RBBB. RBBB. Posterior MI. Posterior MI. WPW syndrome. WPW syndrome. 3. abnormal Q wave [ > 25% of R wave] [ > 25% of R wave] MI. MI. Hypertrophic cardiomyopathy. Hypertrophic cardiomyopathy. Normal variant. Normal variant.
 in V1 to tall R and short S in V6 with small Q in V5-6 (qRs). Morphology: progression from Short R and deep S (rS) in V1 to tall R and short S in V6 with small Q in V5-6 (qRs). Abnormalities : 1. Wide QRS complex Bundle branch block. Bundle branch block. Ventricular rhythm. Ventricular rhythm. 2. Tall R in V1 RVH. RVH. RBBB. RBBB. Posterior MI. Posterior MI. WPW syndrome. WPW syndrome. 3. abnormal Q wave [ > 25% of R wave] [ > 25% of R wave] MI. MI. Hypertrophic cardiomyopathy. Hypertrophic cardiomyopathy. Normal variant. Normal variant..")
24
Normal Q wave

25
Q wave in MI

26
Q wave in septal hypertrophy

27
ST- segment Normally it's isoelectric. [i.e. at same level of TP segment] [i.e. at same level of TP segment] Abnormalities: 1. ST elevation: Acute MI. Acute MI. Prinzmetal angina. Prinzmetal angina. Acute pericarditis. Acute pericarditis. Early repolarization. Early repolarization. 2. ST depression: Ischemia. Ischemia. Ventricular strain. Ventricular strain. BBB. BBB. Hypokalemia. Hypokalemia. Digoxin effect. Digoxin effect.
![ST- segment Normally it s isoelectric. [i.e. at same level of TP segment] [i.e.](http://images.slideplayer.com/24/7286416/slides/slide_27.jpg "at same level of TP segment] Abnormalities: 1. ST elevation: Acute MI. Acute MI. Prinzmetal angina. Prinzmetal angina. Acute pericarditis. Acute pericarditis. Early repolarization. Early repolarization. 2. ST depression: Ischemia. Ischemia. Ventricular strain. Ventricular strain. BBB. BBB. Hypokalemia. Hypokalemia. Digoxin effect. Digoxin effect..")
28
Abnormalities of ST- segment

29
T-wave Normal values. 1. Polarity: Always up in I,II,V4-6 Always up in I,II,V4-6 Always down in aVR. Always down in aVR. Variable in III, aVL, aVF, V1-3. Variable in III, aVL, aVF, V1-3. 2. amplitude: < 10mm in the chest leads. Abnormalities: 1. Peaked T-wave: Hyper-acute MI. Hyper-acute MI. Hyperkalemia. Hyperkalemia. Normal variant. Normal variant. 2. T- inversion: Ischemia. Ischemia. Myocardial infarction. Myocardial infarction. Myocarditis Myocarditis Ventricular strain Ventricular strain BBB. BBB. Hypokalemia. Hypokalemia. Digoxin effect. Digoxin effect.

30
QT- interval QT- interval Definition: Time interval between beginning of QRS complex to the end of T wave. QRS complex to the end of T wave. Normally: At normal HR: QT ≤ 11mm (0.44 sec) (or ) QTc = QT/ √RR (or ) QTc = QT/ √RR Abnormalities: 1. Prolonged QT interval: hypocalcemia and congenital long QT syndrome. 2. Short QT interval: hypercalcemia.
 (or ) QTc = QT/ √RR (or ) QTc = QT/ √RR Abnormalities: 1. Prolonged QT interval: hypocalcemia and congenital long QT syndrome. 2. Short QT interval: hypercalcemia..")
31
INTERPRETATION OF ECG STANDARD? NAME? DATE? STANDARD? NAME? DATE? P(SR-nonSR ? rate? regular or irregular?) P(SR-nonSR ? rate? regular or irregular?) ORS(wide or narrow? LBBB OR RBBB? rate? regular or irregular?) ORS(wide or narrow? LBBB OR RBBB? rate? regular or irregular?) T(tall? invert? biphasic?) T(tall? invert? biphasic?) P-R(long? short? fixed or no? relation?) P-R(long? short? fixed or no? relation?) ST(elevate? Depressed? ) ST(elevate? Depressed? ) QT(long? short?) QT(long? short?) AXIS? AXIS?
 P(SR-nonSR . rate. regular or irregular ) ORS(wide or narrow. LBBB OR RBBB. rate. regular or irregular ) ORS(wide or narrow. LBBB OR RBBB. rate. regular or irregular ) T(tall. invert. biphasic ) T(tall. invert. biphasic ) P-R(long. short. fixed or no. relation ) P-R(long. short. fixed or no. relation ) ST(elevate. Depressed. ) ST(elevate. Depressed. ) QT(long. short ) QT(long. short ) AXIS. AXIS .")
32
Rate Rule of 300- Divide 300 by the number of boxes between each QRS = rate Rule of 300- Divide 300 by the number of boxes between each QRS = rate Number of big boxes Rate 1300 2150 3100 475 560 650

33
Rate HR of 60-100 per minute is normal HR > 100 = tachycardia HR < 60 = bradycardia

34
Interpretation of ECG cont. 4. Axis (mean QRS axis): normally -30 to +100 LAD: LVH LAFB Inf. MI RAD: Normal RVH Lat. MI LPFB 5. Analysis of complete ECG complex in each lead.

35
Calculation of electrical axis depending on QRS polarity in leads I and aVF

36
WPW

37
Long QT syndrome

38
Bundle branch block

39
Left Bundle branch block (LBBB)
")
40
Right Bundle branch block (RBBB)
")
41
VT (with RBBB pattern)
")
42
VT (with LBBB pattern)
")
43
ECG changes in IHD ECG changes in IHD Signs of ischemia: Signs of ischemia: Reversible ST depression, ST elevation or T inversion. Reversible ST depression, ST elevation or T inversion. Signs of MI: Signs of MI: 1. Hyperacute T wave. 2. ST elevation (STEMI) ST depression(NSTEMI) ST depression(NSTEMI) 1. Q wave (Q or transmural infarction) 2. T inversion.
 ST depression(NSTEMI) ST depression(NSTEMI) 1. Q wave (Q or transmural infarction) 2. T inversion..")
44
Evolution of ECG changes in MI Evolution of ECG changes in MI

45
Q wave infarction

46
Localization of MI 1. anterior MI

47
Localization of MI 2. lateral MI

48
Localization of MI 3. inferior MI

49
Hyperacute MI

50
Acute anteroseptal MI (STEMI)
")
51
Acute anterolateral MI (with hyperacute T)
")
52
Acute anterolateral MI Old inferior MI

53
Acute inferior MI

54
Right ventricular infarction

55
Old ant. MI

56
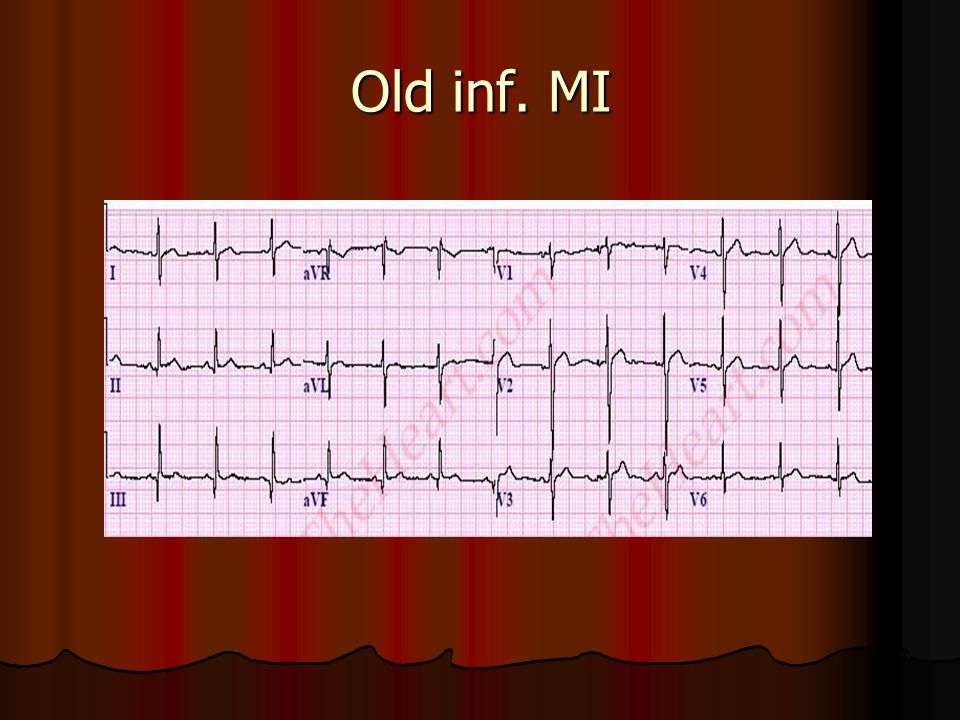
Old inf. MI

58
Criteria of ventricular enlargement LVH : 1. SV1 + (RV5 or RV6) ≥ 35 mm (or) RV5 or RV6 ≥ 25 mm 2. LV strain 3. LAE RVH : 1. Relatively tall R in V1 2. RV strain 3. RAD

59
LVH

60
LVH

61
RVH with RAE

62
RAE LAE

63
Acute pericarditis

64
SAH

65
Hyperkalemia

66
Sever hyperkalemia

67
PAC

68
PAC bigeminy

69
PVC

70
PVC

71
PVC. bigeminy

72
PVC. trigeminy PVC. trigeminy

73
VT

74
Multifocal PVC

75
PVC. Couplet

76
Sinus tachycardia

77
Paroxysmal supraventricular tachycardia [PSVT]
![Paroxysmal supraventricular tachycardia [PSVT]](http://images.slideplayer.com/24/7286416/slides/slide_77.jpg "Paroxysmal supraventricular tachycardia [PSVT]")
78
PSVT

79
Atrial fibrillation [fine]
![Atrial fibrillation [fine]](http://images.slideplayer.com/24/7286416/slides/slide_79.jpg "Atrial fibrillation [fine]")
80
Non-sustained VT

81
VT

82
Ventricular fibrillation

83
Sinus bradycardia

84
Junctional rhythm

85
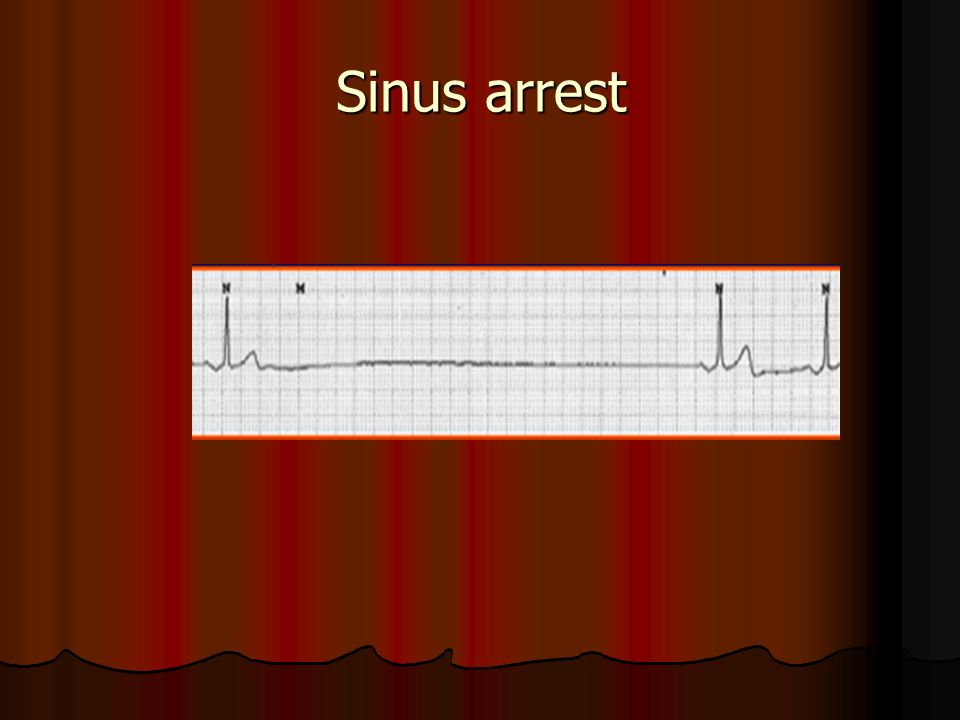
Sinus arrest

87
First degree heart block

88
Second degree heart block Mobitz type I (Wenckebach block)
")
89
Complete heart block

91
Sinus rhythm (SR), rate 60, normal ECG.
, rate 60, normal ECG.")
92
SR rate 66, benign early repolarization (BER).
.")
93
SR, rate 91, with first degree AV block.

94
Ectopic atrial rhythm, rate 82, otherwise normal ECG.

95
AV junctional rhythm, rate 50

96
Accelerated idioventricular rhythm (AIVR), rate 65
, rate 65")
97
SR, rate 100, right bundle branch block (RBBB)
")
98
SR, rate 80, first degree AV block, left bundle branch block (LBBB),old inf MI
,old inf MI")
99
SR, rate 85, RBBB, left posterior fascicular block (LPFB)
")
100
rate 50, acute anterolateral myocardial infarction rate 50, acute anterolateral myocardial infarction

101
SR with second degree AV block type 1 (Mobitz I, Wenckebach), rate 50, left ventricular hypertrophy (LVH), RBBB.
, rate 50, left ventricular hypertrophy (LVH), RBBB.")
102
Ventricular tachycardia (VT), rate 140
, rate 140")
103
SR, rate 87, Wolff-Parkinson- White syndrome (WPW)
")
104
ST, rate 155

105
This ECG was recorded from a 25-year-old pregnant woman who complained of an irregular heart beat. Auscultation revealed a soft systolic murmur but her heart was otherwise normal. ^

106
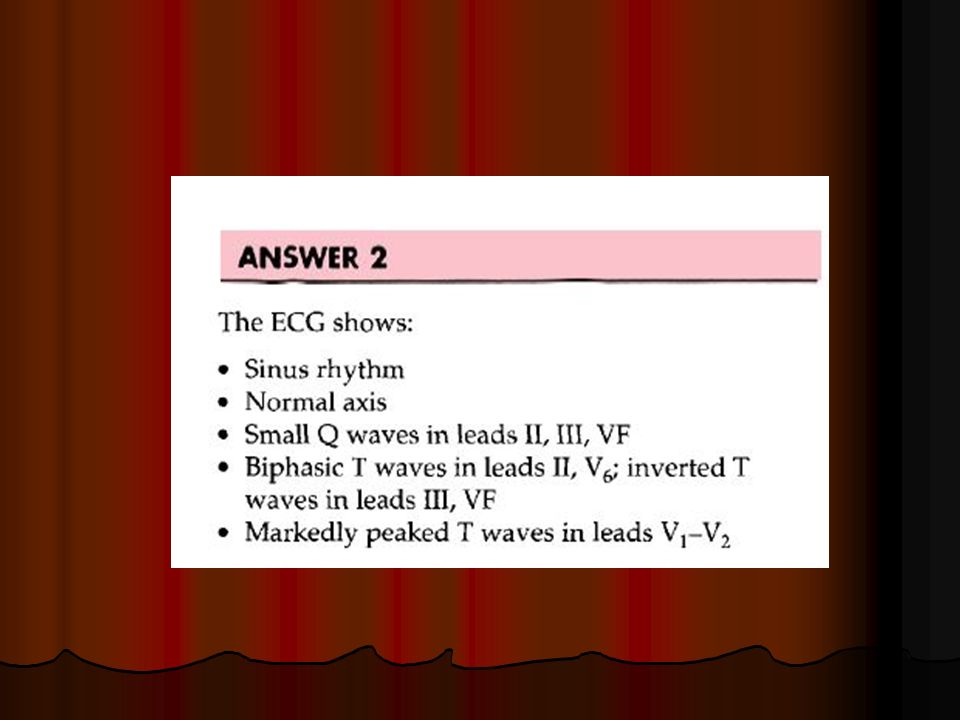
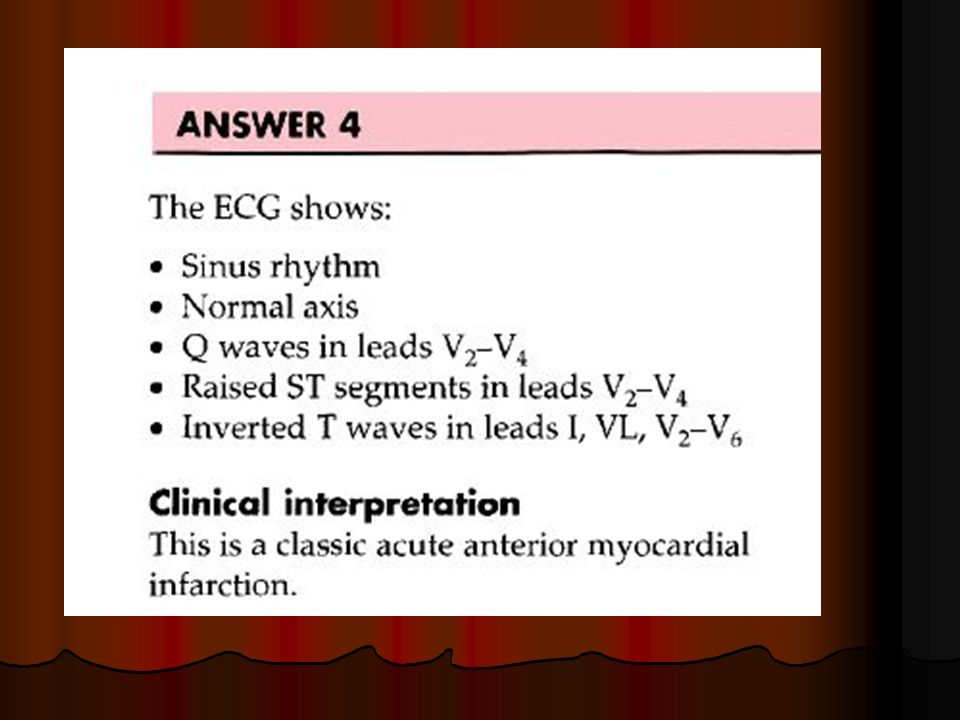
ANSWER 1 The ECG shows: Sinus rhythm Ventricular extrasystoles Normal axis Normal QRS complexes and T waves Clinical interpretation The extrasystoles are fairly frequent but the ECG is otherwise normal. Ventricular extrasystoles are very common in pregnancy, and systolic murmurs are almost universal. Her heart is almost certainly normal. What to do Remember anaemia

125
موفق باشید

Similar presentations


>")
