Download presentation
Presentation is loading. Please wait.

1
Think and Write Like a Designer to be a Better Analyzer and Creator of Design For Infographics & Graphs

2
Question #1: Does It Need to be an Infographic? Here? Yes. That’s damn creative.

3
Here? No, no, it doesn’t. There’s nothing interesting or creative going on here at all. This could be a bullet list and get the job done quicker.

8
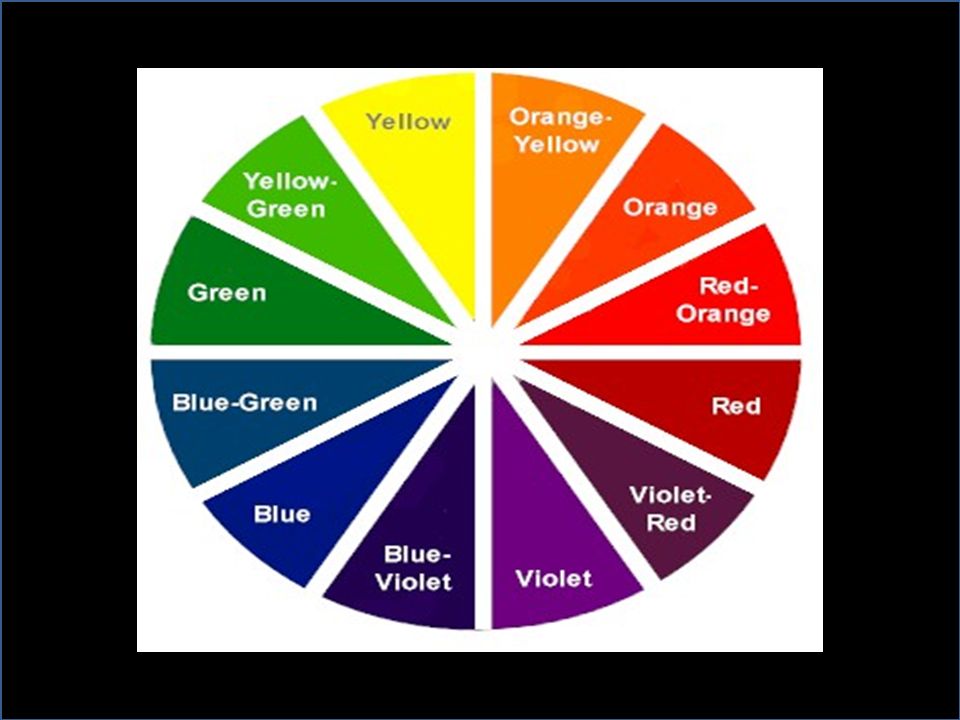
Colors next to each other on the wheel are called “analogous” and will look good together.

9
Colors opposite to each other on the wheel are called “complementary” and will provide maximum contrast.

10
Poor Contrast This would be very hard to look at for a long period of time. Good Contrast, This would technically work, but (on a personal note) still doesn’t look great. Kind of Christmas-like, but technically the contrast is there. Poor contrast. Consult your color wheel if your own eye can’t see how poor this looks!
 still doesn’t look great. Kind of Christmas-like, but technically the contrast is there. Poor contrast. Consult your color wheel if your own eye can’t see how poor this looks!.")
11
Colors Have Reason and Good Contrast

12
No Reason for Different Colors (can be distracting)
")
13
Lack of Contrast and Confusing Patterns

14
Blue Background Does Not Contrast Enough For 4 Pieces to Stand Out

15
Are You Kidding Me?

16
Stop It. (bonus points for stereotypes)
")
17
MUCH BETTER Orange and Blue provide maximum contrast Pop or red provides contrast but are also analogous with the orange Different sizes of texts and images tell the eye exactly where to look

18
In Short Good contrast is aesthetically pleasing, tells the viewer what’s most important on the screen, and makes elements stand out Poor contrast leads to ugliness, confusion of focal points, and can make things hard to read or look at

20
7-8 different colors for no reason Some title/headings all caps– some not Underline can’t decide how far it wants to extend past words Poor Repetition

21
Repetition: See, Not That Hard!

22
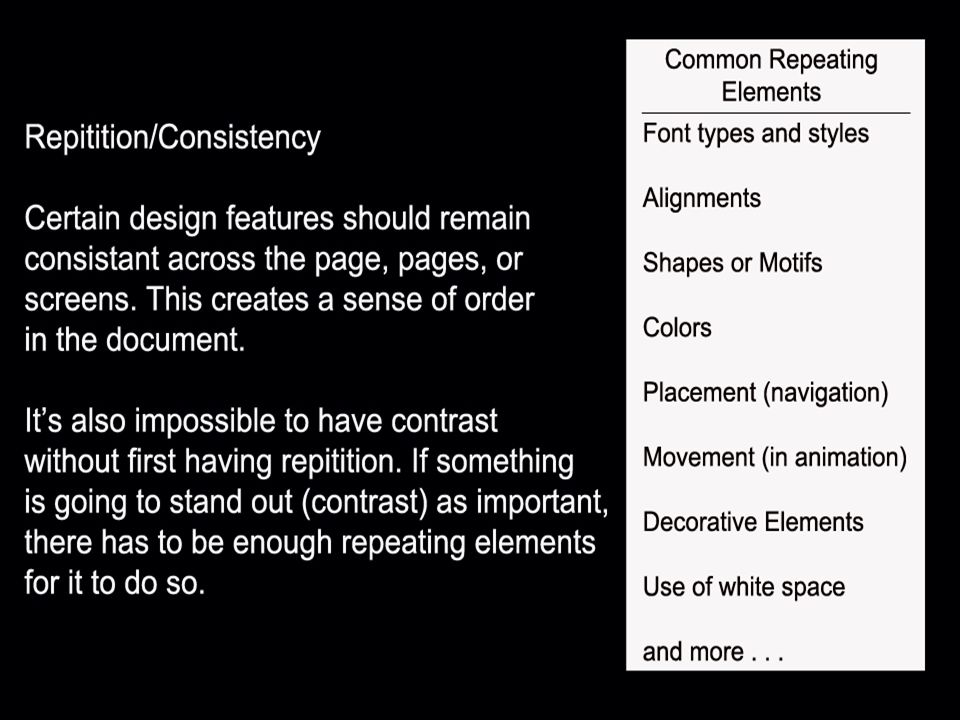
In Short Good repetition makes a site feel unified, coherent, and consistent A lack of repetition is confusing and hurts the coherence and identity of a site

24
I Don’t Have Time for This

25
The Designer Hates You

26
I Hate the Designer

27
Proximity Changes the World!

28
In Short Good use of proximity leads to strong organization and letting someone know how to navigate a site Poor proximity makes navigation difficult and leads to frustration

30
Basic Grid: But Gets the Job Done

31
I Love This So Much

32
This familiar problem of misleading height of bars is technically an alignment problem.

33
If you can find any rhyme or reason to this alignment, beyond that’s just where stuff kinda fit, please let me know.

34
Good to Have a Legend, But It’s Just Kinda Mashed In There

35
In Short Good alignment is aesthetically pleasing and organizes sections of the site into logical and usable sections that are easy to find and work with Poor alignment is ugly, confusing to the eye, looks amateurish, and causes frustration

37
Nicely Symmetrical Balance with Plenty of Good White Space Left Over

38
Still As Good as it was Slides Ago

39
But... But... Why?

Similar presentations