Download presentation
Presentation is loading. Please wait.

2
Off to the Races

10
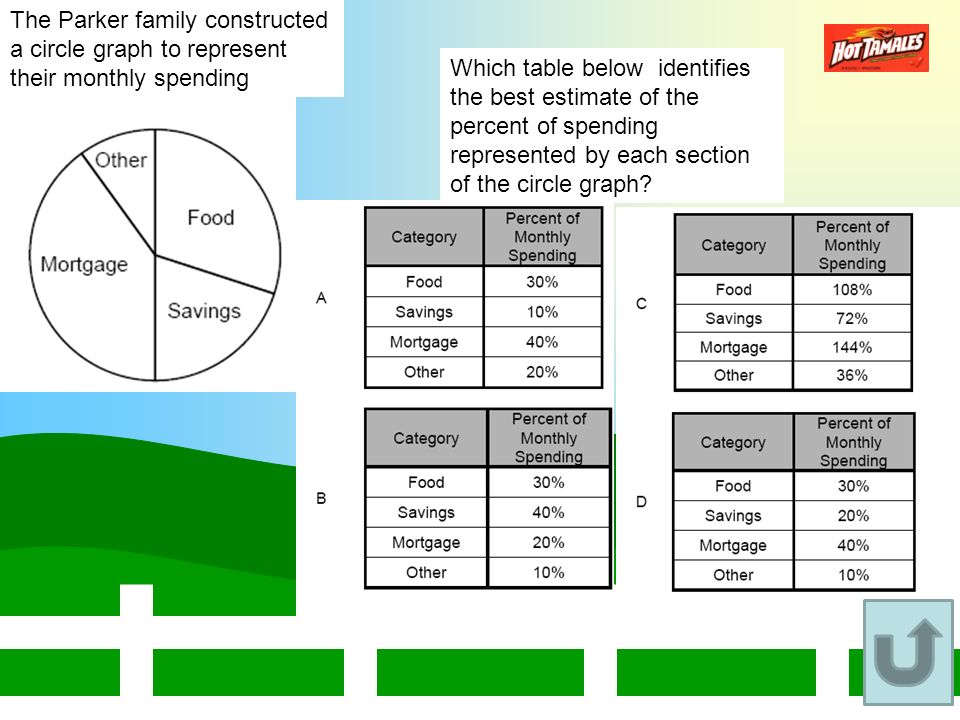
Which table below identifies the best estimate of the percent of spending represented by each section of the circle graph? The Parker family constructed a circle graph to represent their monthly spending

15
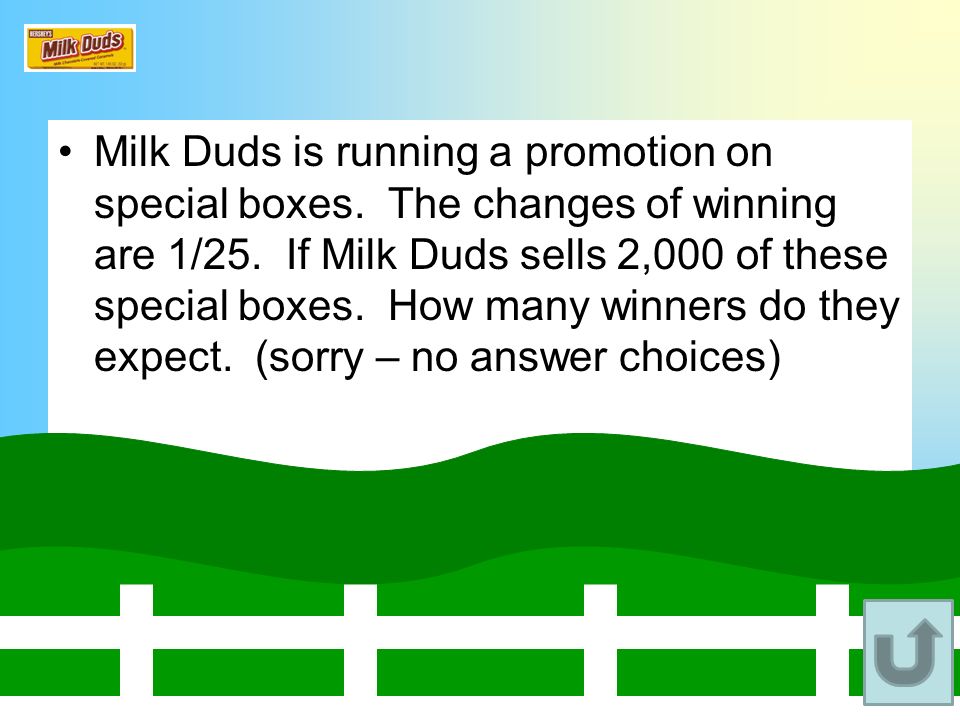
Milk Duds is running a promotion on special boxes. The changes of winning are 1/25. If Milk Duds sells 2,000 of these special boxes. How many winners do they expect. (sorry – no answer choices)
.")
16
Two dice were rolled at the same time. What is the probability that their sum will be less than 3? (sorry – no answer choices)
.")
17
Red M&M’s make up 2/7 of a bag. If a large bag of M&M’s contains 50 red pieces, how many pieces of M&M’s are in the bag? (sorry – no answer choices)
.")
18
Ellen’s small jellybean jar contains 5 red beans, 3 green beans, 4 yellow beans, and 2 pink beans. What are the chances of selecting a pink jellybean, not replacing it, then choosing a red jelly bean? (sorry – no answer choices)
.")
Similar presentations


 needs to select a batting order for tonight's ball game. If there are only nine players to choose from,>")


 Label it. When would you use a line.>")
