Download presentation
Presentation is loading. Please wait.

1
Some implications of new, high- growth development trajectories Contrasting India and China

2
Similarities between India and China High and sustained rates of growth of aggregate and per capita national income For longer in China than India, but growth accelerating in India recently Occurs in the context of integration through trade, investment and financial liberalization Increased presence in the global economy

3
China and Indias contribution to global growth 20002001200220032004 Global growth (% p.a.) 6.94.84.65.77.4 Percentage share of annual growth rates China15.82325.223.419.9 India67.38.297
 Percentage share of annual growth rates China India")
4
India and China Relative to the World (%)
")
5
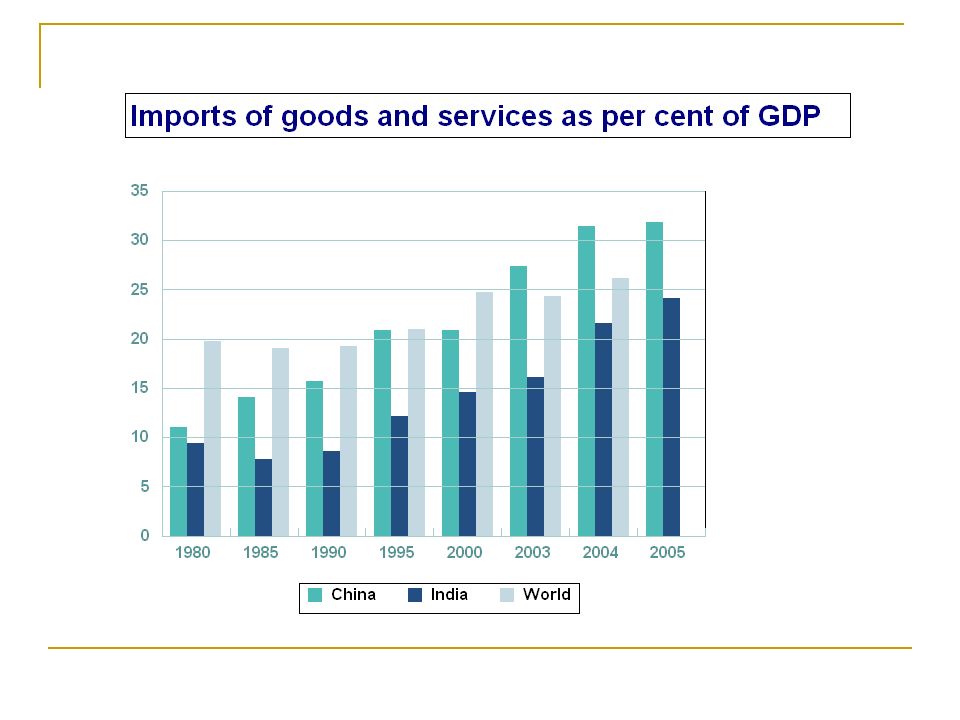
Importance of exports

6
Difference in the Structure of Exports

7
Related to differences in structure of growth Of the cumulative increase in GDP between 1991 and 2005, while 53 per cent was accounted for by industry in the case of China (with 40 per cent from services), as much as 62 per cent was accounted for by services in the Indian case (with 27 per cent from manufacturing). Manufacturing growth strong in China accounting for 37 per cent of the increment in GDP in this period, whereas the comparable figure for India was just 16 per cent.

8
Implications of patterns of growth Fall-out of growth led by manufacturing in China in terms of demand for non-manufacturing sectors, viz. agriculture, mining and services likely to be significant, if not strong This is likely to impact on demand and growth within and outside China This would not be as true of Indias services-led growth, which is likely to impact only on the demand for manufactures and other services

9
Trends in the sources of imports (%age distribution)
")
10
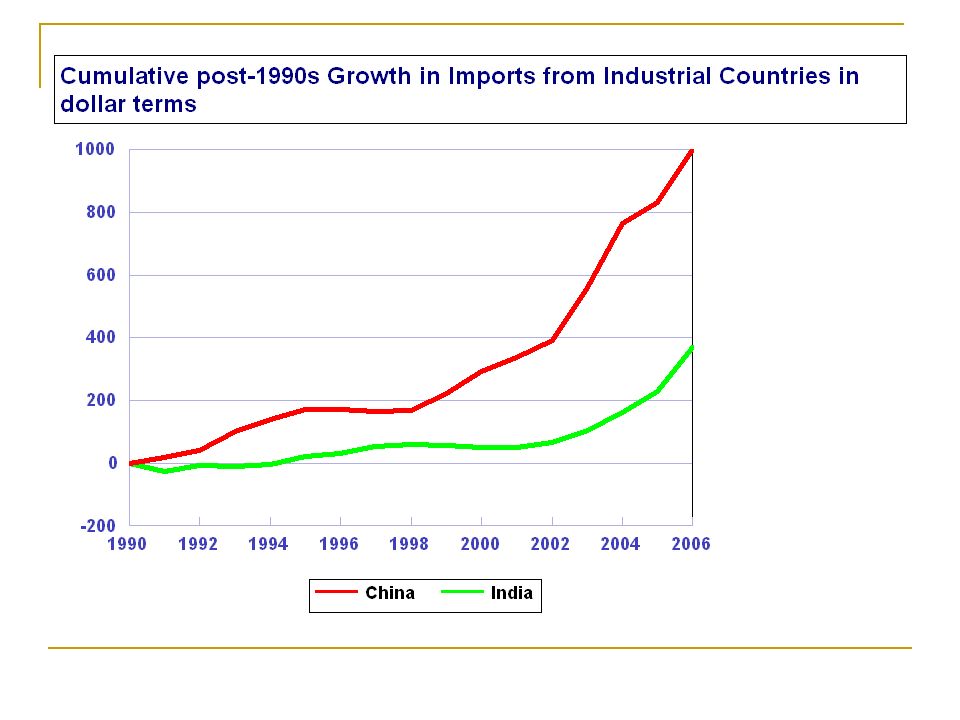
The evidence A sharp shift away from imports from developed to developing countries starting in the mid-1980s in the case of China This is true in the case of India too, though the shift is less pronounce partly because of a lower dependence on developed countries in 1980.

13
Chinas Developing Country Imports (as % of world imports)
")
14
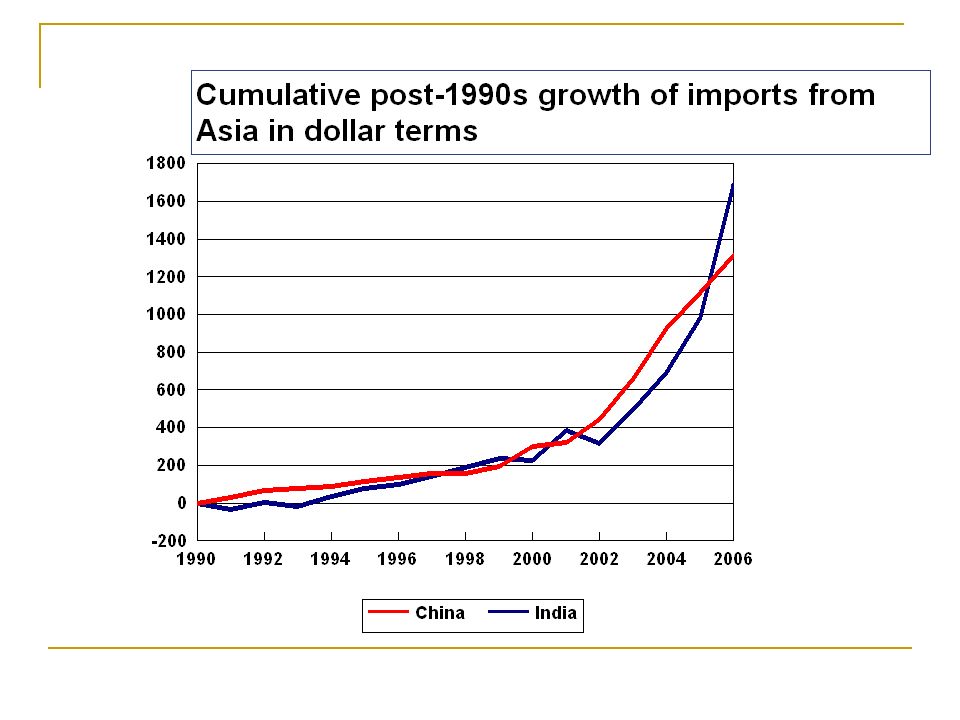
In the second half of the 1980s, the sharp shift in the sources of Chinese imports was in favour of developing Asia Subsequently, the increases have been distributed to other part of the developing world

15
Indias Developing Country Imports (as % of world imports)
")
16
In Indias case the pattern is more complicated, partly because of the incompleteness of the data. Oil played an extremely important role in shaping the sources of imports. Asias role as a source of imports has been increasing rapidly, servicing Indias manufactured import requirements. Areas other than Asia, especially Africa, seem to be dropping out, but there is a data problem here.

17
Cumulative post-1990 growth of imports from Africa in dollar terms

19
Cumulative post-1990s Growth of Imports from Latin America

21
Possible explanations Post liberalization patterns of growth may be reducing the elasticity of demand for staples with respect to GDP growth. Growth based on manufacturing in China needs more access to raw materials, whereas growth based on services in India may generate more demand for oil and final manufactures.

22
An illustration from India Accelerating non-agricultural growth in India has been accompanied by an agrarian crisis, involving, inter alia, slow agricultural growth. In the 1990s, per capita agricultural output grew at only 0.4 per cent per year and agricultural income grew at only 0.7 per cent per year. Suggests that agriculture is no more a constraint on non-agricultural growth.

23
Changes in the neo-liberal 1990s Change in the pattern of demand and production, involving a reduction in the direct agricultural-input dependence of the non agricultural sector. Sastry et. al. : In 1968-69 one unit of rise in industrial output was likely to enhance demand from agriculture by 0.247 units, which was reduced to 0.087 by 1993-94. On the other hand, in 1968-69, one unit rise in industry was to cause 0.237 units demand from the services sector, which increased to 0.457 units in 1993-94.

24
Role of services growth Reduction in agricultural input dependence of the non-agricultural sector would be greater once we take account of the growing share of services in non-agricultural GDP. While services accounted for 43 and 48 per cent respectively of the increment of GDP at current prices in the 1970s and 1980s, the figure rose to 58 per cent and 62 per cent respectively during the 1990s and the years 2000-01 to 2004-05.

25
Employment vs output growth

26
Possible difference with China Dependence on modern manufacturing may be limiting the elasticity of employment with respect to output growth in China as well, with attendant implications for staples. But demand for primary raw materials including agricultural raw material and metals would be increasing.

27
Chinas consumption of Industrial Materials and Oil

28
Impact on commodity prices One major impact of the China boom has been a degree of buoyancy in commodity prices. While other factors have played a role, but for Chinas presence, commodity prices may not have reflected the buoyancy they have. Over the last five years there are signs of a reversal (however temporary) of the long term trend in global commodity prices. By the beginning of this decade commodity prices had fallen relative to consumer prices (as measured by the US Consumer Price Index) for over five decades. But from around 2002, commodity prices have been on the rise. While exporters of oil have been important beneficiaries, the index of non-fuel commodity prices has also been rising.
 of the long term trend in global commodity prices. By the beginning of this decade commodity prices had fallen relative to consumer prices (as measured by the US Consumer Price Index) for over five decades. But from around 2002, commodity prices have been on the rise. While exporters of oil have been important beneficiaries, the index of non-fuel commodity prices has also been rising..")
31
Obvious importance of non-fuel commodities Non-fuel commodities have a higher share in world trade (about 14 percent during 2000–04) than fuel commodities (7 percent). Many developing countries are highly dependent on non-fuel commodities as a source of export earnings36 countries have a ratio of non-fuel commodity exports to GDP of over 10 percent, and in 92 countries the ratio is over 5 percent. Indeed, in many low-income countries (including in Africa), a large share of export receipts is generated by just a few commodities.
, a large share of export receipts is generated by just a few commodities..")
32
Role of manufacturing based growth These trends are a result of the fact that Chinas high rate of GDP growth has been (unlike in the case of India) driven by increases in industrial production. The rate of growth of industrial production in China rose from a high 10.5 per cent during 1993-2000 to 16.2 per cent during 2002-05. This industrial dynamism has meant that China today accounts for 8 per cent of global industrial value added when estimated at current exchange rates and 25 per cent when valued in PPP terms. It has also meant that China is today he largest consumer of several metals, accounting for about a quarter of the total world demand for aluminum, copper and steel

33
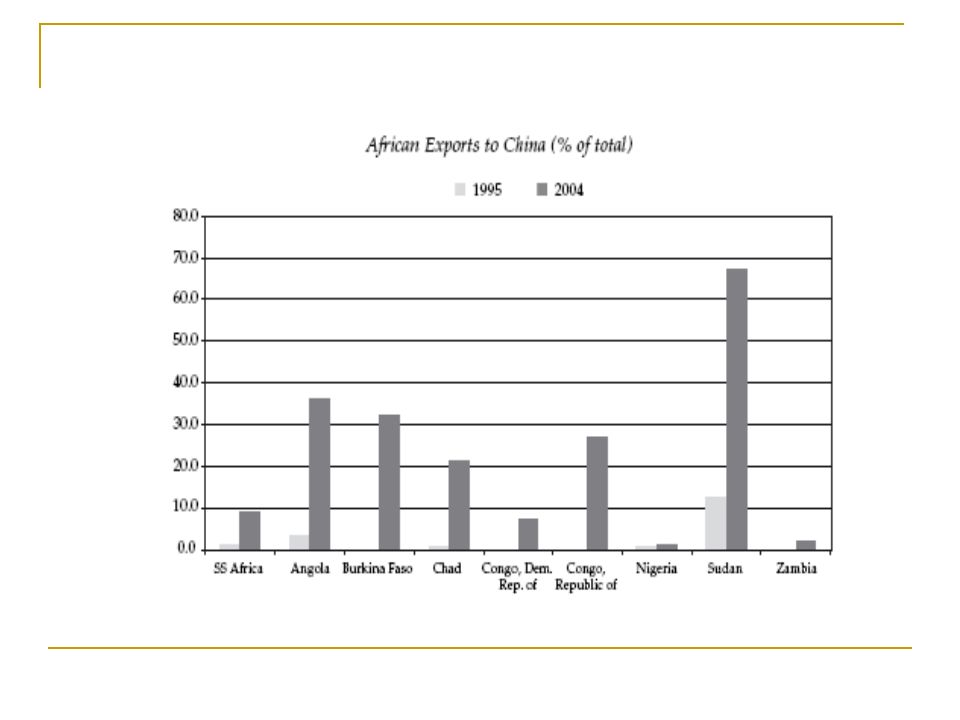
Africa a major beneficiary The major beneficiary of these trends in commodity demand and prices is Africa, in which Chinas presence has expanded substantially. African exports to China started accelerating around 2000, and have since risen at an annual growth rate of more than 50 per cent. By 2004, African exports to China touched $11.4 billion, reflecting a more-than- threefold increase since 2000. By 2004 China accounted for 6 per cent of total African exports to the world.

34
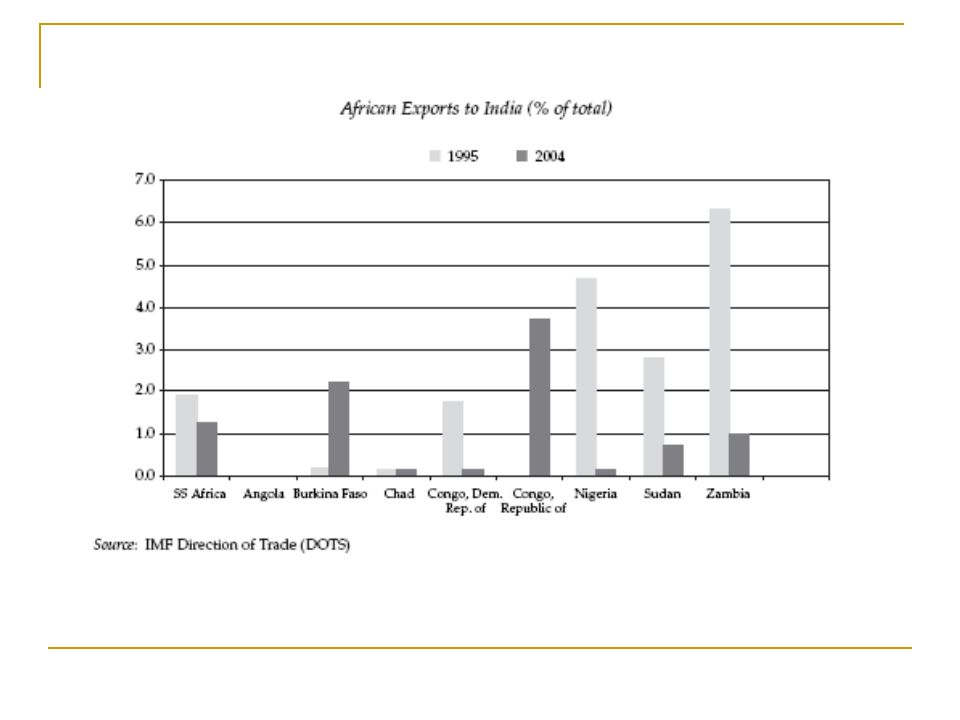
Africas trade with India and China

35
Africas exports to India and China

36
Implications for Terms of Trade One consequence of the rise in the volume and unit value of commodity exports from Africa, are signs of the reversal (for the present) of the long-term deterioration of net barter terms of trade faced by developing countries dependent on primary products for their export revenues that go to finance imports of manufactured products. With competition in manufactures export trade (influenced by China) moderating price increases in manufactured goods, and Chinas demand driving up commodity prices, developing countries as a group and Africa in particular that are still substantially dependent on the exports of primary products, have experienced an improvement in their terms of trade.
 moderating price increases in manufactured goods, and Chinas demand driving up commodity prices, developing countries as a group and Africa in particular that are still substantially dependent on the exports of primary products, have experienced an improvement in their terms of trade..")
37
ToT and Purchasing Power of Exports (2000=100)
")
44
Net Impact on Africa The net result of all this is that the China boom has helped a continent like Africa. Real GDP growth in Africa rose from an average annual rate of 4.2 per cent during 2001-2004 from 3.3 per cent during 1997- 2000. Sub-Saharan Africa gained even more with its real GDP growth rate touching 5.4 per cent in 2004, which was an eight- year high. The African Economic Outlook 2005 (AfDB/OECD 2005), among others, attributes this improvement substantially to the rise in commodity prices. Further Chinas interest in the regions natural resources has resulted in huge flows of aid and foreign investment from China to Africa, bolstering the regions infrastructure and putting much needed investment into the natural resources sector.
, among others, attributes this improvement substantially to the rise in commodity prices. Further Chinas interest in the regions natural resources has resulted in huge flows of aid and foreign investment from China to Africa, bolstering the regions infrastructure and putting much needed investment into the natural resources sector..")
45
Is this a challenge to the old Imperialism It is inasmuch as it gives other developing countries a space to negotiate the process of development But does it imply a loosening of developed country dependence for India and China That view often buttressed by the idea that India and China are exploiting the benefits of the new knowledge economy.

46
What is the new economy? Improvement in the quality of human and other forms of intangible capital rendered possible by the knowledge revolution a crucial determinant of productivity differentials across sectors and nations. Transmission of these intangibles from the pure knowledge domain to commodities must be mediated by labour of different kinds which must acquire the necessary intangibles Requires investment geared to the production and dissemination of knowledge (i.e., in training, education, R&D, information and coordination).
..")
47
Role of Knowledge 1

48
Role of Knowledge 2

49
Trends in services production

50
India an exporter of knowledge-intensive services IT and ITeS Exports from India: IT services exports estimated at around $23 billion in 2005-06 by RBI During the period 1990-91 to 2004-05, exports have been growing at 47.5 per cent per annum or doubling every 21 months.

51
IT-based Growth in India In absolute and relative terms the size of the IT sector in India is now impressive. NASSCOM estimates the size of the industry in 2005-06 at $36.3 billion, of which $29.5 billion consisted of revenues from software and services. $23. 4 billion of these were export revenues: comprising of $17.1 billion of software and services export revenues and $6.3 billion of revenues from exports of IT-enabled services and business process outsourcing (BPO). The ratio of gross IT sector output to GDP rose from 0.38% in 1991-92 to 1.88% in 1999-00 and 4.5 % 2004-05
. The ratio of gross IT sector output to GDP rose from 0.38% in to 1.88% in and 4.5 %")
52
Dissociation of knowledge and production Knowledge in production separate from knowledge for production. Knowledge in services separate from knowledge for services.

53
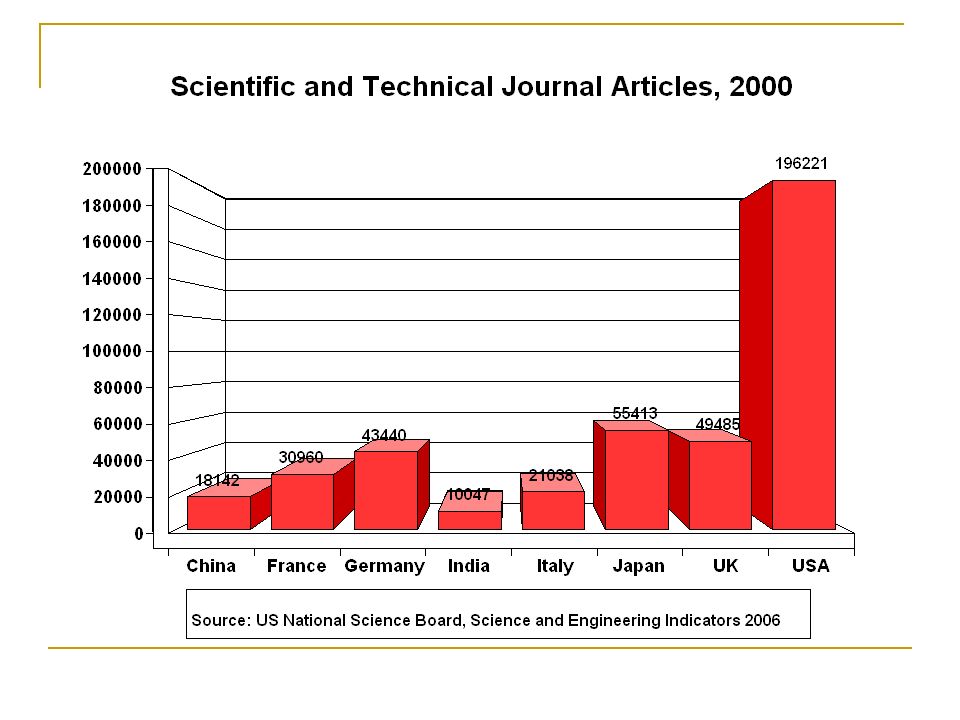
K4P: Domestic R&D

56
Retaining K4P: Absorbing talent

57
Retaining K4P : Retaining talent

58
Retaining K4P : Global R&D Transnational corporations (TNCs) account for at least 70% of global business R&D. In 2002, the top 700 R&D spenders reported R&D expenditures of more than $300 billion (WIR 2005). Ford, Pfizer, DaimlerChrysler, Siemens, Toyota and General Motors each spent more than $5 billion on R&D in 2003. In comparison, among the developing economies, total R&D spending exceeded $5 billion only in Brazil, China, the Republic of Korea and Taiwan Province of China.
. Ford, Pfizer, DaimlerChrysler, Siemens, Toyota and General Motors each spent more than $5 billion on R&D in In comparison, among the developing economies, total R&D spending exceeded $5 billion only in Brazil, China, the Republic of Korea and Taiwan Province of China..")
59
Retaining K4P : Internationalizing R&D A rising share of these companies' R&D expenditures are undertaken in developing countries. Between 1994 and 2002, the developing-country share of all overseas R&D by US TNCs increased from 7.5% to 13%. Today, more than half of the world's top R&D spenders conduct R&D activities in China, India or Singapore.

60
Role for foreign firms in India and China Chinas trade surplus with the US rose to $114.2 billion in 2005, up from $80.2 billion in 2004. Exports to the US rose by over 30 per cent to $162.9 billion and imports totaled $48.7 billion. But dominant share of exports from foreign invested firms. More than 60 per cent of Indias IT services exports are to the US. But more than 50 per cent of ITeS exports from captive units.

61
Increase in US Presence in Asia In Asia and Pacific, value added of foreign affiliates in 1999–2004 grew at an average annual rate of 9 percent, and the regions share increased 1.2 percentage points, to 19.0 percent. The largest increases in shares were in China, India, and Japan.

64
The China Boom In China, value added of affiliates in manufacturing accounted for more than two-thirds of the value added of all Chinese affiliates in 2004, and during 1999–2004, value added of Chinese affiliates in manufacturing grew at an average annual rate of 23 percent. In 2004, more than two-thirds of the sales by Chinese affiliates in manufacturing were to customers in China, and only 7.4 percent of these sales were to U.S. customers, down from 16.3 percent in 1999.

65
India and Japan In India, the growth in value added was widespread by industry, but it was most notable in manufacturing and wholesale trade, in which affiliates sell almost exclusively to local customers, and in computer systems design and related services (part of professional, scientific, and technical services), in which affiliates sell mainly to customers in the United States. In Japan, most of the growth in value added was in manufacturing, mainly reflecting acquisition of firms or establishment of new foreign affiliates to serve the local market.

66
Impact on trade 1

67
The distributed value chain 20002004 Chinas exports of EDP and office equipment 5.0220.73 Chinas imports of integrated circuits and electronic components 6.8022.40

68
Semiconductor market shares

69
Exporting knowledge The United States continues to be a net exporter of manufacturing technological know-how sold as intellectual property: On average, royalties and fees received from foreign firms were three times greater than those paid out to foreigners by U.S. firms for access to their technology. In 2003, U.S. receipts from the licensing of technological know-how to foreigners totaled $4.9 billion, 24.4% higher than in 1999. The most recent data show a trade surplus of $2.6 billion in 2003, 28% higher than the prior year but lower than the $3.0 billion surplus recorded in 2000.

70
Implications Emergence of a new global division of labour. Interpreting the Chinese and Indian miracles: Instruments of battle rather than warriors. Miracles always exist, but they are never the same. There are, however, some signs of change in China.

71
K4P: Are things changing?

72
R&D in China Since 1995, China has not only more than doubled its R&D spending as a percentage of GDP from 0.6 to 1.3% of GDP, but the number of researchers was also increased by 77% between 1995 and 2004 China will spend some 102 billion on R&D in 2006, a little more than Japan's forecast of 97 billion. The United States is expected to remain the world's top R&D investor in 2006 with some 248 billion, whereas the EU-15, is expected to invest around 173 billion. The EU-25 R&D expenditure in 2004 amounted to 1.9% of GDP, some 195 billion.

Similar presentations