Download presentation
Presentation is loading. Please wait.

1
Oversight of a Patient-Centered Infrastructure To Continuously Improve Patient Retention and Viral Load Suppression Rates Moderator: Mindy Golatt, RN, MPH, Project Officer Presenters: Paul Cassidy, M.S.W., Program Director Greater New Bedford CHC, MA Sonji Miller, M.S., Manager of HIV and Substance Abuse Lawndale Christian Health Center, Chicago Ron Chacko, M.D., HIV Service Line Leader Lawndale Christian Health Center, Chicago Facilitator: Nanette Brey Magnani, Ed.D, QM Consultant NQC/HIVQUAL

2
Session Outcomes By the end of the workshop, participants will be able to: Identify key elements of patient-centered infrastructures and supportive processes for continuous quality improvement Share and discuss decision support tools that, when used, enhance a multidisciplinary team’s ability to design and implement interventions specific to sub-populations Reflect on their own program infrastructures to identify ways to make them more patient-centered.

3
Agenda Thursday, November 29, 2012 – 8:00am – 9:30am
8:00 Welcome. Review Outcomes and Agenda. Overview Purpose Why Continuous Quality Improvement? 8:20 Grantee Examples: Presentation Greater New Bedford CHC Lawndale Christian HC 8:50 Small Group Discussion: What do you do? What can you do? 9:10 Large Group Exchange. 9:30 Adjourn.

4
Overview “Barbara, We have to continue to work until the good gets better, the better gets best. Never let it rest!” Dr. Barbara Allen, CDC Country Director, Guyana, sharing a quote from a colleague working in the Santa Rita jail to improve care there.

5
Purpose Our Purpose Ryan White Programs are better, how can we improve better to be the best?

6
Fundamental Concept of Improvement
“Every system is perfectly designed to achieve exactly the results it achieves.” Was this the slide you were looking for? Couldn’t find any graphics on Rassoud presentation that were related to systems? 6 HCI FY08 Self-Evaluation Oral 6

7
Massachusetts RW Programs Participating in In+Care Retention and VL Suppression Results

8
Can RW Programs with “Better” Rates Improve Even More?
Are they better? Are they the best? How do we define best? How much can they improve? What do you think is involved?

9
4 Guiding Principles of Improvement
Understanding work in terms of processes and systems Developing solutions by teams of providers and patients Focusing on patient needs Testing and measuring effects of changes

10
Early QM Efforts Designed to build RW grantees’ capacity to
Create and develop a QM/QI infrastructure Create measurement systems Performance measures – 7 to >20 Data collection and reporting – chart to EHRs and CAREWare Develop staff Improve patient care Consumer Involvement

11
Current Quality Management System Components
QM infrastructure provides the foundation to support overall QM Program and QI Processes Organizational Quality Management Committee HIV QM Committee and QM Plan Performance Measurement System QI Project Teams Consumer Advisory Groups

12
With this system who are we are missing?
Large Group Brainstorm

13
How Can We Serve These Patients? Can “Better Become Best?”
Greater New Bedford CHC Patient Centered Process Targeted care planning Lawndale Christian Health Center Specific example of improved care for patients with behavioral health concerns related to adherence to appointments and medications

14
Greater New Bedford Community Health Center, MA

15
Retention and VL Suppression Results and Improvement Goal
Retention: 96% (top 10%) VL Suppression: 73% (below top 25% and MA average) Improvement Goal: To increase patients’ VL suppression rate from 73% to 85% in six months.
 VL Suppression: 73% (below top 25% and MA average) Improvement Goal: To increase patients’ VL suppression rate from 73% to 85% in six months.")
16
Baseline Data Number of Patients = 320 Suppressed (Blue)= 236
Not Suppressed (Red)=84 Suppression Rate=73%
=84. Suppression Rate=73%")
17
PDSA: Infrastructure Change
Phase 1: Plan/Do Beginning May 9, 2012 Multidisciplinary team will meet 3 times per month to review needs/barriers for patients with viral load >200 copies. Care plans will include recommended interventions tailored to each patient’s needs and specific staff will be assigned to individual patients based on staff relationships and nature of the intervention. Care plans are developed and implemented by: Social Workers Peers RNs PDSA: Infrastructure Change

18
GNBCHC WEEKLY MULTI DISCIPLINARY MTGS.
Prepare updated data reports for meeting: Monitoring performance measurement data; effectiveness of interventions; updated list of patients not meeting measure RE- START WEEKLY MTGS-3/MONTH REVIEW PATIENTS TAKE NOTES DEVELOP CARE PLAN TEMPLATE DEVELOP PATIENT SPECIFIC CARE PLANS TEAM MAKES RECOMMENDATIONS ASSIGNED STAFF PRESENT PLAN TO PATIENT FOR PATIENT INPUT FOLLOW –UP ON RECCOMENDATIONS INTERVENTION IS INDIVIDUALIZED SOCIAL WORK INTERVENTION FOLLOW-UP ON PLAN Adherence RN INTERVENTION DEVELOP AND IMPLEMENT CARE PLAN Expand min sessions PEER NAVIGATOR INTERVENTION FOLLOW –UP ON PLAN *** BARRIERS TO VIRAL LOAD SUPRESSION SUBSTANCE ABUSE HOMELESSNESS NOT ATTENDING APPOINTMENTS MENTAL HEALTH ISSUES REFUSE MEDICATIONS SCHEDULED TEAM MEETINGS-REVIEW RESULTS OF INTERVENTIONS # OF PATIENTS WITH VL >200 REVIEWED # WITH TARGETED CARE PLANS PATIENT RESPONSE TO INTERVENTION DATA ENTRY

19
Measurement of Interventions: Results
Individualized care plans implemented by: Adherence Nurse Social Worker Peer Navigator

20
To show and share the love of Jesus.
Lawndale Christian Health Center, Chicago To show and share the love of Jesus.

21
LCHC Patient Demographics
Total Patients =165

22
Viral Load Suppression Baseline Data (In+ Care Campaign Measure -January 1, 2012-September 30, 2012 – Patients who receive Primary Care and Case Management Services)
")
23
Weekly Case Conferences – started July, 2008
LCHC John Ryan’s Multidisciplinary Clinic Integrated Clinical & Non-Clinical Patient-Centered Care Rationale Weekly Case Conferences – started July, 2008 Review patients with appointments during the week. Care Plan developed with notes to assist Provider Monthly Clinical Case Conferences – started 2010 Discuss medical treatment progress for patients seen Discuss barriers to medical treatment adherence Follow-up on select cases from previous weeks

24
LCHC John Ryan’s Multidisciplinary Clinic Meetings

25
JR Multidisciplinary Clinic: Behavioral Health Model with Sub-Population
Rationale: Medical treatment adherence (ART and medical visits) is commonly impeded by: (a) current/past psychiatric disorders: substance-related disorders; personality disorders and neurocognitive deficits (b) stressors related to daily living (e.g. housing, benefits) 2. Current Behavioral Health Model consultations and interventions during patient’s medical visits do not address specific persistent adherence barriers that requires more intensive interventions.
 is commonly impeded by: (a) current/past psychiatric disorders: substance-related disorders; personality disorders and neurocognitive deficits. (b) stressors related to daily living (e.g. housing, benefits) 2. Current Behavioral Health Model consultations and interventions during patient’s medical visits do not address specific persistent adherence barriers that requires more intensive interventions.")
26
PDSA: Behavioral Health Pilot Intervention
Phase 1: Short-term joint psychotherapy and supportive case management to patients with mood disorders and poor adherence to medical appointments and/or ART.

27
Process Outcome: Behavioral Health Pilot Intervention
Phase 1: (Completed) Between April 2012 to September 2012, 11 patients were referred for the Behavioral Health Pilot Intervention. 64% were in active treatment (defined by 2 or more sessions completed w/Psychologist) Phase 2: (Future) % of missed medical visits % of adherence to ART % of completed assessments -Psychiatric symptom checklist: Client Diagnostic Questionnaire(CDQ) -HIV treatment adherence measure: Chesney-scale -Health related quality of life: MOS-scale -Daily stress index scale
 Between April 2012 to September 2012, 11 patients were referred for the Behavioral Health Pilot Intervention. 64% were in active treatment. (defined by 2 or more sessions completed w/Psychologist) Phase 2: (Future) % of missed medical visits. % of adherence to ART. % of completed assessments. -Psychiatric symptom checklist: Client Diagnostic Questionnaire(CDQ) -HIV treatment adherence measure: Chesney-scale. -Health related quality of life: MOS-scale. -Daily stress index scale.")
28
Key Elements of Patient-Centered and CQI Processes
As a large group, identify key elements that need to be in place in order to manage continuous improvement for sub populations: 1. 2. 3. ….

29
Small Group Discussion
Instructions: In your small groups, share experiences with your own Quality Management Programs and identify what changes need to occur in order to improve care for sub populations and individual patients not retained and not suppressed. Then, report out to the larger group.

30
Testing the “Best”….Stay Tune!
We propose….the “Best” is an improvement process that: more frequently reports data to monitor retention and VL suppression for sub populations “drills down” the data to identify patients falling out of care, their reasons, and VL data engages multidisciplinary team members in meaningful dialogue about individual patient approaches that are incorporated into care plans closes the loop by reporting on the effectiveness of interventions back to the team for further discussion and follow up.

31
Keep in touch with your ideas.
In closing, Keep in touch with your ideas. Thank you.

32
Contact Information Paul Cassidy, M.S.W., Program Director Greater New Bedford Community Health Center New Bedford, MA Ron Chacko, M.D., HIV Service Line Leader Lawndale Christian Center, Chicago, IL Sonji Miller, M.S., Manager of HIV and Substance Abuse Lawndale Christian Health Center, Chicago, IL

33
Contact Information Mindy Golatt, RN, MPH, Public Health Analyst, HRSA/HAB, Project Officer/Chicago, Nanette Brey Magnani, EdD, Quality Management Consultant, NQC/HIVQUAL, Let’s take a look at the steps to create a flowchart: Agree at the beginning what the flowchart should accomplish and the level of detail you will need to accomplish that goal. Then, identify the first and last step of the process. This sounds easier than it is. It can be hard to clarify exactly where the process begins and ends, but it is critical that you set these boundaries at the beginning. Then begin filling in the steps, from first to last. If you come to a decision point, a diamond, choose the most-often occurring path and continue it all the way to the end; then go back and complete the second branch. You’ll get terribly confused if you don’t. When you’re done, review the chart: read it out loud to the group for accuracy and make sure everyone understands it. If you uncover parts of the process that aren’t clear, don’t guess. Assign someone on the team to find out “what really happens,” gather additional input and report back. Flowcharts

34
Addendum

35
GNBCHC Workflow Process for Established Patients – RN Adherence Intervention
PATIENT REGISTERS MA TAKES VITALS Determine next steps with patient ** Provider Reviews Med’n Regimen PHYSICIAN EXAMINES PATIENT, REVIEWS RESULTS AND REGIMEN >200 <200 Multi-Disciplinary Team Review RN – 15 min to 30 min Review barriers to adherence, customize approach - pre-pack meds, deliver to house, review meds and fill pill box Give lab orders, patient to Lab Order Blood work for next three month review Lab Blood Draw Schedule next visit Lab Results sent to Physician Concern with Results Lab Results Sent to RN Lab Results Sent to Data Entry. Blood work electronically entered into EHR Call patient and make earlier visit than previously scheduled Y N No further Follow-up

37
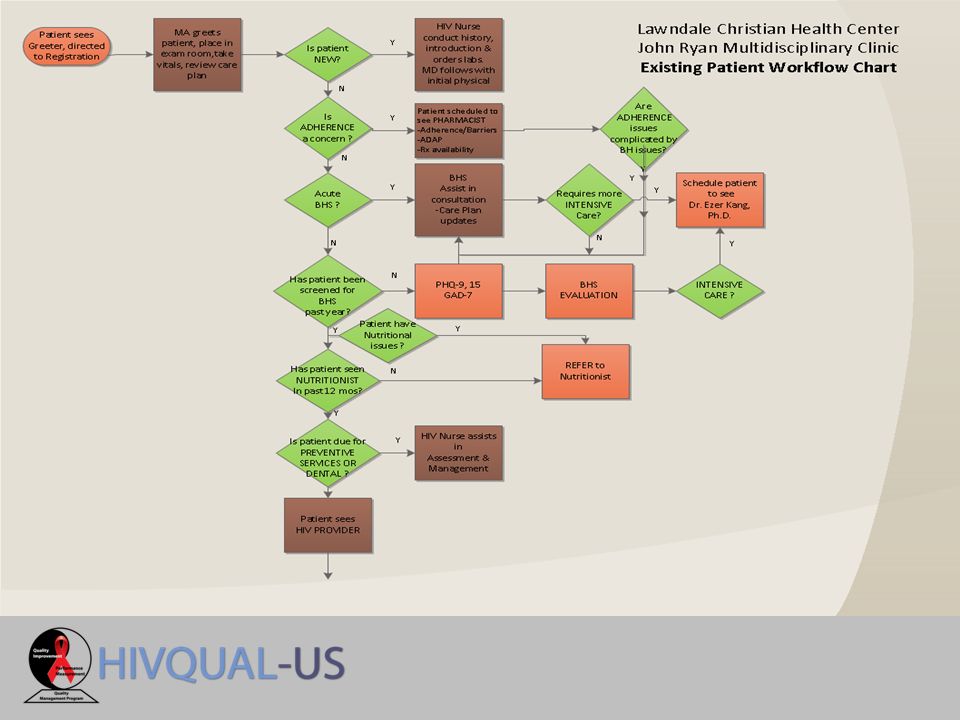
LCHC John Ryan’s Clinic Integrated Clinical & Non-Clinical Patient-Centered Care Workflow Process -CONTINUED

Similar presentations


 258-4184 National Quality Center.>")


 Asthma Pilot Project Team Progress Presentation Oregon Oregon Hillsboro Pediatric Clinic, LLC Hillsboro Pediatric Clinic,>")
