Download presentation
Presentation is loading. Please wait.

1
With the financial support of MAFAP project overview

2
Outline Highlights of the MAFAP project –Operational aspects –The three components of the MAFAP methodology: price incentives and disincentives, public expenditure and policy coherence Today’s panel discussion

3
MAFAP rationale - increased attention to food security in recent years due to price increases and volatility - to achieve agricultural development and food security, there is a need for better information and analysis to know how policies are affecting farmers – does an enabling environment exist? - the availability of and capacity to provide quantitative evidence is limited in developing countries

4
FAO’s response: MAFAP - a system to measure, monitor and evaluate the effect of policies on agricultural producers in Africa - implemented by FAO through structural collaboration with national teams to develop institutional capacity and ensure sustainability - provides evidence to support more effective policy making, investment decisions and dialogue at national, regional and pan-African levels

5
Building on OECD experience OECD measures countries’ support to agricultural sector through Producer Support Estimates (PSE) Important input for dialogue on agricultural policy in OECD member countries FAO partnered with OECD to develop the MAFAP methodology
 Important input for dialogue on agricultural policy in OECD member countries FAO partnered with OECD to develop the MAFAP methodology")
6
The MAFAP Monitoring System - Looks at price incentives and disincentives in countries’ key agricultural value chains - Analyzes public expenditure in support of agriculture and rural development - Assesses policy coherence: public expenditure vs. price support policy effects vs. policy objectives

7
What is MAFAP doing? - building the technical capacities of about 20 government and research partners in ten African countries (possibly 60 partners in the next phase) - identifying key areas for policy reform and developing concrete recommendations for policymakers - identifying where inefficiencies in commodity value chains can be reduced or eliminated through targeted investment - monitoring progress towards CAADP and national policy objectives
 - identifying key areas for policy reform and developing concrete recommendations for policymakers - identifying where inefficiencies in commodity value chains can be reduced or eliminated through targeted investment - monitoring progress towards CAADP and national policy objectives.")
8
Where we work http://www.fao.org/mafap Burkina Faso Kenya Mali Tanzania Uganda Ghana Ethiopia Malawi Mozambique Nigeria

9
How are price incentives/disincentives measured? By comparing the domestic farm gate price to a reference price (the world market price, adjusted for marketing costs to the farm gate, quantity and quality differences) The difference between the domestic price and the reference price is an indicator of price incentives or disincentives for producers – Price Gap
 The difference between the domestic price and the reference price is an indicator of price incentives or disincentives for producers – Price Gap.")
10
To illustrate… Price incentives Price disincentives Reference Price The vertical distance between the domestic price and reference price is the price gap Negative price gap Price (LCU/tonne) Positive price gap
 Positive price gap")
11
Indicators of Incentives/Disincentives Nominal Rate of Protection (NRP): Price Gap in relative terms It measures the deviation between the domestic farm gate price and the price producers would receive in an efficient market without government intervention (the reference price) It measures the impact of three factors: –Government policies (if any): tariffs, export subsidies, price floors and ceilings –Market structure: non-competitive behavior, monopsony –Inefficiencies: excessive profit margins, taxes, bribes, excessive marketing costs
: Price Gap in relative terms It measures the deviation between the domestic farm gate price and the price producers would receive in an efficient market without government intervention (the reference price) It measures the impact of three factors: –Government policies (if any): tariffs, export subsidies, price floors and ceilings –Market structure: non-competitive behavior, monopsony –Inefficiencies: excessive profit margins, taxes, bribes, excessive marketing costs")
12
Public Expenditure methodology - Broad scope: rural development spending, revenue foregone, administrative cost vs. policy transfers, share of aid - Comparable across countries; COFOG compatible - Allocation to commodities to estimate commodity support - Combination with price analysis provides comprehensive analysis of support to agricultural sector

14
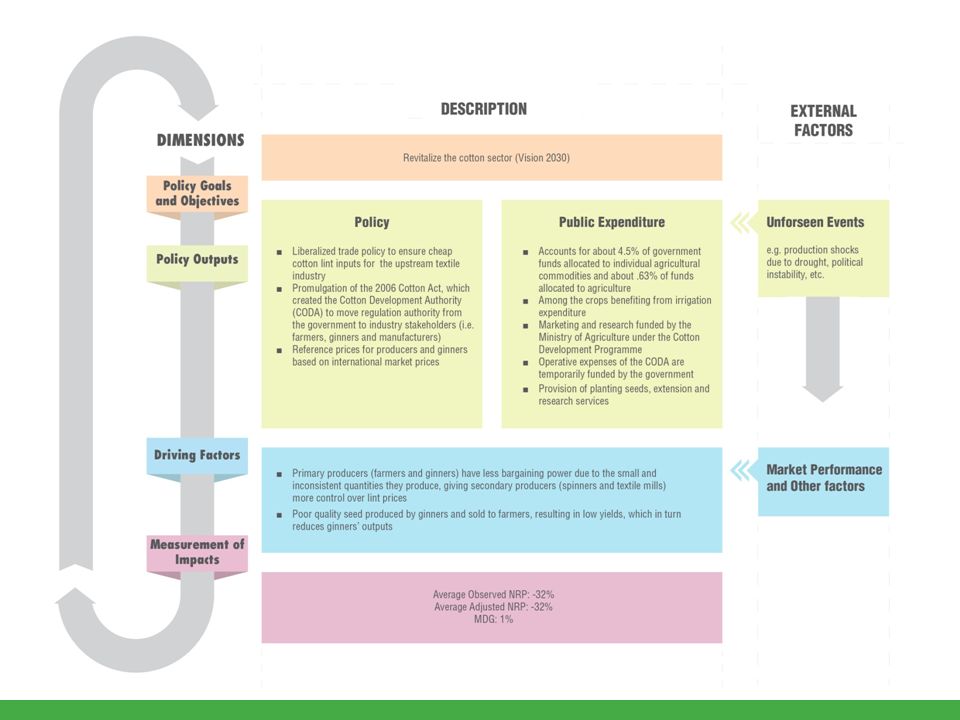
How is policy coherence measured? Assessing the consistency between public expenditure and price incentives for producers Difficult to measure the degree of consistency among policies within and across different policy areas or priorities –This is highly subjective and requires a large amount of discretion Given this difficulty, an analytical framework was developed…

16
Today’s Presentations Results for RICE in the following countries/regions: –Uganda –Ghana –Selected countries in Eastern Africa –Selected countries in Western Africa –8 countries in Africa Key results covered: –Background information –Policy environment –Indicators of price incentives/disincentives –Main messages

17
THANK YOU

18
ANNEX - Examples

19
Policy coherence

20
Government spending on rice in Mali high… Increasing rice production a key policy objective of government Input subsidies in place to support producers Rice sector also supported through targeted investments in irrigation infrastructure Total expenditure to rice represents at least 24% of total Share of agricultural specific expenditure targeted to the rice sector (2005 – 2010)
")
21
...but not consistent with other policy effects Farmers did not benefit from high international prices during food crisis And faced strong price disincentives Government signals are inconsistent Low prices and inconsistent policies reduce investment potential of farmers

Similar presentations


 International Food Aid and Development Conference August 2-4. 2010 Global Food Security U.S. Agencies Progressing on Governmentwide.>")


 1 MAFAP in Tanzania Agricultural Sector Consultative Working.>")


