Download presentation
Presentation is loading. Please wait.

1
Day 2: Hands-on UML Using UML to put MITA to work to solve the immediate process improvement needs of states

2
MITA UML Training – Day 2 Hands-on Training
8:30 – 10:00 Hands-on Exercises: Business Processes Set up model structure Simple business process (trigger, inputs, output, activities, decisions, business objects Activity diagrams for Provider Enrollment 10:15 – 12:00 Hands-on Exercises: System Integration Sequence Diagrams (options, alternatives) Capabilities as interface Service specifications for business and infrastructure processes 13:00 – 14:30 Artifact Generation and Tools Using the UML model to generate WSDL and XSDs: UML-to-WSDL configuration Using hyperModel for constrained Using MIF import to re-use HL7 models Integration with Subversion for version control 14:45 – 16:00 Hands-on: Using the HL7 and Fox tools MITA Project for MITA models Version control with Subversion HL7 information Model Change Control Fox Portal for project files
 Capabilities as interface. Service specifications for business and infrastructure processes. 13:00 – 14:30. Artifact Generation and Tools. Using the UML model to generate WSDL and XSDs: UML-to-WSDL configuration. Using hyperModel for constrained. Using MIF import to re-use HL7 models. Integration with Subversion for version control. 14:45 – 16:00. Hands-on: Using the HL7 and Fox tools. MITA Project for MITA models. Version control with Subversion. HL7 information Model. Change Control. Fox Portal for project files.")
3
Tooling Overview IBM Rational Software Architect/Modeler
Websphere Business Modeler Free plugins compatible with Eclipse 3.2 hyperModel 3.0: HL7 MIF, HL7 UML Profile, Abstract Datatypes Version Control (SVN) HL7 Web-based Tools Wiki MITA Project on HL7 Homebase
 HL7 Web-based Tools. Wiki. MITA Project on HL7 Homebase.")
4
Rational Software Modeler/Architect
Eclipse-based Uses the underlying EMF (Eclipse Modeling Framework)
")
5
Websphere Business Modeler
Integrated with RSA/RSM Eclipse based Open-source alternatives available

6
UML vs. BPMN , BPEL WSDL WSDL is the target representation of MITA-based messages and tools are widely available Business Process Automation is a relatively new and very appropriate for new development Eclipse based tools are available to add business process automation as needed: Eclipse and Eclipse Modeling Framework provides integration

7
BPMN BPEL <sequence name="main"
xmlns:ns=" xmlns:ns0=" <receive name="receiveInput" operation="initiate" partnerLink="client" portType="ns:Traffic2" variable="input"/> <assign name="Assign" validate="no"> <copy> <from part="payload" variable="input"> <query><![CDATA[/tns:input]]></query> </from> <to part="hwynums" variable="trafficRequest"/> </copy> </assign> <invoke inputVariable="trafficRequest" name="Invoke" operation="getTraffic" outputVariable="trafficResponse" partnerLink="traffic" portType="ns0:CATrafficPortType"/> <assign name="Assign1" validate="no"> <from part="return" variable="trafficResponse"/> <to part="return" variable="trafficResponse"/> <invoke inputVariable="output" name="callbackClient" operation="onResult" partnerLink="client" portType="ns:Traffic2Callback"/> </sequence> BPEL Visual Editor – available for Eclipse 3.3 tools

8
Eclipse Perspective Eclipse is a framework for IDEs (integrated development environments) In Eclipse, the layout of the user interface can be totally changed at the click of a button by changing “perspective” These layouts are called "perspectives" and they have various purposes. RSM includes a “Modeling” perspective. To view the SVN repository you need the SVN perspective In order to open a perspective select WindowOpen Perspective Other... and then select the perspective. In order to modify a perspective WindowShow View

9
Plugins and Features Add-on tools, open-source
Help Software Updates Find and Install Search for new features New Remote Site…

10
Getting Started… File New Project File New UML Model
Right-click in any tool to open context-sensitive menu

11
… using the style guide RSA provides default projects
“Blank.emx” The MITA styleguide will provide a consistent structure for each project

13
Project Browser Model contents vs. Views Diagrams Packages
Activity Actions Diagram Structured Activities Select a package and right-click context-specific menu Add Delete …

14
Model Elements Workspace Model Project (NewProject
Diagrams (by model) Models (separate .emx files) (New Model) Model Packages: name space for the various model elements (classes, interfaces, associations, actors) Diagrams Structure Behavior UML elements
 Models (separate .emx files) (New Model) Model. Packages: name space for the various model elements (classes, interfaces, associations, actors) Diagrams. Structure. Behavior. UML elements.")
15
Overview Reviewing the core modeling components Activity Diagrams
Class Diagrams (and Packages) Sequence Diagrams
 Sequence Diagrams.")
16
Model-driven Approach
As requirements change, we change the UML model re-generate user documentation re-generated WSDL re-generated XSD Diagrams provide views on the model an element change is automatically reflected in all diagrams that use the element

17
Tooling Capabilities Modeling Managed in MITA Project Repository
Includes WSDL and XSD generation Managed in MITA Project Repository Configuration management portal Developers check in / check out Model artifacts Available to all as Read-Only with downloadable viewer Wiki for brainstorming, co-editing documentations, collaboration

18
Summary of Project Artifacts
Model Artifacts Business Process (Activity diagram) MITA “to be” Minnesota specific business rules Business Triggers, system boundaries Information Model (Class Diagram ) HL7-based, standardized vocabulary Interactions (Sequence Diagram) Operations expose business capabilities Modeling realization artifacts Service Specifications Ports, interfaces, business rules User documentation and runtime artifacts WSDL XSD
 MITA to be Minnesota specific business rules. Business Triggers, system boundaries. Information Model (Class Diagram ) HL7-based, standardized vocabulary. Interactions (Sequence Diagram) Operations expose business capabilities. Modeling realization artifacts. Service Specifications. Ports, interfaces, business rules. User documentation and runtime artifacts. WSDL. XSD.")
19
Style Guide Pre-defined structure Selected notation
Certain diagrams/views Default MITA structure and local extensions

20
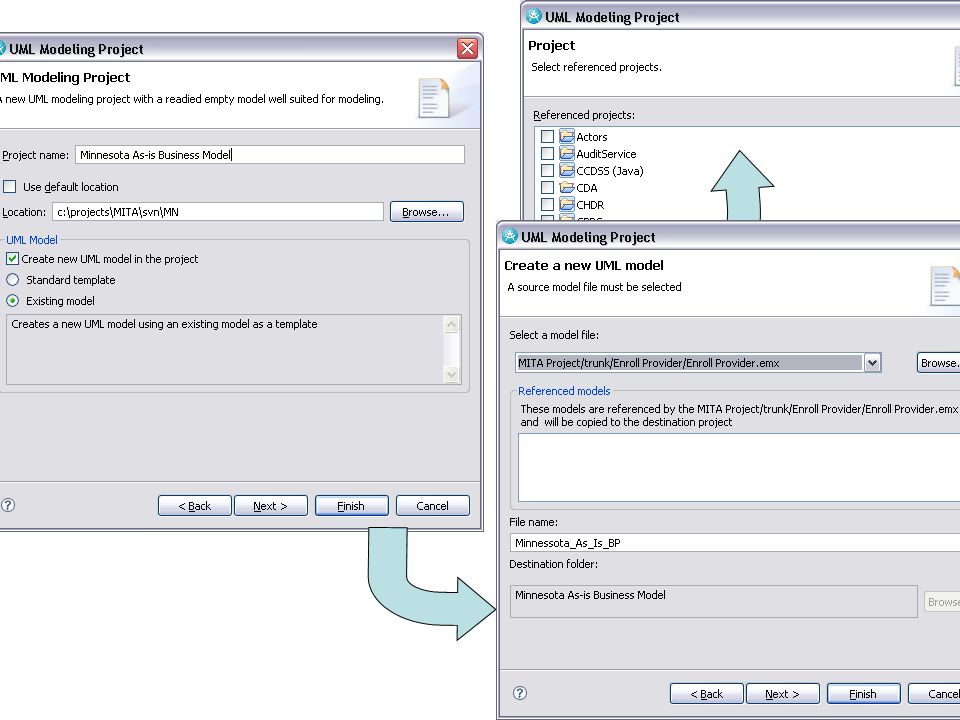
RSA: Create a new project
Create new UML project File New Project UML Project Re-use style guide or start from “blank”

21
Enroll Provider System
Logical Model Overview (using Classes and Packages) Enroll Provider Demo Enroll Provider System Enroll Provider Provider Registry Manage Provider Info Inquire Provider Info
 Enroll Provider Demo. Enroll Provider System. Enroll Provider. Provider Registry. Manage Provider Info Inquire Provider Info.")
22
Shared information

23
Shared information

24
Detailed Information Model: Healthcare Provider (Role)
Reuse reference HL7 class names, attributes, data types, code sets Reuse internal HL7 code sets, where appropriate Reuse standard coding systems (ICD, SNOMED, X12, NCPDP, etc.) as necessary Additional Medicaid codes may be submitted to Standard Development Organizations for adoption Benefit: Industry-standard code sets can be used in place of state-specific codes to enable semantic interoperability The HL7 Reference Information Model is extensive and includes a variety of contributions (industry, government, international) and it meets the needs of the Medicaid
 as necessary. Additional Medicaid codes may be submitted to Standard Development Organizations for adoption. Benefit: Industry-standard code sets can be used in place of state-specific codes to enable semantic interoperability. The HL7 Reference Information Model is extensive and includes a variety of contributions (industry, government, international) and it meets the needs of the Medicaid.")
25
Adding … Select package Add UML model element or a diagram
Context-sensitive dialog

26
Business Triggers (state changes)
Application extracted from business process analysis – service for provider enrollment. Pure activity diagram for provider enrollment application. Extracted from Provider Enrollment system swim lane in activity diagram for business analysis process. Three modules: New/Active, Valid, and Approved

27
Process description using activities
Action & Information Input Output Reference other process Control Edges – information and process control

28
RSA: Add a new diagram

29
Overview of business domains and areas

30
“Enroll Provider” Process
Input Data Trigger Result

31
Enroll Provider MITA Business Process Item Details Links Description
A brief description of the complete business process Location in the Model Trigger Event An occurrence that triggers a business process (e.g., receipt of a request, phone call, or a scheduled date) The Trigger is a defined data set. Sources of Trigger events Result One or more outcomes from the execution of the Business Logic (results are defined as data in motion and are the immediate output from the business process, not the ultimate, downstream result) The Result is a defined data set. Business processes affected by the Result Business Process Steps A sequence of steps that execute the successful completion of the business process (steps start with a verb) N/A Shared Data Shared data is data at rest (i.e., data stores accessed to complete a step in the business process) Shared data is a defined data set. List of data sources Predecessor The preceding business process, the Result of which becomes an input Trigger to this business process Other BP Successor The Results of this business process, which may become a Trigger for another business process Constraints Conditions that must be met for this generalized process to execute (e.g., enrolling institutional providers requires different information from enrolling pharmacies) External rules Failures An identification of the exit points throughout the business process where the Business Logic specifies that the process must terminate because of failure of one or more steps Failure Notifications Performance Measures Measures that describe what can be measured but that are not specific measures in themselves, such as the following: 1. Time to complete process (e.g. real-time response = within ___ seconds; batch response = within ___ days) 2. Accuracy of decisions = ___% 3. Consistency of decisions and disposition = ___% 4. Error rate = ___% or less The MITA template specifies the type of measure but not the actual measure. External source or performance measure rules Enroll Provider
 The Trigger is a defined data set. Sources of Trigger events. Result. One or more outcomes from the execution of the Business Logic (results are defined as data in motion and are the immediate output from the business process, not the ultimate, downstream result) The Result is a defined data set. Business processes affected by the Result. Business Process Steps. A sequence of steps that execute the successful completion of the business process (steps start with a verb) N/A. Shared Data. Shared data is data at rest (i.e., data stores accessed to complete a step in the business process) Shared data is a defined data set. List of data sources. Predecessor. The preceding business process, the Result of which becomes an input Trigger to this business process. Other BP. Successor. The Results of this business process, which may become a Trigger for another business process. Constraints. Conditions that must be met for this generalized process to execute (e.g., enrolling institutional providers requires different information from enrolling pharmacies) External rules. Failures. An identification of the exit points throughout the business process where the Business Logic specifies that the process must terminate because of failure of one or more steps. Failure Notifications. Performance Measures. Measures that describe what can be measured but that are not specific measures in themselves, such as the following: 1. Time to complete process (e.g. real-time response = within ___ seconds; batch response = within ___ days) 2. Accuracy of decisions = ___% 3. Consistency of decisions and disposition = ___% 4. Error rate = ___% or less. The MITA template specifies the type of measure but not the actual measure. External source or performance measure rules. Enroll Provider.")
32
RSA: Add “Description”
Diagram (empty)
")
33
Activity Diagram of Business Process
Trigger Event 1 Performance Measures Failures Constraints Successor Predecessor Shared Data Business Process Steps Result Trigger Event Description Links Details Item Tier 3: Enroll Provider PM Enroll Provider Control flow [condition] Failures 1 Decision Actions Reused Process Object flow [condition] Result

34
Shared Data Information Model HL7 as the starting point Input Messages
Class Diagrams provide a view of the shared data HL7 as the starting point Import MIF-based HL7 models into UML Modify Input Messages Output Messages

35
Class Diagram Provides a view of Information and structure of message content or service performed Class diagrams are grouped into packages that represent a type of message or a service. Class Message content (attributes) Interface Implemented by components/services Operations Enumeration Define value sets Coded literals A class is depicted on the class diagram as a rectangle with three horizontal sections, as shown in Figure 2. The upper section shows the class's name; the middle section contains the class's attributes; and the lower section contains the class's operations (or "methods").
 Interface. Implemented by components/services. Operations. Enumeration. Define value sets. Coded literals. A class is depicted on the class diagram as a rectangle with three horizontal sections, as shown in Figure 2. The upper section shows the class s name; the middle section contains the class s attributes; and the lower section contains the class s operations (or methods ).")
36
Information Model - Message
“Entities” have “roles” and “roles” have “participation” in “Acts” or “Events”

37
Share Information: Healthcare Provider (Role)
Primitive type Default value Multiplicity HL7 Datatype Attribute/ Property of the this type of object Enumeration

38
Detailed Information Model: Healthcare Provider (Role) Class Object
Name Section Stereotype { Class Name { Attribute Name Information models only use top two of three parts of class. Name Section: Stereotype of class name comes from vocabulary domain. Class Name is concatenated string of meaningful words with uppercase for each word that describe the class object being modeled. Attribute Section: Attributes are in the second section of the diagram. Two parts to each attribute: name and datatype separated by a colong To left of colon goes the attribute name. Two stereotypes of attribute names – “attribute” and “element” Attributes start with lover case, names are concantenated and all remaining names in string are uppercase. To right of colon goes the data type – either basic UML notation or from data types domain. Note that data types have cardinality and multiplicity but can also be specified within the attribute after data type name. Data types from a data type class are capitalized. A value can be set for the datatype following an “=“ sign. Attribute Multiplicity Attribute Value Attribute Section Attribute Name

39
Cardinality and Multiplicity
Multiplicities Meaning 0..1 Basic notation - Zero or one instance. Note that “m” representing a maximum number of instance may replace 1 and “n” representing a minimum number of instances may replace zero. 0..* or * Optionality - No limit on the number of instances and if zero then no minimum either.. 1 Cardinality of exactly one instance 1..* Cardinality of at least one instance. Note that * may be replaced by “m” representing a maximum number of instances.

40
RSA: Add shared data Add diagrams Add classes Class diagram
Root class of input message Root class of the response

41
Activity Diagram – detailed notation

42
RSA: Create a simple activity
Create information model package Create activity diagram Triggers Drag-and-drop input message Draw control flow Draw object flow to object node If the object flow cannot be created, an input pin is missing

43
Object nodes Data store: data flow in which the data is persistent
Central buffer: consolidates data from several sources and destinations. They do not connect directly to actions Input/Output pins

44
Edges/Connectors Control flow Object flow
Process control passed from one action to the next Object flow information “in”/”out”

45
Actions Simple actions Fork/join process flows
Re-used activities/processes

46
Information Model The information model is used to describe message content and structure. Unlike a data model which is used to represent permanent information, the data model is used to represent a snapshot of information at an instance in time for sharing information. The structures in information models represent how a message is composed to share information – not how data is stored within or retrieved from data structures. The source of the data captured for a message may include several data structures and data stores. The use of the data included in a message is various and can include parsing the information into one or more data stores. Data is manipulated from data stores for inclusion in messages, reports, or displays. Data within data stores may be in any format required by the application. Data is extracted from one or more data stores for composition of a message according to the schema for that message and will require transformation unless the data stores are XML representations of the schema. Conversely data is stored into one or more data stores from the message according to the usage requirements for that data beyond messaging – e.g. repositories for reporting and querying, updates to data stores based upon use of information in messages, It is important to note that only the source data for a message can be an authoritative source because data cannot be validated or verified for accuracy, authenticity, or authority after it has been put into a message. Message validation only ensures that data uses valid structures with valid values

47
HL7 Data Types Re-usable
Allows us to avoid platform compatibility issues

48
Value Sets/Vocabulary

49
Validation of messages
HL7 Terminology Intended for Code Sets Validation of messages Allowed values

50
Use cases Use case diagram identifies the business actors
Use cases elaborated using other views Scenarios Basic Alternate Error

51
Use case diagram Elaborate using High-level use cases only
Interactions Activities Without narrative High-level use cases only Focus on automation and integration Integration-related use cases

52
Infrastructure Use case
Use Case Diagram Identifies the various ways in which a user interacts with a system or other users Actors, use cases, associations, inclusion Enroll Provider Information relies on Add Update Inquire System Actor Actor Business Use case Infrastructure Use case

53
Service Define interfaces Create package Create component
Create a class diagram Interface Operations based on use cases Create package Namespace for service Create component Add port of a certain type (interface)
")
54
Provider Registry Service
Interface Port System

55
System Interactions Based on the Service(s) defined
Base on scenarios/use cases Lifelines used to organize service calls Each lifeline is an instance of interface or service Each message corresponds to an operation invocation Ad-hoc messages are not maintainable over time

56
Sequence Diagram User role : Actor Type System : Business Process
Message/Request System : Business Process System : Service type Return Asynchronous Notification

58
RSA: Sequence diagram New sequence diagram
Provider initiates the enrollment process Add alternative Add optional invocation

59
Sequence Diagram A sequence diagram is an interaction diagram that details how operations are carried out -what messages are sent and when. Sequence diagrams are organized according to time. The time progresses as you go down the page. The objects involved in the operation are listed from left to right according to when they take part in the message sequence. A sequence diagram has two dimensions: The vertical dimension shows the sequence of messages/calls in the time order that they occur; the horizontal dimension shows the object instances to which the messages are sent. A sequence diagram describes messages – each with a sender and receiver. In both cases the vertical lines represent the instances of the types indicated above them and the horizontal lines represent actions that involve the instances that they connect. Both dimensions can be expanded to refine the analysis and provide more detailed steps and a finer scale; each event can be expanded to more detailed sequences and each object to more detailed objects. A sequence diagram is almost explanatory; it shows the calls between the different objects in their sequence and can show, at a detailed level, different calls to different objects.

60
Use of Sequence Diagrams
Reading a sequence diagram is very simple. Start at the top left corner with the "driver" instance that starts the sequence. Then follow each message down the diagram. Remember: Even though the example shows a return message for each sent message, this is optional. Sequence charts for scenarios help to identify the different participants in the action and their interactions and to show the sequence of events. This helps with the conceptualization of the role of time and with understanding dependencies between instances. Sequence charts assist the designer in allocating instances among distributed system components and are often useful during testing. A sequence diagram is very simple to draw. Across the top of your diagram, identify the class instances (objects) by putting each class instance inside a box. In the box, put the class instance name and class name separated by a space/colon/space " : " (e.g., provider : Provider). The vertical “lifelines” are dashed lines to the bottom of the sequence. The activation bars are vertical oblong rectangles that begin when a message is received and end at some point in time after message is sent – depending on the processing activities associated with the class. If a class instance sends a message to another class instance, draw a line with an arrowhead pointing to the receiving class instance; place the name of the message/method above the line. Optionally, for important messages, you can draw a dotted line with an arrowhead pointing back to the originating class instance; label the return value above the dotted line. It is a good practice to include the return value lines because the extra details make the diagram easier to read.
 by putting each class instance inside a box. In the box, put the class instance name and class name separated by a space/colon/space : (e.g., provider : Provider). The vertical lifelines are dashed lines to the bottom of the sequence. The activation bars are vertical oblong rectangles that begin when a message is received and end at some point in time after message is sent – depending on the processing activities associated with the class. If a class instance sends a message to another class instance, draw a line with an arrowhead pointing to the receiving class instance; place the name of the message/method above the line. Optionally, for important messages, you can draw a dotted line with an arrowhead pointing back to the originating class instance; label the return value above the dotted line. It is a good practice to include the return value lines because the extra details make the diagram easier to read.")
61
Message Flow Conventions
Symbol Meaning Simple message which may be synchronous or asynchronous Simple message return (optional but recommended) A synchronous message An asynchronous message For the activity diagrams we are modeling we use simple messages if we don’t care about synchronization. This is usually the case for secondary messages. Synchronous message flow requires that the class object generating the message wait upon a response before doing anything else with message. Asynchronous messaging can be represented by any of the three arrow types shown in the table with synchronization. Asynchronous messaging means the class object originating the message does not need to wait on a response. We also use the simple message return in all cases where message is “outbound” after the original message is received from the application. We use synchronization for the original input from user and output back to user. The simple message return is not used with the end user because acknowledgements are sent back as synchronized messages to the end user..
 A synchronous message. An asynchronous message. For the activity diagrams we are modeling we use simple messages if we don’t care about synchronization. This is usually the case for secondary messages. Synchronous message flow requires that the class object generating the message wait upon a response before doing anything else with message. Asynchronous messaging can be represented by any of the three arrow types shown in the table with synchronization. Asynchronous messaging means the class object originating the message does not need to wait on a response. We also use the simple message return in all cases where message is outbound after the original message is received from the application. We use synchronization for the original input from user and output back to user. The simple message return is not used with the end user because acknowledgements are sent back as synchronized messages to the end user..")
62
Elements of Sequence Diagram
Driver Sequenced “life line” Self-directed Message Activation Bar This represents a possible, future reuse of the “Inquire Provider Information” process and corresponding service National Plan and Provider Enumeration System (NPPES) Message Return Message Name Sequenced classes with “life lines” instead of “swim lanes” because represents action over time as differentiated from order of activities.
 Message Return. Message Name. Sequenced classes with life lines instead of swim lanes because represents action over time as differentiated from order of activities.")
63
Alternate view: Communication diagram

64
Communication Diagram
Entirely equivalent to the sequence diagram Provides another view, improves documentation With RSA, it is automatically created Create a sequence diagram Select “interaction”, add “communication diagram”

65
HL7 Concepts Reference Information Model Patterns
Act-Participation-Role-Entity Observation – Author – Nurse - Person Act-ActRelationship Prescription Allergy Role-RoleLink PhysicianAssistant

66
HL7 Reference Information Model (RIM)
")
67
Model Management HL7 MITA Project Version Control with Subversion
Version Control with Subversion Model comparison SVN/SubversionPlugin Help Software updates Find and install

68
New Remote Site… HL7 import tool
HL7 import tool

69
WSDL and XSD generation
UML-to-WSDL Includes XSD generation Generate XSDs based on the content of a diagram Using hyperModel File New Transformation Source “services” package to the destination WSDL directory

71
WSDL

72
Change Control Process Overview

73
HL7 MITA Project: Repository
hl7projects.hl7.nscee.edu

74
Issue and change request tracker
![]()
75
Fox Portal

Similar presentations