Download presentation
Presentation is loading. Please wait.

1
Update to Woodway

2
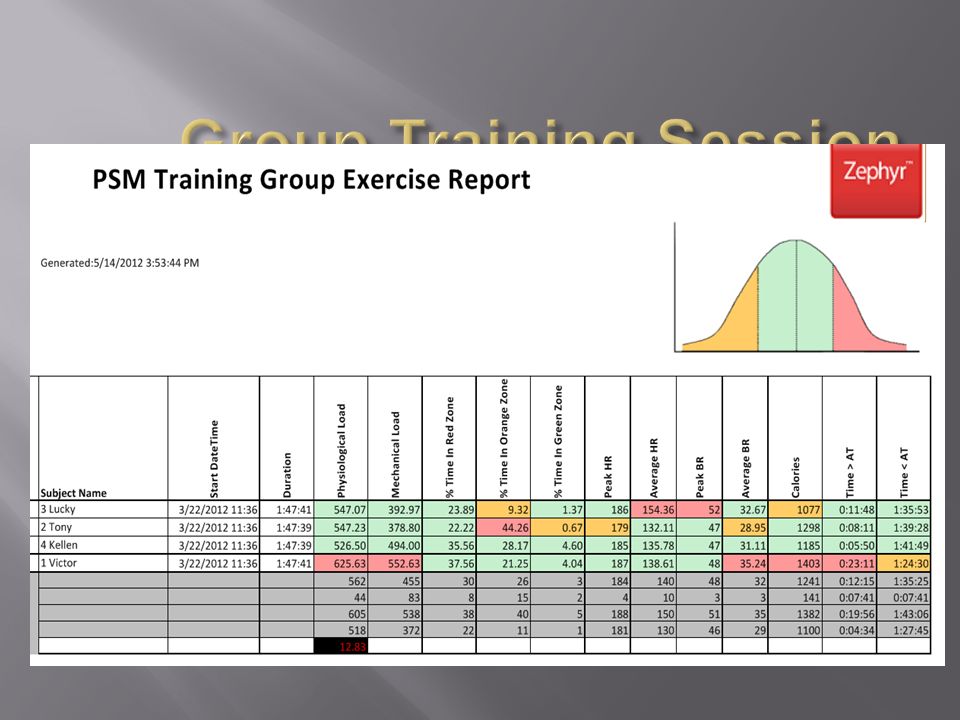
PSM Training Echo is a tool targeted at S&C coaches and trainers to provide; 1. Metrics to measure the effectiveness of their training regimes & programs over time Session, week,season 2. Simplified reports, easily generated Eliminate imports from various sensors.

3
The BioHarness measures & provides 5 inputs: 1. ECG 2. Respiration 3. Core Temp. 4. Accelerometry 5. Time

4
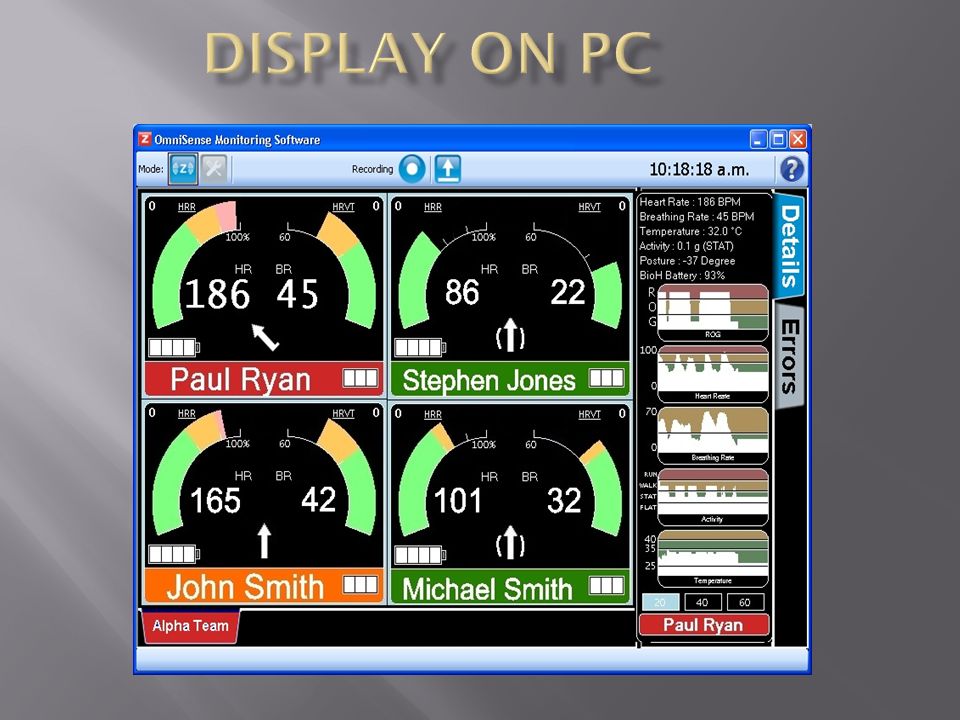
Windows Laptop OmniSense Software Repeaters up to 4 1000 feet gateway only; 2,000 ft with repeaters Gateway antennae

5
Displayed top left, or top right, or centre. Select via ‘Preferences’ box. BioGaug e

6
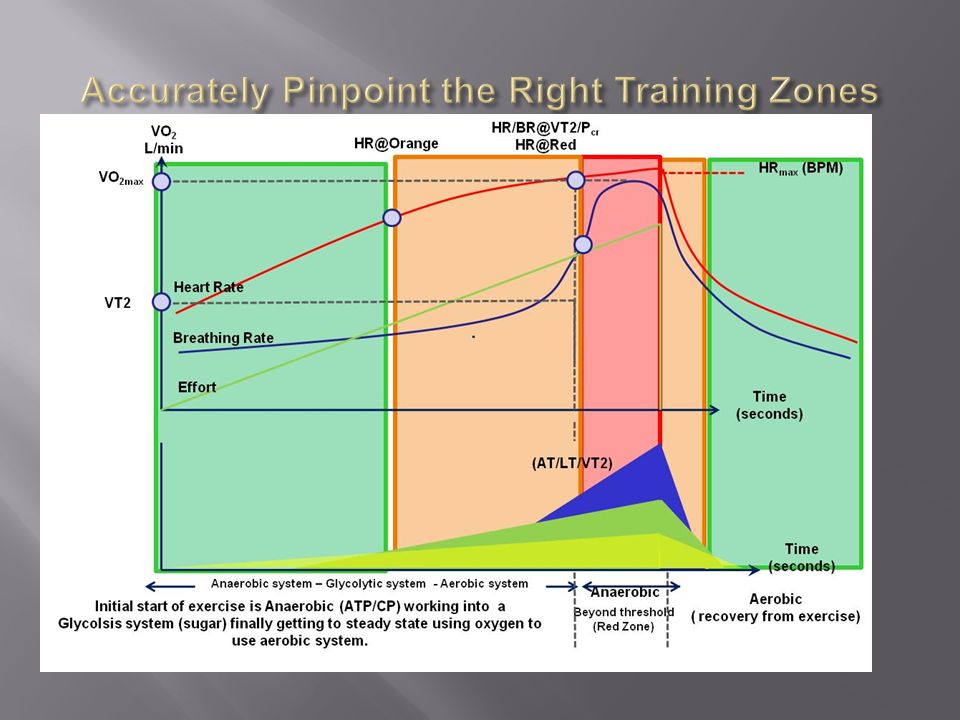
Add section: Safety ROG Defaults High HR Orange (%HRmax) 90% High HR Red (%HRmax) 80% Low HR Red (BPM) 40 High BR Red (BPM) 40 Low BR Red (BPM) 4 High Tcore (degrees F or C) 102.5 F Act Low (time)30 sec Add section (drives the color of the tile in Training tab): Training HR Zones(reset to default option) Red (High intensity zone) 110%HR@AT – 100%HRmax Orange (Anaerobic zone) 100%HR@AT – 110%HR@AT Yellow95%HR@AT – 100%HR@AT Green (Aerobic zone) 85%HR@AT – 95%HR@AT Blueless than 85%HR@AT **the values in red are configurable by the user, but these are the default values, the correlating upper range values tie to the configured values (these default zones are based on the three training zones from Paul Robbins’ iMETT Periodization software) Workouts Training Zones ROG Thresholds Customization of Safety & Training Zone parameters
 90% High HR Red (%HRmax) 80% Low HR Red (BPM) 40 High BR Red (BPM) 40 Low BR Red (BPM) 4 High Tcore (degrees F or C) F Act Low (time)30 sec Add section (drives the color of the tile in Training tab): Training HR Zones(reset to default option) Red (High intensity zone) – 100%HRmax Orange (Anaerobic zone) – – Green (Aerobic zone) – Blueless than **the values in red are configurable by the user, but these are the default values, the correlating upper range values tie to the configured values (these default zones are based on the three training zones from Paul Robbins’ iMETT Periodization software) Workouts Training Zones ROG Thresholds Customization of Safety & Training Zone parameters")
7
Jump Height Repeatable indication of power 40 Yard Dash How ‘explosive’ is a player? Peak Gs in 1 st second Static Test Dehydration, Acute fatigue, Over-training? HRV, HRrest Treadmill Test Maximal effort VO2max, AT, Hrmax, HRrecovery 101 20 180 27 192 41

9
Parameter Description Heart Rate Beats per minute Heart Rate Percent HR displayed against background stratified at 65% and 85%of subject's HR max Breathing Rate Breaths per minute Posture 0°=vertical 90°=prone 180°=inverted ActivityVMU = 0.2~walking 0.8~jogging. At each 100Hz sampling point, the three axial accelerometer values are combined to give a single acceleration magnitude in g. VMU is the average value of this magnitude over a 1 second epoch Peak AccelerationThe largest acceleration magnitude - 3 axes combined – in previous second. Max. dependent on hardware version. 3.3g on older hardware; currently 8g Heart Rate at AT Recorded when subject crosses their breathing rate anaerobic threshold Heart Rate Recovery at 30sec Recorded when HRR criteria are met Physiological Load Cumulative index of effort based on heart rate Mechanical Load Cumulative index of effort based on acceleration Training Load Average of the above two Physiological Intensity I nstantaneous index of effort based on heart rate Mechanical Intensity Instantaneous index of effort based on acceleration Training Intensity Average of the above two

11
Physiological Load : a cumulative score, based on time in HR-zones, that adds up over a work-out to indicate how much physiological load your system has experienced during that session. Equation: Physiological Load = HR avg is calculated for each epoch (1/60 mins (1 second but in units of minutes)), and a value assigned to zone factor according to: HR _Zone_Factor Criteria 5HRavg between 90% & 100% HRmax 4HRavg between 80% & 89% HRmax 3HRavg between 70% & 79% HRmax 2HRavg between 60% & 69% HRmax 1HRavg between 50% & 59% HRmax 0HRavg less than 49% HRmax Needs to be 0-10
), and a value assigned to zone factor according to: HR _Zone_Factor Criteria 5HRavg between 90% & 100% HRmax 4HRavg between 80% & 89% HRmax 3HRavg between 70% & 79% HRmax 2HRavg between 60% & 69% HRmax 1HRavg between 50% & 59% HRmax 0HRavg less than 49% HRmax Needs to be")
12
Mechanical Load : a cumulative score, based on time in ‘G-zones’, that adds up over a work-out to indicate how much mechanical load your system has experienced during that session. Peak G avg is calculated for each epoch (1/60 mins (1 second but in units of minutes)), and a value assigned to zone factor according to: PeakG_Zone _Factor Criteria 5PeakGavg greater than 2.5 Gs 4PeakGavg between 2.0 & 2.49 Gs 3PeakGavg between 1.5 & 1.99 Gs 2PeakGavg between 1.0 & 1.49 Gs 1PeakGavg between 0.5 &.99 Gs 0PeakGavg less than 0.49 Gs Needs to be 0-10
), and a value assigned to zone factor according to: PeakG_Zone _Factor Criteria 5PeakGavg greater than 2.5 Gs 4PeakGavg between 2.0 & 2.49 Gs 3PeakGavg between 1.5 & 1.99 Gs 2PeakGavg between 1.0 & 1.49 Gs 1PeakGavg between 0.5 &.99 Gs 0PeakGavg less than 0.49 Gs Needs to be")
13
Physiological intensity : used in 2 ways: a. Instantaneous : tells you how hard you are working at that moment, on a scale of 0-5. b. Average at end of session : tells you how hard you worked on a scale of 0-5, on average, during a session. Equation: a. Instantaneous Physiological Intensity = current HRzone factor b. Session Average Physiological Intensity = (Physiological_Load) / (Session_Duration_in_Minutes) HR _Zone_Factor Criteria 5HRavg between 90% & 100% HRmax 4HRavg between 80% & 89% HRmax 3HRavg between 70% & 79% HRmax 2HRavg between 60% & 69% HRmax 1HRavg between 50% & 59% HRmax 0HRavg less than 49% HRmax Needs to be 0-10
 / (Session_Duration_in_Minutes) HR _Zone_Factor Criteria 5HRavg between 90% & 100% HRmax 4HRavg between 80% & 89% HRmax 3HRavg between 70% & 79% HRmax 2HRavg between 60% & 69% HRmax 1HRavg between 50% & 59% HRmax 0HRavg less than 49% HRmax Needs to be")
14
Mechanical Intensity : a. Instantaneous : tells you how hard you are working at that moment, on a scale of 0-5. b. Average at end of session : tells you how hard you worked on a scale of 0-5, on average, during a session. Equation: a. Instantaneous: Current G-zone factor b. Average Mechanical Intensity = (Mechanical_Load)/(Session_Duration_in_Minutes) PeakG_Zone _Factor Criteria 5PeakGavg greater than 2.5 Gs 4PeakGavg between 2.0 & 2.49 Gs 3PeakGavg between 1.5 & 1.99 Gs 2PeakGavg between 1.0 & 1.49 Gs 1PeakGavg between 0.5 &.99 Gs 0PeakGavg less than 0.49 Gs Needs to be 0-10
/(Session_Duration_in_Minutes) PeakG_Zone _Factor Criteria 5PeakGavg greater than 2.5 Gs 4PeakGavg between 2.0 & 2.49 Gs 3PeakGavg between 1.5 & 1.99 Gs 2PeakGavg between 1.0 & 1.49 Gs 1PeakGavg between 0.5 &.99 Gs 0PeakGavg less than 0.49 Gs Needs to be")
15
Low intensity 3 Preview: Add section: Workouts Copy over workouts that can be prescribed from Periodization software: Low intensity 4 Low intensity 5 Medium intensity 1 Medium intensity 2 Medium intensity 3 Preview: Includes the workout in the Session Names list and dropdown on Live Workouts Training Zones ROG Thresholds Incorporation of IMETT Periodization workouts Workout Sessions drive the target zone color on the Training tab which changes over time with the prescribed workout, and when selected, user sees a preview of the workout/test as below.

17
R ↑ H R 0 Safe ty Training Change name ne w BH 367 Add assigned BH device ID on left side of name (always present)
")
Similar presentations


 You’ve just had one of the most grueling days of your life when you stumble upon a wishing well. While you don’t typically believe.>")


 Zone>")
