Download presentation
Presentation is loading. Please wait.

1
From Analyzing the Tuberculosis Genome to Modeling the Milky Way Galaxy Using Volunteer Computing for Computational Science Travis Desell Department of Computer Science, Rensselaer Polytechnic Institute November 29, 2010University of North Dakota

2
1. Computational Science MilkyWay@Home DNA@Home 2. A Case for Asynchronous Computing 3. Asynchronous Optimization Evolutionary Algorithms Asynchronous EAs Simulation Verification 4. Questions?

3
The Sagittarius Dwarf Tidal Stream Image (above): [Ibata et al. 1997, AJ] Image (below): David Martinez-Delgado (MPIA) & Gabriel Perez (IAC) The Sagittarius Dwarf Galaxy is merging with the Milky Way The dwarf is being tidally disrupted by the Milky Way, creating long “tails.” Provide information on matter distribution in Milky Way Provide constraints on Galactic Halo Mapping the Tidal Stream will:
: David Martinez-Delgado (MPIA) & Gabriel Perez (IAC) The Sagittarius Dwarf Galaxy is merging with the Milky Way The dwarf is being tidally disrupted by the Milky Way, creating long tails. Provide information on matter distribution in Milky Way Provide constraints on Galactic Halo Mapping the Tidal Stream will:.")
4
Image: sdss.org 230+ million objects 8,400 square degrees in the sky Large percentage of north galactic cap Very little data in galactic plane (too much dust) Several hundred thousand stars SLOAN Digital Sky Survey
 Several hundred thousand stars SLOAN Digital Sky Survey")
5
The Milky Way Halo Bulge Thin Disk Thick Disk ~30 kiloparsecs (100,000 light-years) Sun Sagittarius Dwarf Galaxy Tidal Stream Data Wedge Image: Matthew Newby
 Sun Sagittarius Dwarf Galaxy Tidal Stream Data Wedge Image: Matthew Newby")
6
Sagittarius Stream Model Assume stream is a cylinder Radial drop-off given by a Gaussian Distribution 2 background parameters (new model has 4): r0, q 6 parameters per stream: ε, μ, r, θ, φ, σ A single stream with the old model has an 8 dimensional search space Often fit multiple streams for search spaces with more than 20 dimensions! Background distribution:

7
Nathan Cole, Heidi Newberg, Malik Magdon-Ismail, Travis Desell, Kristopher Dawsey, Warren Hayashi, Jonathan Purnell, Boleslaw Szymanski, Carlos A. Varela, Benjamin Willett, and James Wisniewski. Maximum Likelihood Fitting of Tidal Streams with Application to the Sagittarius Dwarf Tidal Tails. Astrophysical Journal, 683:750-766, 2008.Maximum Likelihood Fitting of Tidal Streams with Application to the Sagittarius Dwarf Tidal Tails Nathan Cole. Maximum Likelihood Fitting of Tidal Streams with Application to the Sagittarius Dwarf Tidal Tails. PhD thesis. Rensselaer Polytechnic Institute. 2009.Maximum Likelihood Fitting of Tidal Streams with Application to the Sagittarius Dwarf Tidal Tails Further Reading

8
N-Body Simulation Density of stars along the Orphan Stream Can we simulate the formation of tidal streams?

9
N-Body Simulation Density of stars can be simulated with N-body simulations, and fitness to real data can be optimized to determine Orphan Stream progenitor parameters (mass, size, evolution time)
")
10
Travis Desell, Benjamin Willett, Matthew Arsenault, Heidi Newberg, Malik Magdon- Ismail, Boleslaw Szymanski, Carlos A. Varela. Evolving N-Body Simulations to Determine the Origin and Structure of the Milk Way Galaxy's Halo using Volunteer Computing. International Parallel and Distributed Processing Symposium (IPDPS) 2011. To appear (hopefully).Evolving N-Body Simulations to Determine the Origin and Structure of the Milk Way Galaxy's Halo using Volunteer Computing Further Reading
 To appear (hopefully).Evolving N-Body Simulations to Determine the Origin and Structure of the Milk Way Galaxy s Halo using Volunteer Computing Further Reading.")
11
DNA@Home Find protein binding sites using Gibbs sampling Use random walks (Markov chains) which result in sites distributed according to their actual probability of being the correct binding site Initial sequences: Mycobacterium tuberculosis Yersinia pestis (cause of the Bubonic plague)
 which result in sites distributed according to their actual probability of being the correct binding site Initial sequences: Mycobacterium tuberculosis Yersinia pestis (cause of the Bubonic plague)")
12
What is a Binding Site? Alberts, Johnson, Lewis, Raff, Roberts, & Walter, Molecular Biology of the Cell 4th Edition, 2002 Binding sites are squences of DNA before a gene that proteins bind to. Different proteins will cause the gene to either ‘turn on’ or ‘turn off’.

13
Finding Binding Sites Biology is messy -- binding sites are not exact sequences. Multiple species with the same genes will have similar binding sites. We need to find ‘motifs’ which have the best probability of matching sequences of DNA across species.

14
Objective - Regulatory Circuits Howard-Ashby, Materna, Brown, Tu, Oliveri, Cameron, & Davidson, Dev Biol, 2006 Turning a gene on causes new proteins to be produced, what binding sites will that activate? Turning a gene off stops production of proteins, which other binding sites will that activate?

15
A Case for Asynchronous Computing

16
SETI@Home Hosts

17
MilkyWay@Home Hosts

18
MilkyWay@Home Statistics over 25,000 active users (from over 150 countries) over 36,000 active hosts ~850 teraflops (has reached 1.6 petaflops): most powerful BOINC project was 3rd most powerful computing system (behind Folding@Home and the fastest supercomputer) most of this from GPU computing
 over 36,000 active hosts ~850 teraflops (has reached 1.6 petaflops): most powerful BOINC project was 3rd most powerful computing system (behind and the fastest supercomputer) most of this from GPU computing")
19
MilkyWay@Home GPU Application First GPU implementation was user- contributed Compared to 3.0Ghz AMD Phenom(tm) II X4 940: ATI HD5870 GPU - 109x speedup NVidia GeForce GTX 285 GPU - 17x speedup Requires double-precision calculations: NVidia GPUs have less double precision real estate Application would be 6.2x faster on the ATI GPU, 7.8x faster on the NVidia GPU using single-precision math Travis Desell, Anthony Waters, Malik Magdon-Ismail, Boleslaw Szymanski, Carlos Varela, Matthew Newby, Heidi Newberg, Andreas Przystawik and Dave Anderson. Accelerating the MilkyWay@Home volunteer computing project with GPUs. In the 8th International Conference on Parallel Processing and Applied Mathematics (PPAM 2009), Wroclaw, Poland, September 2009.Accelerating the MilkyWay@Home volunteer computing project with GPUs
, Wroclaw, Poland, September 2009.Accelerating the volunteer computing project with GPUs.")
20
Data from http://www.top500.orghttp://www.top500. Supercomputer Cores by Top 500 Rank (Circa November 2009) RPI CCNI BlueGene/L
 RPI CCNI BlueGene/L.")
21
Architectures are becoming heterogeneous (CPUs, GPUs) As hosts/cores increase, so does the chance of errors/failures A Case for Asynchronous Computing
 As hosts/cores increase, so does the chance of errors/failures A Case for Asynchronous Computing")
22
New algorithms need to be efficient, scalable and reliable Asynchronous Computing -- minimize synchronization/dependencies between computing hosts A Case for Asynchronous Computing

23
Asynchronous Optimization

24
Take some function: f(p 1, p 2,... p n ) = ? How can we find p = p 1, p 2,... p n such that f is maximized (or minimized)? What is Optimization?
. What is Optimization .")
25
Genetic Search: based on evolution, new populations are generated by selection, mutation and recombination (reproduction). Particle Swarm Optimization: individuals or particles ‘swarm’ around the search space, being attracted to the best particle position and their own previously best found position. Differential Evolution: individuals ‘evolve’ by recombination with other individuals and the differentials between other individuals. Evolutionary Algorithms

26
Further Reading on EA Strategies Travis Desell. Asynchronous Global Optimization for Massive-Scale Computing. PhD thesis. Rensselaer Polytechnic Institute. 2009Asynchronous Global Optimization for Massive-Scale Computing Travis Desell, Boleslaw Szymanski, and Carlos A. Varela. An Asynchronous Hybrid Genetic-Simplex Search for Modeling the Milky Way Galaxy using Volunteer Computing. In Genetic and Evolutionary Computation Conference (GECCO 2008), Atlanta, Georgia, pages 921-928, July 2008.An Asynchronous Hybrid Genetic-Simplex Search for Modeling the Milky Way Galaxy using Volunteer Computing Extra slides at the end.
, Atlanta, Georgia, pages , July 2008.An Asynchronous Hybrid Genetic-Simplex Search for Modeling the Milky Way Galaxy using Volunteer Computing Extra slides at the end..")
27
An Example

28
Minimize Sphere: f(x) = Minimum at f(0,..., 0)
 = Minimum at f(0,..., 0)")
29
Genetic Search Example -5, 2, -2 -2, 4, -5 -4, -2, 0 2, -1, 0 2, 3, -3 population 3, 0, 1 2, -3, 2 -5, 0, 4 -4, -2, -5 2, 4, 1 1. Set bounds: -5 to 5 for all parameters 2. Create initial population

30
Genetic Search Example -5, 2, -2 -2, 4, -5 -4, -2, 0 2, -1, 0 2, 3, -3 population 3, 0, 1 2, -3, 2 -5, 0, 4 -4, -2, -5 2, 4, 1 3. Calculate fitnesses for individuals 33 45 20 5 22 fitness 10 17 41 45 21

31
Genetic Search Example -5, 2, -2 -2, 4, -5 -4, -2, 0 2, -1, 0 2, 3, -3 population 3, 0, 1 2, -3, 2 -5, 0, 4 -4, -2, -5 2, 4, 1 4. Sort the population (only for GS) 33 45 20 5 22 fitness 10 17 41 45 21
 fitness")
32
Genetic Search Example -5, 2, -2 -2, 4, -5 -4, -2, 0 2, -1, 0 2, 3, -3 population 3, 0, 1 2, -3, 2 -5, 0, 4 -4, -2, -5 2, 4, 1 5. Generate new population via heuristics. GS uses Selection, Mutation, Recombination 33 45 20 5 22 fitness 10 17 41 45 21

33
Genetic Search Example -5, 2, -2 -2, 4, -5 -4, -2, 0 2, -1, 0 2, 3, -3 population 3, 0, 1 2, -3, 2 -5, 0, 4 -4, -2, -5 2, 4, 1 33 45 20 5 22 fitness 10 17 41 45 21 2, -1, 0 3, 0, 1 new population 5. Generate new population via heuristics GS uses Selection, Mutation, Recombination

34
Genetic Search Example -5, 2, -2 -2, 4, -5 -4, -2, 0 2, -1, 0 2, 3, -3 population 3, 0, 1 2, -3, 2 -5, 0, 4 -4, -2, -5 2, 4, 1 33 45 20 5 22 fitness 10 17 41 45 21 2, -1, 0 3, 0, 1 new population 2, 4, -3 5. Generate new population via heuristics GS uses Selection, Mutation, Recombination

35
Genetic Search Example -5, 2, -2 -2, 4, -5 -4, -2, 0 2, -1, 0 2, 3, -3 population 3, 0, 1 2, -3, 2 -5, 0, 4 -4, -2, -5 2, 4, 1 33 45 20 5 22 fitness 10 17 41 45 21 2, -1, 0 3, 0, 1 new population 2, 4, -3 1, -1, 0 5. Generate new population via heuristics GS uses Selection, Mutation, Recombination

36
Genetic Search Example -5, 2, -2 -2, 4, -5 -4, -2, 0 2, -1, 0 2, 3, -3 population 3, 0, 1 2, -3, 2 -5, 0, 4 -4, -2, -5 2, 4, 1 33 45 20 5 22 fitness 10 17 41 45 21 2, -1, 0 3, 0, 1 new population 2, 4, -3 1, -1, 0 -1, -2, 0 5. Generate new population via heuristics GS uses Selection, Mutation, Recombination

37
Genetic Search Example -5, 2, -2 -2, 4, -5 -4, -2, 0 2, -1, 0 2, 3, -3 population 3, 0, 1 2, -3, 2 -5, 0, 4 -4, -2, -5 2, 4, 1 33 45 20 5 22 fitness 10 17 41 45 21 2, -1, 0 3, 0, 1 new population 2, 4, -3 1, -1, 0 -1, -2, 0 -1.5, -0.5, 0 5. Generate new population via heuristics GS uses Selection, Mutation, Recombination

38
Genetic Search Example -5, 2, -2 -2, 4, -5 -4, -2, 0 2, -1, 0 2, 3, -3 population 3, 0, 1 2, -3, 2 -5, 0, 4 -4, -2, -5 2, 4, 1 33 45 20 5 22 fitness 10 17 41 45 21 2, -1, 0 3, 0, 1 new population 2, 4, -3 1, -1, 0 -1, -2, 0 -1.5, -0.5, 0 2, 1.5, 0.5 5. Generate new population via heuristics GS uses Selection, Mutation, Recombination

39
Genetic Search Example -5, 2, -2 -2, 4, -5 -4, -2, 0 2, -1, 0 2, 3, -3 population 3, 0, 1 2, -3, 2 -5, 0, 4 -4, -2, -5 2, 4, 1 33 45 20 5 22 fitness 10 17 41 45 21 2, -1, 0 3, 0, 1 new population 2, 4, -3 1, -1, 0 -1, -2, 0 -1.5, -0.5, 0 2, 1.5, 0.5 -1.5, 0, 2.5 5. Generate new population via heuristics GS uses Selection, Mutation, Recombination

40
Genetic Search Example -5, 2, -2 -2, 4, -5 -4, -2, 0 2, -1, 0 2, 3, -3 population 3, 0, 1 2, -3, 2 -5, 0, 4 -4, -2, -5 2, 4, 1 33 45 20 5 22 fitness 10 17 41 45 21 2, -1, 0 3, 0, 1 new population 2, 4, -3 1, -1, 0 -1, -2, 0 -1.5, -0.5, 0 2, 1.5, 0.5 -1.5, 0, 2.5 2, 1, -1.5 5. Generate new population via heuristics GS uses Selection, Mutation, Recombination

41
Genetic Search Example -5, 2, -2 -2, 4, -5 -4, -2, 0 2, -1, 0 2, 3, -3 population 3, 0, 1 2, -3, 2 -5, 0, 4 -4, -2, -5 2, 4, 1 33 45 20 5 22 fitness 10 17 41 45 21 2, -1, 0 3, 0, 1 new population 2, 4, -3 1, -1, 0 -1, -2, 0 -1.5, -0.5, 0 2, 1.5, 0.5 -1.5, 0, 2.5 2, 1, -1.5 -1.5, 3, -0.5 5. Generate new population via heuristics GS uses Selection, Mutation, Recombination

42
Genetic Search Example 6. Go to step 3 using the new population. 2, -1, 0 3, 0, 1 new population 2, 4, -3 1, -1, 0 -1, -2, 0 -1.5, -0.5, 0 2, 1.5, 0.5 -1.5, 0, 2.5 2, 1, -1.5 -1.5, 3, -0.5

43
Genetic Search Example 3. Calculate fitnesses for individuals 6.5 7.25 2 5 2.5 fitness 10 29 8.5 11.5 5 2, -1, 0 3, 0, 1 new population 2, 4, -3 1, -1, 0 -1, -2, 0 -1.5, -0.5, 0 2, 1.5, 0.5 -1.5, 0, 2.5 2, 1, -1.5 -1.5, 3, -0.5

44
Genetic Search Example 4. Sort the population 5. Generate new population... and so on. 6.5 7.25 2 5 2.5 fitness 10 29 8.5 11.5 5 2, -1, 0 3, 0, 1 new population 2, 4, -3 1, -1, 0 -1, -2, 0 -1.5, -0.5, 0 2, 1.5, 0.5 -1.5, 0, 2.5 2, 1, -1.5 -1.5, 3, -0.5

45
Genetic Search Example 4. Sort the population 5. Generate new population... and so on. 6.5 7.25 2 5 2.5 fitness 10 29 8.5 11.5 5 2, -1, 0 3, 0, 1 new population 2, 4, -3 1, -1, 0 -1, -2, 0 -1.5, -0.5, 0 2, 1.5, 0.5 -1.5, 0, 2.5 2, 1, -1.5 -1.5, 3, -0.5 After one iteration the population has already improved quite a bit

46
Problems with Iterations/Generations ? ? ? ? fitness ? 2, -1, 0 population 1, -1, 0 -1, -2, 0 -1.5, -0.5, 0 2, 1.5, 0.5 A popular parallel computing strategy is to the divide fitness evaluations among worker processors. ? ? 1, -1, 0 -1.5, -0.5, 0 worker 1 ? ? 1, -1, 0 -1.5, -0.5, 0 worker 2 ? 1, -1, 0 worker 3

47
Problems with Iterations ? ? ? ? fitness ? 2, -1, 0 population 1, -1, 0 -1, -2, 0 -1.5, -0.5, 0 2, 1.5, 0.5 Already we have a problem: What if we can’t divide the population evenly? ? ? 1, -1, 0 -1.5, -0.5, 0 worker 1 ? ? 1, -1, 0 -1.5, -0.5, 0 worker 2 ? 1, -1, 0 worker 3 busy busy busyIdle

48
Problems with Iterations ? ? ? ? fitness ? 2, -1, 0 population 1, -1, 0 -1, -2, 0 -1.5, -0.5, 0 2, 1.5, 0.5 What if a host fails? ? ? 1, -1, 0 -1.5, -0.5, 0 worker 1 ? ? 1, -1, 0 -1.5, -0.5, 0 worker 2 ? 1, -1, 0 worker 3 busy busy busyIdle

49
Problems with Iterations ? ? ? ? fitness ? 2, -1, 0 population 1, -1, 0 -1, -2, 0 -1.5, -0.5, 0 2, 1.5, 0.5 ? ? 1, -1, 0 -1.5, -0.5, 0 worker 2 (slow) ? 1, -1, 0 worker 3 busy busy busyIdle Idle ? ? 1, -1, 0 -1.5, -0.5, 0 worker 1 (fast) What if the fitness evaluation time is non-deterministic? What if the processors are heterogeneous?
 . 1, -1, 0 worker 3 busy busy busyIdle Idle . 1, -1, , -0.5, 0 worker 1 (fast) What if the fitness evaluation time is non-deterministic. What if the processors are heterogeneous .")
50
Problems with Iterations You always have to wait for the slowest fitness evaluations before you can proceed to the next generation. Failures are worse, you need to be resend and recalculate before you can proceed. This can cause a lot of idle time. Load balancing can help but it is not perfect, and doesn’t handle failures.

51
Asynchronous Optimization Strategy Population Fitness (1) Fitness (2) Fitness (n)................ Individual (1) Individual (2) Individual (n)................ Unevaluated Individuals Unevaluated Individual (1) Unevaluated Individual (2) Unevaluated Individual (n)................ Workers (Perform Fitness Evaluation) Report results and update population Request Work Send Work Generate individuals when queue is low Add new individual in order and remove worst individual Select parents from population to generate new individual
 Individual (2) Individual (n) Unevaluated Individuals Unevaluated Individual (1) Unevaluated Individual (2) Unevaluated Individual (n) Workers (Perform Fitness Evaluation) Report results and update population Request Work Send Work Generate individuals when queue is low Add new individual in order and remove worst individual Select parents from population to generate new individual.")
52
Asynchronous Optimization Example population 1. Generate a random initial population by sending out random parameter sets and waiting for the result. 2. Insert initial results in-order. -5, 2, -2 -2, 4, -5 -4, -2, 0 2, -1, 0 2, 3, -3 3, 0, 1 2, -3, 2 -5, 0, 4 -4, -2, -5 2, 4, 1 33 45 20 5 22 10 17 41 45 21

53
Asynchronous Optimization Example populationworker 1 -3.5, 2, -0.5? Work Request Recombination -5, 2, -2 -2, 4, -5 -4, -2, 0 2, -1, 0 2, 3, -3 3, 0, 1 2, -3, 2 -5, 0, 4 -4, -2, -5 2, 4, 1 33 45 20 5 22 10 17 41 45 21 If the population is not full, generate a new random individual. If a worker requests work, create a new individual using mutation or recombination (for GS).
..")
54
Asynchronous Optimization Example population If a worker requests work, create a new individual using mutation or recombination (for GS). worker 1 ? Work Request worker 2 -0.5, -1, -2? Recombination -5, 2, -2 -2, 4, -5 -4, -2, 0 2, -1, 0 2, 3, -3 3, 0, 1 2, -3, 2 -5, 0, 4 -4, -2, -5 2, 4, 1 33 45 20 5 22 10 17 41 45 21 -3.5, 2, -0.5

55
Asynchronous Optimization Example population If a worker requests work, create a new individual using mutation or recombination (for GS). worker 1 ? Work Request worker 2 ? worker 3 -5, 2, 5? Mutation -5, 2, -2 -2, 4, -5 -4, -2, 0 2, -1, 0 2, 3, -3 3, 0, 1 2, -3, 2 -5, 0, 4 -4, -2, -5 2, 4, 1 33 45 20 5 22 10 17 41 45 21 -0.5, -1, -2 -3.5, 2, -0.5

56
Asynchronous Optimization Example population When a worker completes calculating the fitness and reports the result, insert it into the population. worker 1 ? Report Result worker 2 5.25 worker 3 -5, 2, 5? -5, 2, -2 -2, 4, -5 -4, -2, 0 2, -1, 0 2, 3, -3 3, 0, 1 2, -3, 2 -5, 0, 4 -4, -2, -5 2, 4, 1 33 45 20 5 22 10 17 41 45 21 -0.5, -1, -2 -3.5, 2, -0.5

57
Asynchronous Optimization Example populationworker 1 ? Insert worker 2 5.25 worker 3 -5, 2, 5? -5, 2, -2 -2, 4, -5 -4, -2, 0 2, -1, 0 2, 3, -3 3, 0, 1 2, -3, 2 -5, 0, 4 -4, -2, -5 2, 4, 1 33 45 20 5 22 10 17 41 45 21 -0.5, -1, -2 -3.5, 2, -0.5 Perform an in-order insert and remove the worst member of the population. Remove

58
Asynchronous Optimization Example populationworker 1 ? worker 2 ? worker 3 -5, 2, 5? -5, 2, -2 -2, 4, -5 -4, -2, 0 2, -1, 0 2, 3, -3 3, 0, 1 2, -3, 2 -5, 0, 4 2, 4, 1 33 45 20 5 22 10 17 41 21 ? -3.5, 2, -0.5 Selection is done by keeping a fixed size population and only inserting results that improve it. 5.25-0.5, -1, -2

59
Asynchronous Optimization Example populationworker 1 ? worker 2 ? worker 3 -5, 2, 5? -5, 2, -2 -2, 4, -5 -4, -2, 0 2, -1, 0 2, 3, -3 3, 0, 1 2, -3, 2 -5, 0, 4 2, 4, 1 33 45 20 5 22 10 17 41 21 ? -3.5, 2, -0.5 If a worker fails or leaves we can continue the optimization without stopping. 5.25-0.5, -1, -2

60
Asynchronous Optimization Example population worker 2 ? worker 3 -5, 2, 5? -5, 2, -2 -2, 4, -5 -4, -2, 0 2, -1, 0 2, 3, -3 3, 0, 1 2, -3, 2 -5, 0, 4 2, 4, 1 33 45 20 5 22 10 17 41 21 ? 5.25-0.5, -1, -2 Workers can join and leave at any time. 2, 0, -0.5? Work Request Recombination worker 4

61
Asynchronous Optimization Example population worker 2 ? worker 3 -5, 2, 5? -5, 2, -2 -2, 4, -5 -4, -2, 0 2, -1, 0 2, 3, -3 3, 0, 1 2, -3, 2 -5, 0, 4 2, 4, 1 33 45 20 5 22 10 17 41 21 ? 5.25-0.5, -1, -2 Workers can join and leave at any time. 2, 0, -0.5? Work Request Mutation worker 4 2, -1, -3? worker 5

62
Asynchronous Optimization Example population worker 2 ? worker 3 -5, 2, 554 -5, 2, -2 -2, 4, -5 -4, -2, 0 2, -1, 0 2, 3, -3 3, 0, 1 2, -3, 2 -5, 0, 4 2, 4, 1 33 45 20 5 22 10 17 41 21 ? 5.25-0.5, -1, -2 If a reported result will not improve the population, simply discard it (selection). 2, 0, -0.5? worker 4 2, -1, -3? worker 5 Report Result
. 2, 0, worker 4 2, -1, -3. worker 5 Report Result.")
63
Asynchronous Optimization Example population worker 2 ? worker 3 ?? -5, 2, -2 -2, 4, -5 -4, -2, 0 2, -1, 0 2, 3, -3 3, 0, 1 2, -3, 2 -5, 0, 4 2, 4, 1 33 45 20 5 22 10 17 41 21 ? 5.25-0.5, -1, -2 If a reported result will not improve the population, simply discard it (selection). 2, 0, -0.5? worker 4 2, -1, -3? worker 5 Discard Result
. 2, 0, worker 4 2, -1, -3. worker 5 Discard Result.")
64
Asynchronous Optimization Example population worker 2 ? worker 3 ? ? Fast workers do not need to wait for slow workers and the search can continue to progress without them. 2, 0, -0.5? worker 4 2, -1, -3? worker 5 Work Request Recombination 0, 1.5, -2.5 -5, 2, -2 -2, 4, -5 -4, -2, 0 2, -1, 0 2, 3, -3 3, 0, 1 2, -3, 2 -5, 0, 4 2, 4, 1 33 45 20 5 22 10 17 41 21 5.25-0.5, -1, -2

65
Asynchronous Optimization Example population worker 2 ? worker 3 8.5 ? Fast workers do not need to wait for slow workers and the search can continue to progress without them. 2, 0, -0.5? worker 4 2, -1, -3? worker 5 Report Result 0, 1.5, -2.5 -5, 2, -2 -2, 4, -5 -4, -2, 0 2, -1, 0 2, 3, -3 3, 0, 1 2, -3, 2 -5, 0, 4 2, 4, 1 33 45 20 5 22 10 17 41 21 5.25-0.5, -1, -2

66
Asynchronous Optimization Example population worker 2 ? worker 3 ? ? Fast workers do not need to wait for slow workers and the search can continue to progress without them. 2, 0, -0.5? worker 4 2, -1, -3? worker 5 Insert Result ? -5, 2, -2 -4, -2, 0 2, -1, 0 2, 3, -3 3, 0, 1 2, -3, 2 -5, 0, 4 2, 4, 1 33 20 5 22 10 17 41 21 5.25-0.5, -1, -2 8.50, 1.5, -2.5

67
Asynchronous optimization works in theory, but does it scale? How does it compare to an iterative approach? Asynchronous Optimization

68
Simulating Asynchronous Optimization

69
Simulation Architecture Population Fitness (1) Fitness (2) Fitness (n)...... Individual (1) Individual (2) Individual (n)...... Unevaluated Individuals Unevaluated Individual (1) Unevaluated Individual (2) Unevaluated Individual (n)...... Workers (Fitness Evaluation) Report results and update population Request Work Send Work Generate individuals when queue is low Min Heap (Report Times) Remove result with minimum time and report Generate report time and insert into heap Request new work for each reported individual Initialize heap with results equal to number of workers 1 5 35208 4521367018 20 3 10 5 19 7 15
 Individual (2) Individual (n) Unevaluated Individuals Unevaluated Individual (1) Unevaluated Individual (2) Unevaluated Individual (n) Workers (Fitness Evaluation) Report results and update population Request Work Send Work Generate individuals when queue is low Min Heap (Report Times) Remove result with minimum time and report Generate report time and insert into heap Request new work for each reported individual Initialize heap with results equal to number of workers")
70
Test Functions

71
Courtsey of http://www-optima.amp.i.kyoto-u.ac.jp/member/student/hedar/Hedar_files/TestGO.htm Sphere Function

72
Courtsey of http://www-optima.amp.i.kyoto-u.ac.jp/member/student/hedar/Hedar_files/TestGO.htm Ackley Function

73
Courtsey of http://www-optima.amp.i.kyoto-u.ac.jp/member/student/hedar/Hedar_files/TestGO.htm Griewank Function

74
Courtsey of http://www-optima.amp.i.kyoto-u.ac.jp/member/student/hedar/Hedar_files/TestGO.htm Rastrigin Function

75
Courtesy of http://en.wikipedia.org/wiki/File:Rosenbrock_function.svghttp://en.wikipedia.org/wiki/File:Rosenbrock_function.svg Rosenbrock Function

76
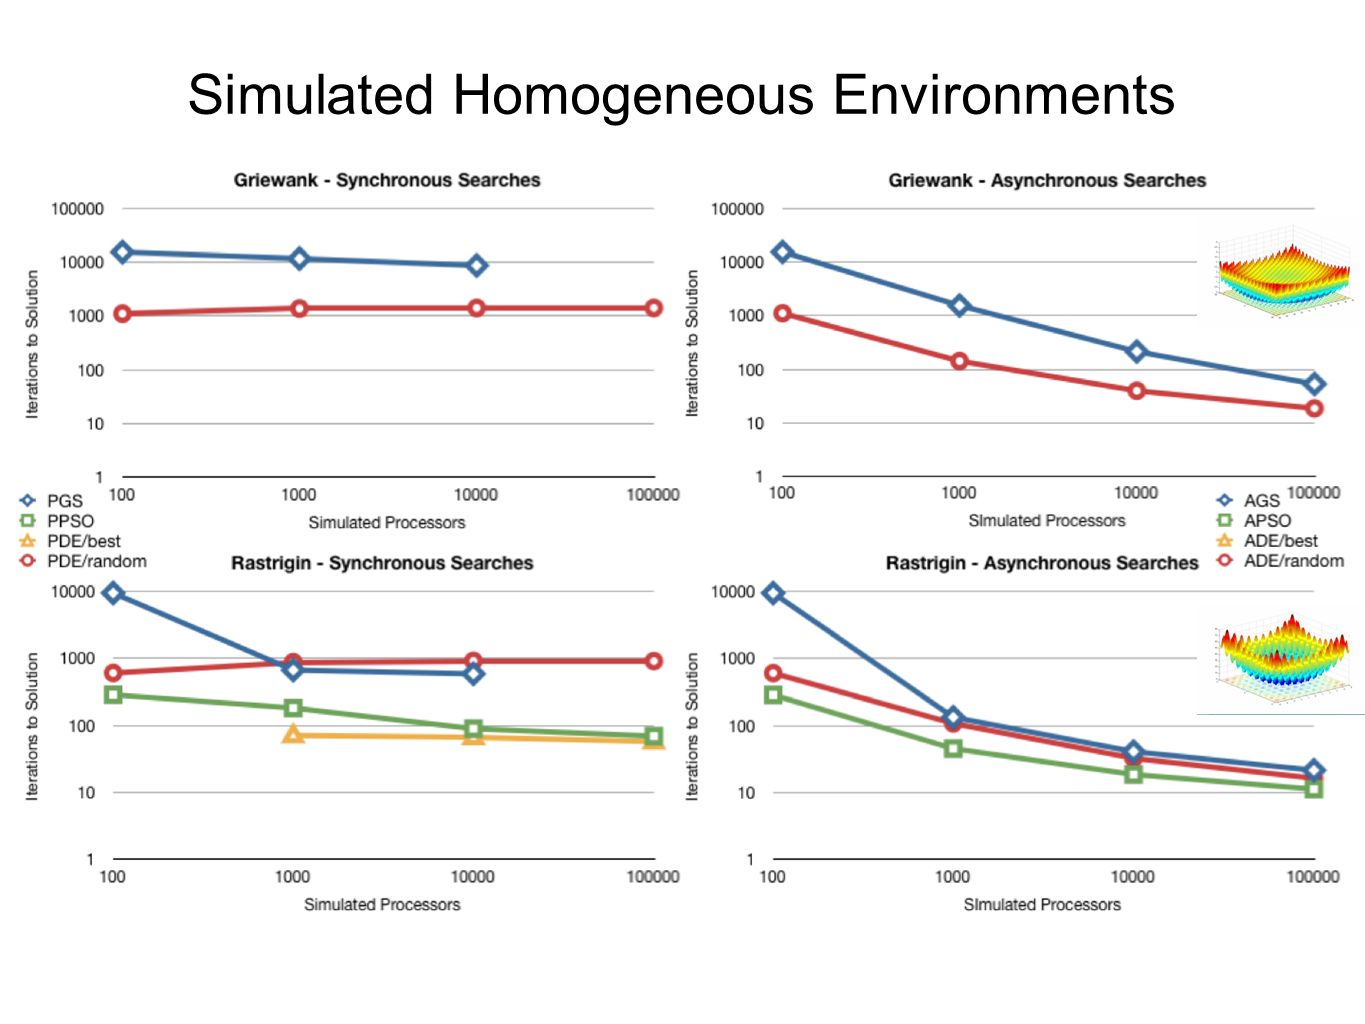
Traditional EA population size has to match number of processors. Asynchronous EAs can use a fixed population size (100). Use a fixed report time of 1, so all work is requested and sent out simultaneously. Simulating Homogeneous Environments
. Use a fixed report time of 1, so all work is requested and sent out simultaneously. Simulating Homogeneous Environments.")
77
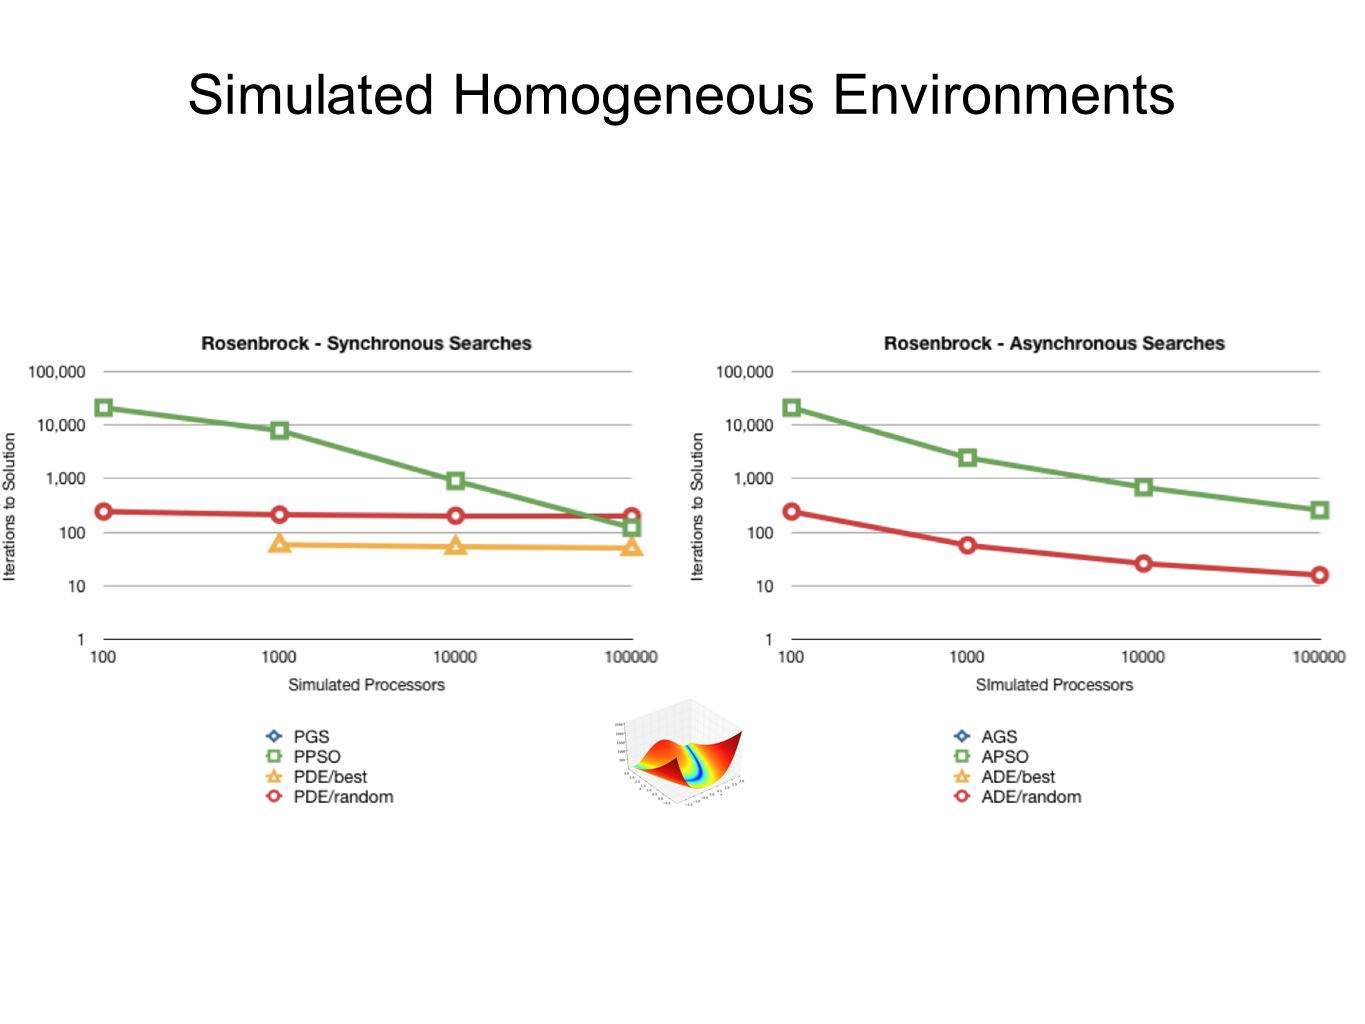
Simulated Homogeneous Environments

80
Simulating MilkyWay@Home

81
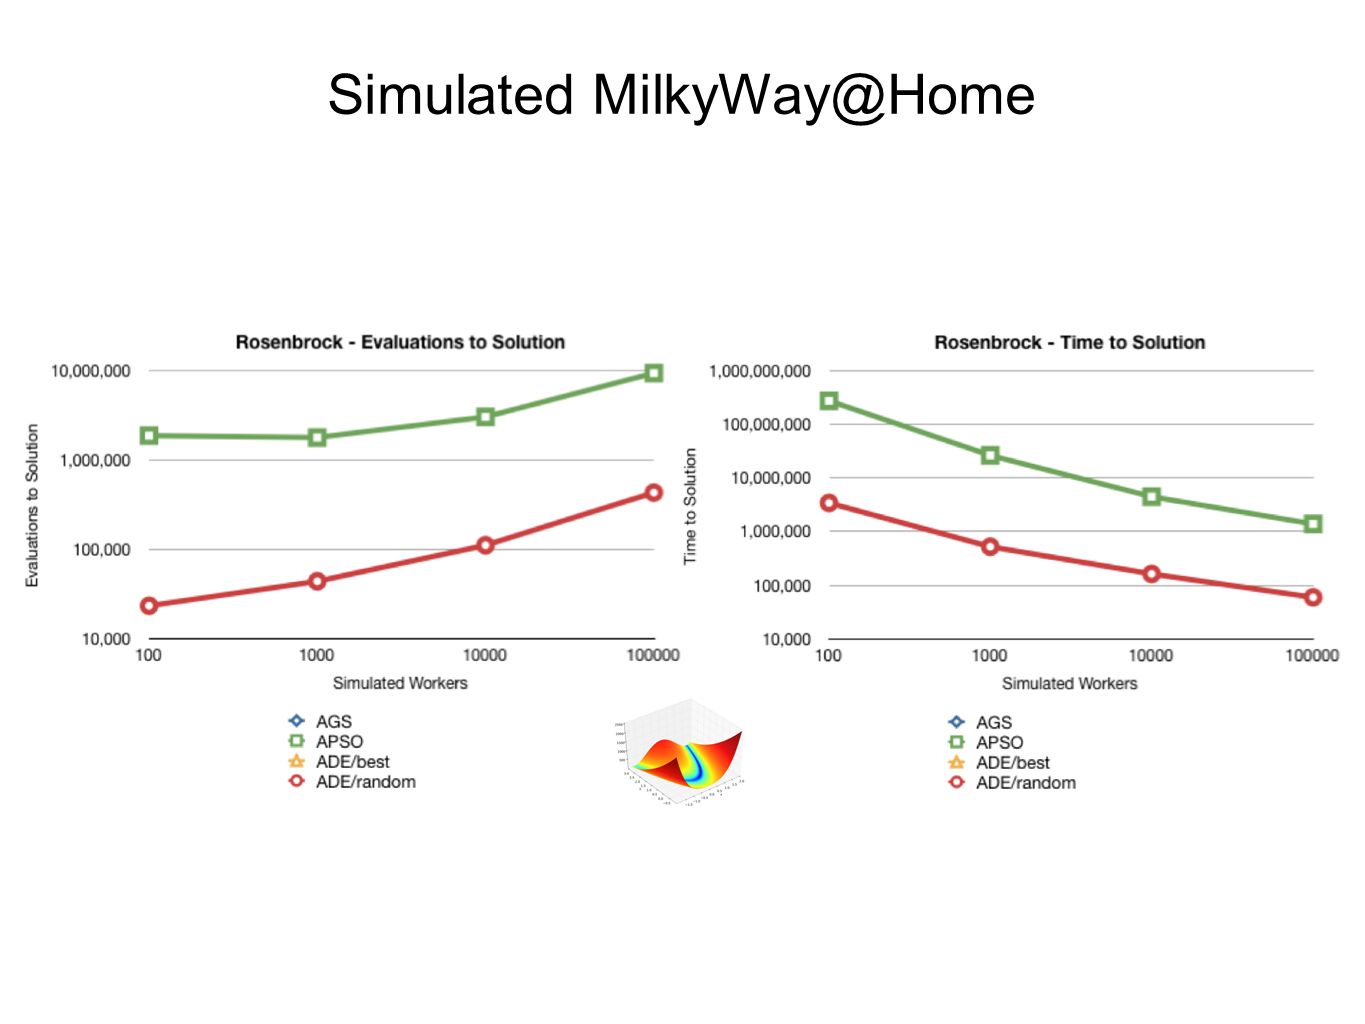
Simulated MilkyWay@Home

82
AGS didn’t work! ADE/best worked? Simulated MilkyWay@Home

84
Travis Desell, David P. Anderson, Malik Magdon-Ismail, Heidi Newberg, Boleslaw Szymanski and Carlos A. Varela. An Analysis of Massively Distributed Evolutionary Algorithms. In the Proceedings of the 2010 IEEE Congress on Evolutionary Computation (IEEE CEC 2010), Barcelona, Spain, July 2010. To Appear.An Analysis of Massively Distributed Evolutionary Algorithms Further Reading on Simulation Travis Desell. Asynchronous Global Optimization for Massive-Scale Computing. PhD thesis. Rensselaer Polytechnic Institute. 2009Asynchronous Global Optimization for Massive-Scale Computing
, Barcelona, Spain, July To Appear.An Analysis of Massively Distributed Evolutionary Algorithms Further Reading on Simulation Travis Desell. Asynchronous Global Optimization for Massive-Scale Computing. PhD thesis. Rensselaer Polytechnic Institute. 2009Asynchronous Global Optimization for Massive-Scale Computing.")
85
BOINC vs. BlueGene

86
Iterative GS on BlueGene

87
BOINC vs. BlueGene Asynchronous GS on BlueGene 1 1 Fitness evaluation was distributed over all 1000 cores -- only one worker

88
BOINC vs. BlueGene Asynchronous GS on BlueGene 12 1 Fitness evaluation was distributed over all 1000 cores -- only one worker 2 Used better recombination heuristic

89
BOINC vs. BlueGene Asynchronous GS on MilkyWay@Home 1 1 With approximately 5,000 workers

90
Asynchronous optimization is fault tolerant by design. Asynchronous optimization also scales where traditional methods fail. Asynchronous optimization can also be faster than traditional iterative searches. Results

91
BOINC verifies every work unit Only results that will be inserted into the population need to be verified Partial Verification: Ignore false-negatives (results that won’t be inserted) Verify results which potentially improve the search Handling Malicious Results with Verification
 Verify results which potentially improve the search Handling Malicious Results with Verification")
92
Unevaluated Individuals Unevaluated Individual (1) Unevaluated Individual (2) Unevaluated Individual (n)................ Workers (Fitness Evaluation) Remove verified results from queue and insert them into the population Request Work Send Work Generate new individuals when queue is low Population Fitness (1) Fitness (2) Fitness (n)...... Individual (1) Individual (2) Individual (n)...... Verification Queue Fitness (1) Fitness (2) Fitness (n)...... Individual (1) Individual (2) Individual (n)...... Insert result if it could improve population Resend individuals at a specified verification rate
 Remove verified results from queue and insert them into the population Request Work Send Work Generate new individuals when queue is low Population Fitness (1) Fitness (2) Fitness (n) Individual (1) Individual (2) Individual (n) Verification Queue Fitness (1) Fitness (2) Fitness (n) Individual (1) Individual (2) Individual (n) Insert result if it could improve population Resend individuals at a specified verification rate.")
93
Further Reading on Verification Travis Desell, Malik Magdon-Ismail, Boleslaw Szymanski, Carlos A. Varela, Heidi Newberg and David P. Anderson. Validating Evolutionary Algorithms on Volunteer Computing Grids. In the Proceedings of the 10th IFIP International Conference on Distributed Applications and Interoperable Systems (DAIS 2010), Amsterdam, Netherlands, June 2010.Validating Evolutionary Algorithms on Volunteer Computing Grids
, Amsterdam, Netherlands, June 2010.Validating Evolutionary Algorithms on Volunteer Computing Grids.")
94
Questions?

95
Thanks! http://www.cs.rpi.edu/~deselt/ http://milkyway.cs.rpi.edu/ http://dnahome.cs.rpi.edu/tp://dnahome.cs.rpi.edu/ deselt@cs.rpi.edu
96
96 November 19, 2009 Particle Swarm Optimization Particles ‘fly’ around the search space. Move according to their previous velocity and are pulled towards the global best found position and their locally best found position. Analogies: cognitive intelligence (local best knowledge) social intelligence (global best knowledge) 96
 social intelligence (global best knowledge) 96.")
97
97 November 19, 2009 Particle Swarm Optimization (Example) 97 previous: p i (t-1) current: p i (t) local best global best c 1 * (l i - p i (t)) c 2 * (g - p i (t)) w * v i (t) velocity: v i (t) possible new positions
 97 previous: p i (t-1) current: p i (t) local best global best c 1 * (l i - p i (t)) c 2 * (g - p i (t)) w * v i (t) velocity: v i (t) possible new positions")
98
98 November 19, 2009 Particle Swarm Optimization (Example) 98 previous: p i (t-1) current: p i (t) local best global best c 1 * (l i - p i (t)) c 2 * (g - p i (t)) w * v i (t) velocity: v i (t) possible new positions
 98 previous: p i (t-1) current: p i (t) local best global best c 1 * (l i - p i (t)) c 2 * (g - p i (t)) w * v i (t) velocity: v i (t) possible new positions")
99
99 November 19, 2009 Particle Swarm Optimization (Example) 99 previous: p i (t-1) current: p i (t) local best global best c 2 * (g - p i (t)) w * v i (t) velocity: v i (t) possible new positions Particle finds a new local best position
 99 previous: p i (t-1) current: p i (t) local best global best c 2 * (g - p i (t)) w * v i (t) velocity: v i (t) possible new positions Particle finds a new local best position")
100
100 November 19, 2009 Particle Swarm Optimization (Example) 100 previous: p i (t-1) current: p i (t) local best global best c 2 * (g - p i (t)) w * v i (t) velocity: v i (t) possible new positions c 1 * (l i - p i (t))
 100 previous: p i (t-1) current: p i (t) local best global best c 2 * (g - p i (t)) w * v i (t) velocity: v i (t) possible new positions c 1 * (l i - p i (t))")
101
101 November 19, 2009 Particle Swarm Optimization (Example) 101 previous: p i (t-1) current: p i (t) local best global best velocity: v i (t) new position Particle finds the global best position
 101 previous: p i (t-1) current: p i (t) local best global best velocity: v i (t) new position Particle finds the global best position")
102
102 November 19, 2009 Particle Swarm Optimization (Example) 102 c 2 * (g - p i (t)) w * v i (t) possible new positions c 1 * (l i - p i (t)) previous: p i (t-1) current: p i (t) local best global best velocity: v i (t) Another particle finds the global best position
 102 c 2 * (g - p i (t)) w * v i (t) possible new positions c 1 * (l i - p i (t)) previous: p i (t-1) current: p i (t) local best global best velocity: v i (t) Another particle finds the global best position")
103
103 November 19, 2009 Particle Swarm Optimization (details) PSO: v i (t+1) = w * v i (t) + c 1 * r 1 * (l i - p i (t)) + c 2 * r 2 * (g - p i (t)) p i (t+1) = p i (t) + v i (t+1) w, c 1, c 2 = constants r 1, r 2 = random float between 0 and 1 v i (t) = velocity of particle i at iteration t p i (t) = position of particle i at iteration t l i = best position found by particle i g = global best position found by all particles 103
 PSO: v i (t+1) = w * v i (t) + c 1 * r 1 * (l i - p i (t)) + c 2 * r 2 * (g - p i (t)) p i (t+1) = p i (t) + v i (t+1) w, c 1, c 2 = constants r 1, r 2 = random float between 0 and 1 v i (t) = velocity of particle i at iteration t p i (t) = position of particle i at iteration t l i = best position found by particle i g = global best position found by all particles 103")
104
104 November 19, 2009 Differential Evolution (In Brief) In general: Perform binary or exponential recombination between the current individual and another individual modified by a scaled difference between n pairs of other individuals 104 best/n/bin best/n/exp random/n/bin random/n/exp current/n/bin current/n/exp Parent SelectionNumber of PairsRecombination// Many Variations:
 In general: Perform binary or exponential recombination between the current individual and another individual modified by a scaled difference between n pairs of other individuals 104 best/n/bin best/n/exp random/n/bin random/n/exp current/n/bin current/n/exp Parent SelectionNumber of PairsRecombination// Many Variations:")
105
105 November 19, 2009 Differential Evolution (Example) 105 current: p i (t) pair 1 : r 1 parent: r 0 recombine(current, target) target: r 0 + c(r 1 - r 2 ) scaled differential: c(r 1 - r 2 ) pair 2 : r 2
 105 current: p i (t) pair 1 : r 1 parent: r 0 recombine(current, target) target: r 0 + c(r 1 - r 2 ) scaled differential: c(r 1 - r 2 ) pair 2 : r 2")
106
106 November 19, 2009 Differential Evolution (Details) p i,j (t) = j th parameter of i th member of population at iteration t g j = j th parameter of global best member at iteration t c = scaling factor r1, r2 = random int between 0 and population size, r 1 != r 2 r3 = random int between 0 and number of parameters r4 = random float between 0 and 1 cr = crossover rate 106 = g j (t) + c * (p r1,j (t) - p r2,j (t)) = p i,j (t) p i,j (t+1) DE (best/1/bin): if r3 == j or r4 < cr otherwise if f(p(t+1)) < f(p(t)) then p(t+1) = p(t)
 p i,j (t) = j th parameter of i th member of population at iteration t g j = j th parameter of global best member at iteration t c = scaling factor r1, r2 = random int between 0 and population size, r 1 != r 2 r3 = random int between 0 and number of parameters r4 = random float between 0 and 1 cr = crossover rate 106 = g j (t) + c * (p r1,j (t) - p r2,j (t)) = p i,j (t) p i,j (t+1) DE (best/1/bin): if r3 == j or r4 < cr otherwise if f(p(t+1)) < f(p(t)) then p(t+1) = p(t)")
Similar presentations


>")


>")
 2007 Google and are licensed under.>")