Download presentation
Presentation is loading. Please wait.

1
S3: Chapter 4 – Goodness of Fit and Contingency Tables Dr J Frost (jfrost@tiffin.kingston.sch.uk) www.drfrostmaths.com Last modified: 30 th August 2015

2
Testing a Model Going back to Chapter 1 of S1 (that chapter that every teacher skips), we had the idea of modelling: DataModel Simplifying assumptions e.g. Collected heights of people in the population Why might we want to use a model for a data? It often makes calculations from the data easier, e.g. for heights in the population, if we assume a Normal Distribution, we could then calculate probabilities of someone having a given height range. This might be difficult if we used the raw data. This chapter mostly concerns how well a chosen model fits the observed data. If our simplifying assumptions were justified, we should find the model is a good fit. ?

3
Expected Frequency vs Observed Frequencies Number123456 231525182118 20 I throw a die (which may be fair) 120 times and observe the counts of each possible number. An obvious thing we might want to do is hypothesise whether or not the die is fair based on the counts seen. We need some sensible way to measure the difference between the observed and expected frequencies. Why the squared? It ensures difference is positive. ?? ?? ?

4
Number123456 231525182118 20 Possible observed counts given that expected count is 20. Suppose we standardised this normal distribution (representing the possible observed frequencies for one particular outcome), so that 0 means the observed frequency is equal to the expected frequency, and that we square this random variable to ensure the difference is positive. Possible observed counts (now standardised and squared) i.e. possible deviation of the observed frequency from the expected frequency
, so that 0 means the observed frequency is equal to the expected frequency, and that we square this random variable to ensure the difference is positive. Possible observed counts (now standardised and squared) i.e. possible deviation of the observed frequency from the expected frequency.")
5
Degrees of Freedom Number123456 231525182118 So when in combining the normal distributions for each outcome to give some kind of total measure of possible deviation of observed frequencies from expected frequencies, it doesn’t make sense to add another normal distribution for the last outcome, because the observed frequency can’t actually vary! (which goes against the notion of a “random variable”) ?
 .")
6
Example: Hypothesis Testing Number123456 231525182118 20 Test, at the 5% significance level, whether or not the observed frequencies could be modelled by a discrete uniform distribution. Number123456Total 231525182118120 20 120 0.451.25 0.20.050.23.4 ? ? ? ? ? ? Critical region 5% 11.070 3.4

7
Test Your Understanding A 3-sided spinner is spun 150 times, and counts of the three outcomes are shown. Test, at the 1% significance level, whether or not spinner is fair. Number123Total 356055150 50 150 4.520.57 Number123Total Observed356055150 ?

8
Exercise 4A

9
General Method for Goodness of Fit We have so far tested against a discrete uniform distribution, but we can obviously test against any other distribution in exactly the same way.

10
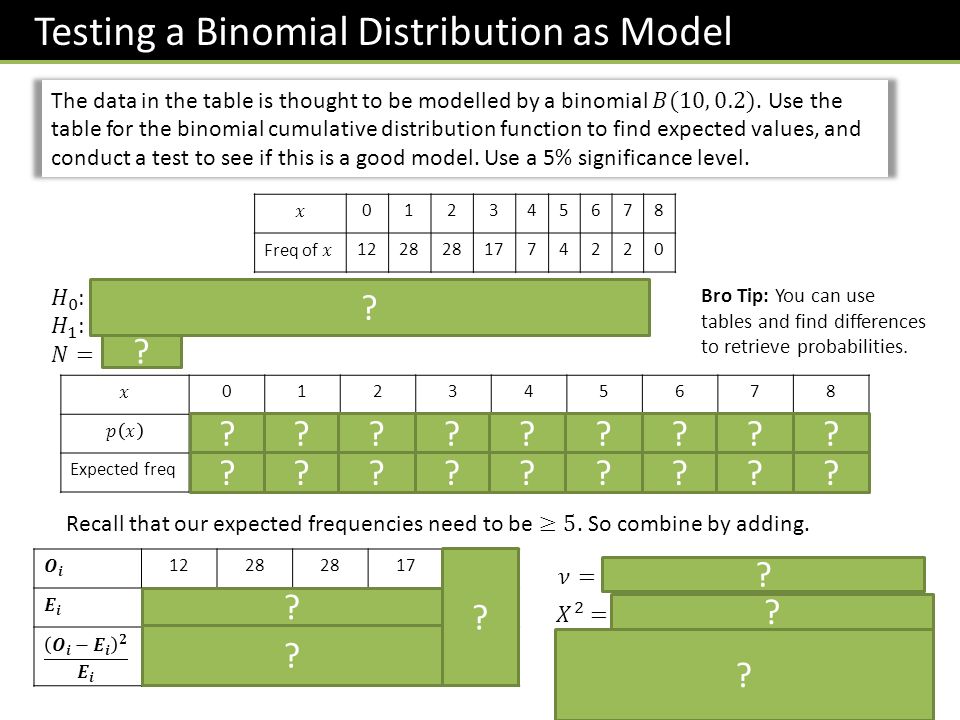
Testing a Binomial Distribution as Model 012345678 1228 1774220 012345678 0.10740.26840.30200.20130.08810.02640.00550.00080.0001 Expected freq10.7526.8430.2020.138.812.640.550.080.01 Bro Tip: You can use tables and find differences to retrieve probabilities. 1228 1715 10.7426.8430.2020.1312.09 0.14780.05010.16030.48670.7004 ? ? ????????? ????????? ? ? ? ? ? ?
11
A study of the number of girls in families with five children was done on 100 such families. The results are summarised in the following table. Test, at the 5% significance level, whether or not a binomial distribution is a good model. 012345 13183820101 012345 0.07910.26140.34560.22850.07550.0099 7.9126.1434.5622.857.550.99 0123>3Total 1318382011 7.9126.1434.5622.858.54 21.3712.3941.7817.5114.17107.22 ? ? ? ? ? ? ? ? ? ?

12
012 325 0123 41510 ? ? ? ?

13
Test Ye Understanding S3 May 2012 Q6 ? ?

14
Testing a Poisson Distribution as Model The numbers of telephone calls arriving at an exchange in six-minute periods were recorded over a period of 8 hours, with the following results. Can these results be modelled by a Poisson distribution? Test at the 5% significance level. 012345678 819261375110 00.1108 10.243819.504 20.268121.448 30.196615.728 40.10828.656 50.04763.808 60.01741.392 0.00750.6 080.0842 11919.5040.0130 22621.4480.9661 31315.7280.4732 478.6560.3168 73.8080.2483 ? ? ? ? ?? ? ? ?? Just 1- the rest. ? ?

15
Exercise 4B

16
Goodness of Fit Tests for Continuous Distributions We might want to test how our data fits a normal distribution. ? ? ?

17
Example During observations on the height of 200 male students the following data were observed: a.Test at the 0.05 level to see if the height of male students could be modelled by a normal distribution with mean 172 and standard deviation 6. b.Describe how you would modify this test if the mean and variance were unknown. Height (cm)150-154155-159160-164165-169170-174175-179180-184185-189190-194 Freq461230645218104 Notice that by calculating the z- probability for the upper bound each time, we can reuse it as the lower bound in the next range. ? ? ? ? ? ? ? ? ? ? ? ? ? ?
 Freq Notice that by calculating the z- probability for the upper bound each time, we can reuse it as the lower bound in the next range. .")
18
Example During observations on the height of 200 male students the following data were observed: a.Test at the 0.05 level to see if the height of male students could be modelled by a normal distribution with mean 172 and standard deviation 6. b.Describe how you would modify this test if the mean and variance were unknown. ? Height (cm)150-154155-159160-164165-169170-174175-179180-184185-189190-194 Freq461230645218104
 Freq")
19
Test Your Understanding June 2013 Q4 a ? b ? c ? (Note that this table does NOT have gaps)
")
20
Continuous Uniform Distribution ?

21
Example Question In a study on the habits of a flock of starlings, the direction in which they headed when they left their roost in the mornings was recorded over 240 days. The direction was found by recording if they headed between certain features of the landscape. The compass bearings of these features were than measured. The results are given below. Suggest a suitable distribution, and test to see if the data supports this model. Direction (degrees) Frequency Why possibly suitable ? ? ? ? ? ??? ???
 Frequency Why possibly suitable")
22
Test Your Understanding June 2010 Q6 ?

23
Exercise 4C

24
Contingency Tables Grade Totals School18122050 26123270 Totals442452120 So far, we have repeated a single event to get counts, e.g. throwing a single die multiple times, or in this case sampling grades from a single school and taking counts of each grade. We then determined how well this fit a particular distribution (uniform, binomial, etc.)
.")
25
Contingency Tables Grade Totals School18122050 26123270 Totals442452120 ? i.e. there is not any association between the two criterion Determine to the 5% significance level whether school and grade are dependent. ? ?

26
Grade Totals School18122050 26123270 Totals442452120 Contingency Tables Grade Totals School50 70 Totals442452120 Expected Frequencies ? ? ? ? ? ?

27
Contingency Tables Grade Totals School18122050 26123270 Totals442452120 ? ?

28
Contingency Tables 1818.3317.676 1210.0014.4 2021.6718.46 2625.6726.334 1214.0010.286 3230.3333.76 ? ? ?

29
Test Your Understanding June 2010 Q5 ?

30
Exercise 4D Question 4 onwards.

Similar presentations
 2.Divide the range of possible values for the test.>")


>")


