Download presentation
Presentation is loading. Please wait.

1
Community Colleges in US Higher Education Thomas Bailey, Director Community College Research Center Teachers College, Columbia University How might the changing labour market transform higher education? OECD Expert Meeting February 13, 2007 Paris, France

2
For more information: Please visit us on the web at http://ccrc.tc.columbia.edu, http://ccrc.tc.columbia.edu where you can download presentations, reports, CCRC Briefs, and sign-up for news announcements. CCRC is funded in part by: Alfred P. Sloan foundation, Lumina Foundation for Education, The Ford Foundation National Science Foundation (NSF), Institute of Education Sciences of the U.S. Department of Education Community College Research Center Institute on Education and the Economy, Teachers College, Columbia University 525 West 120th Street, Box 174, New York, NY 10027 E-mail: ccrc@columbia.educcrc@columbia.edu Telephone: 212.678.3091
, Institute of Education Sciences of the U.S. Department of Education Community College Research Center Institute on Education and the Economy, Teachers College, Columbia University 525 West 120th Street, Box 174, New York, NY Telephone:")
3
International Context Dramatic growth of post-secondary education in most countries, resulting from growing and changing requirements for learning Much of that growth in sub-university or middle sector In most countries, these per student costs in this sector are lower than the university sector These sectors have many advantagescost, serving different needs and different students Potential disadvantages, particularly relating to opportunity and equity

4
Examples Community collegesUS and Canada FachhochschulenGermany and Austria Institutes Universitaires de Technologie France (Technical and) Further Education Colleges(Australia) and the UK HogscholenNetherlands Others in Finland and Norway
 Further Education Colleges(Australia) and the UK HogscholenNetherlands Others in Finland and Norway")
5
Many Issues Institutional relationship between middle and university sector (ie. transfer?) Substantive content of each Relative costs and relative tuition Balance between broad educational and focused trade school missions Characteristics and goals of students
 Substantive content of each Relative costs and relative tuition Balance between broad educational and focused trade school missions Characteristics and goals of students.")
6
Structure of US HE Majority of students in public institutions Hierarchy of institutions –Sub-two-year institutionsprivate –Community collegesmostly public –Lower tier four-year collegespublic and private –Prestigious research universitiespublic and private DegreesGraduate, Bachelors, AA, Certificate, non-credit

7
Fall Headcount: 1970 to 2000 0 1,000,000 2,000,000 3,000,000 4,000,000 5,000,000 6,000,000 7,000,000 1970- 71 1972- 73 1974- 75 1976- 77 1978- 79 1980- 81 1982- 83 1984- 85 1986- 87 1988- 89 1990- 91 1992- 93 1994- 95 1996- 97 1998- 99 2000- 01 Source: U.S. Department of Education. (2002). Digest of Education Statistics. Public four-year Private four-year Public two-year Private two-year
. Digest of Education Statistics. Public four-year Private four-year Public two-year Private two-year.")
8
Enrollment based on different definitions Source: U.S. Department of Education. (2002). Digest of Education Statistics. U.S. Department of Education. (2002). IPEDS Fall Enrollment survey. (in thousands)
. Digest of Education Statistics. U.S. Department of Education. (2002). IPEDS Fall Enrollment survey. (in thousands).")
9
To Which Field of Study? Source: BPS89.

10
Current Fund Expenditures (per student, 1995-96) Source: U.S. Department of Education. (2002). Digest of Education Statistics.
. Digest of Education Statistics..")
11
Tuition (2001-2002) InstitutionTuition Private Four-year$16,287 Public Four-year$3,746 Public Two-year$1,379
 InstitutionTuition Private Four-year$16,287 Public Four-year$3,746 Public Two-year$1,379")
12
States with the Largest and Smallest Two-Year Enrollment Five states with most CC students Four-yearTwo-year 1) California551,8711,375,900 2) Texas436,530460,004 3) Illinois193,783340,372 4) Florida238,189318,723 5) New York336,003247,414 Five states with fewest CC students Four-yearTwo-year 46) West Virginia69,9676,169 47) Montana32,0595,328 48) South Dakota29,8824,975 49) Vermont15,6094,412 50) Alaska25,3961,163 0.17 0.28 0.05 1.34 0.74 0.09 to four-year PublicRatio of two-year PublicRatio of two-year to four-year 2.49 1.05 1.76 Source: U.S. Department of Education. (2002). Digest of Education Statistics. (Fall 2000)
. Digest of Education Statistics. (Fall 2000).")
13
Summary CCs account for 40-50 percent of PS enrollments CCs have much lower costs and much lower tuition The majority of students in community colleges are in occupational programs Structure of PS sector varies by state

14
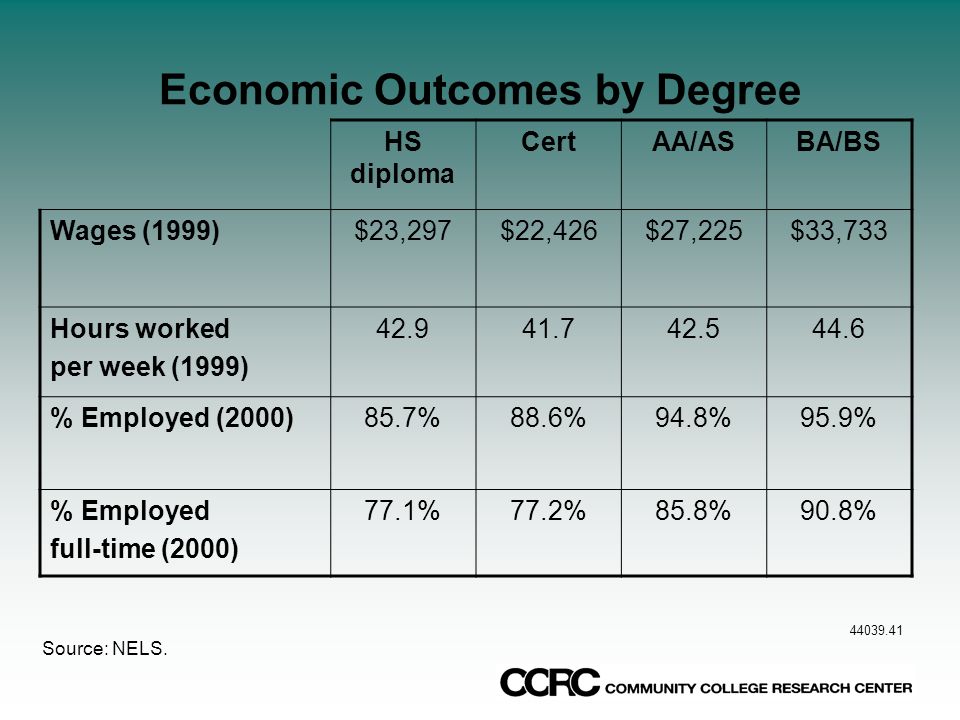
Economic Outcomes by Degree HS diploma CertAA/ASBA/BS Wages (1999)$23,297$22,426$27,225$33,733 Hours worked per week (1999) 42.941.742.544.6 % Employed (2000)85.7%88.6%94.8%95.9% % Employed full-time (2000) 77.1%77.2%85.8%90.8% Source: NELS. 44039.41
15
Economic Value of CC Education Benefits of an Associate Degree (compared to a HS degree) Men earn 15 to 30 percent more Women earn up to 50 percent more Certificates Positive for women Uncertain for men Earnings benefit of an associate degree is at least half of the benefit of a BA
 Men earn 15 to 30 percent more Women earn up to 50 percent more Certificates Positive for women Uncertain for men Earnings benefit of an associate degree is at least half of the benefit of a BA")
16
Summary AAs and BAs have economic value CC education, on a per year or per course basis, has as high a payoff as BA education (at least so far) Certificates have uncertain value and rarely serve as lower rungs of educational ladders Education without degrees has value, but degrees have more value
 Certificates have uncertain value and rarely serve as lower rungs of educational ladders Education without degrees has value, but degrees have more value")
17
Providers of Non-Credit Job-Related Education (1999) Elementary school, junior HS, or HS4.3% Public community colleges6.5% 4-year college or university12.4% Private vocational school9.6% Adult learning center1.3% Business or industry38.1% Professional assoc./labor union10.8% Government agency & public library11.9% Community, religious, or other org.5.1% Total number of students:53,600,000 Source: NHES99
 Elementary school, junior HS, or HS4.3% Public community colleges6.5% 4-year college or university12.4% Private vocational school9.6% Adult learning center1.3% Business or industry38.1% Professional assoc./labor union10.8% Government agency & public library11.9% Community, religious, or other org.5.1% Total number of students:53,600,000 Source: NHES99")
18
High School Completion and Initial Postsecondary Enrollment Eighth Graders in 1988

19
High School Completion and Initial Postsecondary Education by SES Quartile Eighth Graders in 1988

20
Community Colleges and Access Compared to Students in BA Programs DimensionMain Characteristics DemographicsOlder & Minority Program of studyOccupational IntensityPart-time & Part-year Reasons for enrolling Job skills Self perceptionWorker in college Family backgroundLow SES & First-generation High school background Low rank & scores Source: NPSAS96; BPS89; NELS88

21
Percent Distribution by Total Credits Earned in All PSE within Eight Years by Initial Institution Type

22
CC First PSE Students Percent Distribution by Highest Outcome in All PSE within Eight Years (NELS)
")
23
CC First PSE Students in Various Groups Percent Distribution by Highest Outcome in All PSE within Eight Years (NELS)
")
24
Grubb and Sweet Emulate universities Collaborate with universities Develop a distinctive role independent of universities Providers of training at the sub-tertiary level

Similar presentations


 Grants Chapter 6.>")