Download presentation
Presentation is loading. Please wait.

1
Epidemic Intelligence: Signals from surveillance systems EpiTrain III – Jurmala, August 2006 Anne Mazick, Statens Serum Institut, Denmark

2
Epidemic intelligence All the activities related to early identification of potential health threats their verification, assessment and investigation in order to recommend public health measures to control them.

4
Early warning Response Components & core functions

5
Indicator vs. Event-based surveillance Indicator-based surveillance –computation of indicators upon which unusual disease patterns to investigate are detected (number of cases, rates, proportion of strains…) Event-based surveillance –the detection of public health events based on the capture of ad-hoc unstructured reports issued by formal or informal sources.
 Event-based surveillance –the detection of public health events based on the capture of ad-hoc unstructured reports issued by formal or informal sources..")
6
Scope of this presentation What surveillance signals are required for EI –Current communicable disease surveillance –Additional more sensitive surveillance for new, unusual or epidemic disease occurence Basic requirements for signal detection Use of early warning surveillance systems 3 examples

7
Indicator-based early warning systems Objectives to early identify potential health threats - alone or in concert with other sources of EI in order to recommend public health measures to control them For new, emerging diseases For unusual or epidemic occurence of known diseases

8
Indicator-based surveillance Identified risks –Mandatory notifications –Laboratory surveillance Emerging risks –Syndromic surveillance –Mortality monitoring –Health care activity monitoring –Prescription monitoring Non-health care based –Poison centers –Behavioural surveillance –Environmental surveillance –Veterinary surveillance –Food safety/Water supply –Drug post-licensing monitoring

9
Current surveillance systems for communicable diseases Main attributes –Representativity –Completeness –Predictive positive value sensitivity specificity

10
From infection to detection Proportion of infections detected 1000 Shigella infections (100%) 50 Shigella notifications (5%) sensitivity specificity
 50 Shigella notifications (5%) sensitivity specificity")
11
time From infection to detection: Timeliness Analyse Interpret Signal

12
time From infection to detection: Timeliness Analyse Interpret Signal Urge doctors to report timely Frequency of reporting Immediately, daily, weekly

13
time From infection to detection: Timeliness Analyse Interpret Signal

14
time From infection to detection: Timeliness Automated analysis, thresholds Signal Automated analysis, thresholds Signal

15
time Potential sources of early signals Laboratory test volume Emergency & primary care total patient volume, syndromes Ambulance dispatches Over-the-counter medication sales Health care hotline School absenteeism Sensitive systems for new, unusual or epidemic diseases

16
To detect all events as early as possible More sensitive case definitions –Cave: sensitivity = false alerts costs of response Social and political distress Combining information from other sources of epidemic intelligence Frequency of reporting Automated analysis Low alert thresholds

17
Current surveillance systems for communicable diseases Important source for EI, but… Additional systems needed to fulfil all EI objectives: Timeliness Sensitivity For rapid detection of new, unusual or epidemic diseases

18
Principle of signal detection To detect excess over the normally expected Observed – expected = system alert What are we measuring? Indicators What is expected? Need historical data Which statistics to use? Depends on disease Where to set threshold? Depends on desired sensitivity

19
Early warning indicators –Count –Rates Number of cases/population at risk/time –Proportional morbidity % of ILI consultations among all consultations –Percentage of specific cases case fatality ratio % children under 1 years among measles cases % of cases with certain strain

20
Statistical methods for early warning Depends on the epidemiology of the disease under surveillance

21
Thresholds Choice of threshold affected by –Objectives, epidemiology, interventions Absolute value –Count: 1 case of AFP –Rate: > 2 meningo. meningitis/100,000/52 weeks Relative increase –2 fold increase over 3 weeks Statistical cut-off –> 90 th percentile of historical data –> 1.64 standard deviations from historical mean –Time series analysis

22
Clinical meningitis, Kara Region, Togo 1997

23
Weekly Notification of Food Borne Illness, National EWARN System, France,1994- 1998 95 96 97 98 37501124375011243750112437501124 0- 5- 10- 15- 20- 25- Week

26
Use of statistics & computer tools For systematic review of data on a regular basis to extract significant changes drowned in routine tables of weekly data They do not on its own detect and confirm outbreaks! Epidemiological verification, interpretation and assessment ALWAYS required!

27
Tools do not make early warning systems, but early warning systems need appropriate tools

28
System alert interpretation Every system alert Alert No Alert Validate & analyse Media reports Rumours Clinician concern Laboratories Food agencies Meteorological data Drug sales/prescription International networks EWRS Interpret Public health significance? Other sources of epidemic intelligence Signal

29
Danish laboratory surveillance system of enteric bacterial pathogens To detect outbreaks and to analyse long- term trends Administered by Statens Serum Insitute (SSI) Danish reference laboratory –Receives all salmonella isolates for further typing –Also gets many other strains, including E. coli., for further typing

30
National register of enteric pathogens At SSI Includes everybody who test positive for a bacterial GI infection in Dk. Person, county, agent, date of lab receiving specimen, travel, no clinical information First-positives only Mandatory weekly notifications from all 13 clinical laboratories

31
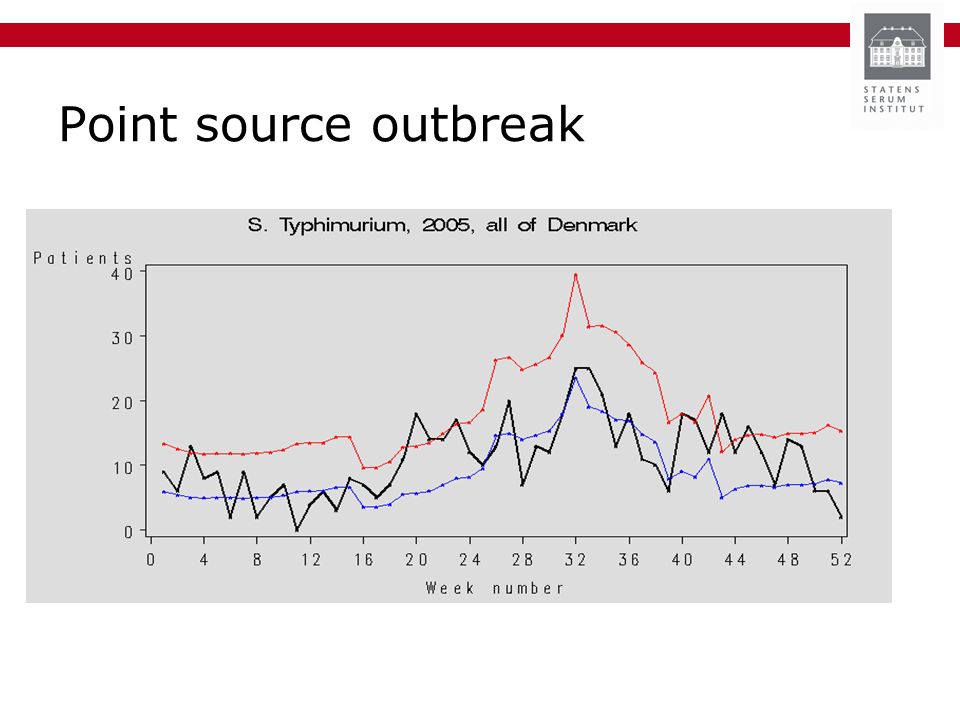
Outbreak algorithm Computer program, which calculates if the current number of patients exceeds what we saw at the same time of year in the 5 previous years Time variable: date of lab receiving specimen Calculation made each week for specimens received in the week before last Calculation made by county and nationally Adjustment for season, long-term trends and past outbreaks Uses poisson regression, principle developed by Farrington and friends

32
Current week & 35 past weeks Present counts are compared to the counts in 7 weeks in each of the past 5 years 2004

33
Output Each week the output is assessed by an epidemiologist Alerts thought to represent real outbreaks are analysed further Website www.mave-tarm.dkwww.mave-tarm.dk

35
Point source outbreak

37
Usefulness: Widespread outbreak

38
S. Oranienburg outbreak Hypothesis generating interviews (7 cases) All had eaten a particular chokolade from a german retail store Outbreak in Germany (400 cases) –Case-control study pointed to chokolade –But the particular chokolade was very popular in Germany (not in Denmark) Same DNA-profil Werber et al. BMC Infectious Diseases 5 7 (2005)
 All had eaten a particular chokolade from a german retail store Outbreak in Germany (400 cases) –Case-control study pointed to chokolade –But the particular chokolade was very popular in Germany (not in Denmark) Same DNA-profil Werber et al. BMC Infectious Diseases 5 7 (2005).")
39
What is the most useful? Systematic weekly analysis Defines expected levels Good to detect widespread outbreaks with scattered cases Good use of advanced lab typing method

40
Early warning signals from mortality surveillance Excess deaths due to known disease under surveillance –Increased incidence –Increased virulence due to disease/threats not under surveillance –Known diseases –New, emerging threats –Environmental threats –Deliberate release

41
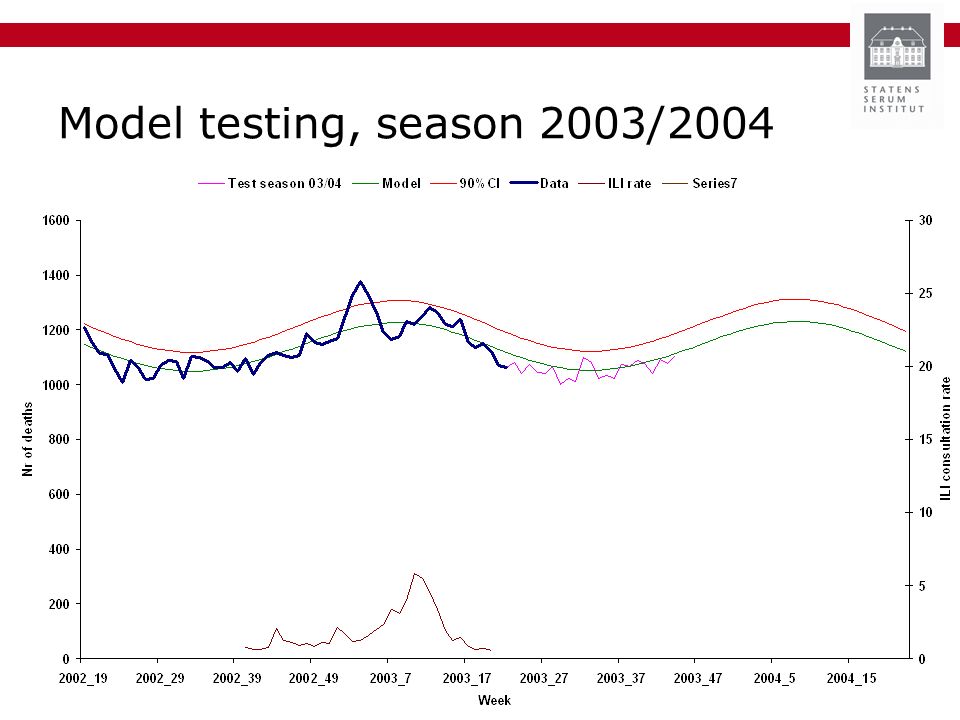
Would mortality surveillance been of use in 2003/04 to assess the impact of Fujian influenza on children in Denmark? Absence of signal –Reassurance of public

42
All-cause deaths and influenza like illness (ILI) consultation rate, 1998-2004, Denmark Period of model fittingForecast
 consultation rate, , Denmark Period of model fittingForecast")
43
Observed and expected all-cause deaths, 1998-2004, Denmark, Excess mortality

44
Model testing, season 2003/2004

46
Signal Media reports Community concern Rumours Clinician concern disease surveillance (flu, meningitis etc) meteorological office -……
 meteorological office -……")
47
Model testing, season 2003/2004 Signal

48
Observed and expected number of death among children (1-15y), Denmark, 1998-2004
, Denmark,")
49
Model testing, season 2003/2004

50
Evaluation of early warning and response systems Important: –usefulness has not been established –investigating false alarms is costly CDC tool for evaluation of surveillance systems for early detection of outbreaks

51
Early warning system in Serbia ALERT implemented 2002 To strenghten early detection of outbreaks of epidemic prone and emerging infectious diseases –11 syndromes to detect priority communicable diseases –All primary health facilities report weekly aggregated data –Complements routine surveillance of individual confirmed cases

52
Evaluation of ALERT 2003 ALERT detected outbreaks more timely than the routine systems but ALERT did not detect all outbreaks –Missed clusters of brucellosis and tularaemia ALERT procedures & response not regulated by law Investigation and verification process that follows system alerts and signals not fully understood Recommendations –Add data source (eg emergency wards) to increase sensitivity –Better integration with routine system –Change in surveillance perspective requires TRAINING! Valenciano et al, Euro surv 2004; 9(5);1-2
;1-2.")
53
Useful links CDC. Framework for evaluating public health surveillance systems for early detection of outbreaks. http://www.cdc.gov/mmwr/preview/mmwrhtml/rr53 05a1.htm http://www.cdc.gov/mmwr/preview/mmwrhtml/rr53 05a1.htm Annotated Bibliography for Syndromic Surveillance http://www.cdc.gov/EPO/dphsi/syndromic/index.htm http://www.cdc.gov/EPO/dphsi/syndromic/index.htm The RODS Open Source Project, Open Source Outbreak and Disease Surveillance Software http://openrods.sourceforge.net/ http://openrods.sourceforge.net/

Similar presentations


 Betty C. Jung, RN, MPH, CHES.>")


