Download presentation
Presentation is loading. Please wait.

2
It’s Time To See How Much You Know About …

3
Let’s See What You Know About… IUPUI student profiles Student progress and academic success Study habits Commitments, expectations, goals, and needs Living arrangements

4
How to Score Yourself Scoring sheet has a place for you to indicate your answer to each question Score 1 point for an exactly correct answer Otherwise, give yourself a big fat goose egg (0)
")
5
Ground Rules There are no life lines All answers ARE your final answer You’ve got nothing to lose (or win for that matter) Here we go…
 Here we go…")
6
Now holding steady… 1.What percent of IUPUI undergraduates are age 25 or older? 1.17% 2.27% 3.37% 4.47% 5.57% Student Profile

7
0% 25% 50% 75% 100% 19971998199920002001200220032004 Percent of IUPUI Undergraduates Age 25 or Older Age Trend of IUPUI Undergraduates 41% 40% 38% 37%

8
IUPUI Student Segments Source: IMIR Continuing Student Satisfactions and Priorities Survey 1995 2003 Part-Time w/Partner or Children Part-Time w/Partner or Children 34% 22% Full-Time Older Full-Time Older 21% Full-Time Trad. Age (17-22) Full-Time Trad. Age (17-22) 22% 40% Part-Time Unattached Part-Time Unattached 23% 17%
 Full-Time Trad. Age (17-22) 22% 40% Part-Time Unattached Part-Time Unattached 23% 17%.")
9
1 in 6 2.What percent of IUPUI students represent ethnic/racial minority groups? a)11% b)16% c)21% d)26% e)31% Student Profile
11% b)16% c)21% d)26% e)31% Student Profile.")
10
Racial/Ethnic Minorities Fall 2005 Enrolled Undergraduates N% Bloomington29,5623,049 10% IUPUI21,4383,338 16% East2,392142 6% Fort Wayne6,057608 10% Kokomo2,737164 6% Northwest4,3871,570 36% South Bend6,324719 11% Southeast5,300340 6% IUPUI/Regional Total48,6356,88114% Racial/Ethnic MinoritiesTotal Ugrads 0%10%20%30%40%

11
That is, more than 2/3 do not Mode of Entry 3.What percentage of all new students at IUPUI enter as fall semester full-time beginners? a)35% b)45% c)55% d)65% e)75%
35% b)45% c)55% d)65% e)75%.")
12
Mode of Entry for New Students Calendar Year 2003 Fall First-Time, Full-Time Freshmen 35% Transfers - 51%Beginners - 49% All Other First-Time Freshmen 14% External Transfers 35% Intercampus Transfer 16%

13
Vast majority! 4.What percent of IUPUI undergraduates are Indiana residents? a)67% b)78% c)89% d)97% Undergraduate Resident Status Fall 2005 Enrolled Undergraduates
67% b)78% c)89% d)97% Undergraduate Resident Status Fall 2005 Enrolled Undergraduates.")
14
Two out of three 5.What percentage of full-time beginners at IUPUI return for their second year of classes? a)56% b)65% c)66% d)69% e)74% Student Progress Fall 2004 Entering Cohort-PRELIMINARY RATE!
56% b)65% c)66% d)69% e)74% Student Progress Fall 2004 Entering Cohort-PRELIMINARY RATE!.")
15
One Year Retention Rate of First-Time Full-Time, Fall Beginners CampusCohort NRate Bloomington6,745 88% IUPUI2,343 66% East319 56% Fort Wayne706 65% Kokomo383 58% Northwest662 60% South Bend707 66% Southeast675 66% IUPUI/Regionals5,795 64% 0%25%50%75%100% Fall 2003 Entering Cohort FT Freshman Retention Rate

16
One Year Retention Rate of First-Time Full-Time, Fall Beginners CampusCohort NRate Bloomington6,309 87% -1 IUPUI2,302 65% -1 East274 54% -2 Fort WayneNot readily available Kokomo358 56% -2 Northwest605 58% -2 South Bend695 64% -2 Southeast715 65% -1 Fall 2004 Entering Cohort-PRELIMINARY RATES! FT Freshman Retention Rate

17
Trend in IUPUI FTB Retention 50% 55% 60% 65% 70% 75% 199819992000200120022003 Fall Semester of Entry

18
This is significant! 6.Compared to students that do not participate in First-Year Seminars, how much higher is the retention rate for those who do participate? a)1% b)5% c)8% d)11% IUPUI First-Year Seminar Impact on One-Year Retention
1% b)5% c)8% d)11% IUPUI First-Year Seminar Impact on One-Year Retention.")
19
Fall 2003 Impact of Participation in a First-Year Seminar on One-Year Retention First-Year Seminar NRetention Rate Adjusted Retention Non- Participants 46159%61% Participants128570%69% Overall174667%

20
Not even 1 of 4! 7.What percentage of full-time beginners at IUPUI and the IU regional campuses graduate from any IU campus within six years? a)23% b)28% c)33% d)38% e)43% Student Progress
23% b)28% c)33% d)38% e)43% Student Progress.")
21
Freshman 6-Year Graduation Rate Six Year Graduation Rate of First-Time Full-Time, Fall Beginners CampusCohort NRate Bloomington6,745 71% IUPUI2,343 23% East319 17% Fort Wayne706 27% Kokomo383 25% Northwest662 27% South Bend707 24% Southeast675 28% IUPUI/Regionals5,795 25% 0%25%50%75%100% Fall 1998 Entering Cohort

22
Peer Institution Retention/Graduation Rates

23
They say! You wish! 8.For every hour of class, How many hours do full-time freshman report that they spend studying or preparing outside class? a)1 b)1.5 c)2 d)2.5 e)3 Student Habits
1 b)1.5 c)2 d)2.5 e)3 Student Habits.")
24
Freshman Study Habits

25
Full-Time Freshman Use of Time 01020304050607080 IUB IUPUI East Kokomo Northwest Southeast Hours in ClassPreparing for class Participating in co-curricular activitiesRelaxing and socializing Commuting to classWorking for pay on campus Working for pay off campusProviding care for dependents living with you

26
Not as much as we would like! Undergraduate Study Habits 9.On average how many hours per week do undergraduates study outside of class? a)7 b)12 c)23 d)31 Source: IMIR 2005 Continuing Student Satisfactions and Priorities Survey
7 b)12 c)23 d)31 Source: IMIR 2005 Continuing Student Satisfactions and Priorities Survey.")
27
Undergraduate Study Habits On average, how many hours per week do you study outside of class? MeanSTD25%'ileMedian75%'ile 12.110.45.010.016.0 N% 0-5 32325% 6-10 43334% 11-1520116% 16-2016713% 21-30 1149% >30544% Average hours studied per week by credit hours: Credit Hours Studied HourMeanSTD 1 - 3 6.95.9 3.5 - 6 9.98.5 6.5 - 9 11.09.8 9.5 - 12 12.310.4 12.5 - 15 13.810.4 15.5 - 22 12.913.1 Source: IMIR 2005 Continuing Student Satisfactions and Priorities Survey

28
UCOL Study Habits On average, how many hours per week do you study outside of class? MeanSTD25%'ileMedian75%'ile 11.910.75.010.017.8 N% 0-5 3427% 6-10 4133% 11-151713% 16-202016% 21-30 97% >3054% Average hours studied per week by credit hours: Credit Hours Studied HoursMeanSTD 1 - 3 4.83.7 3.5 - 6 9.16.6 6.5 - 9 13.310.8 9.5 - 12 11.911.3 12.5 - 15 12.78.8 15.5 - 22 13.621.1 Source: IMIR 2005 Continuing Student Satisfactions and Priorities Survey

29
Finally! 10.Do more IUPUI students come from the top 10% of their H.S. Class or the bottom 33%? a)top 10% b)bottom 33% c)about the same Academic Background
top 10% b)bottom 33% c)about the same Academic Background.")
30
High School Class Rank 0% 5% 10% 15% 20% 25% 30% 199920002001200220032004 Top 10% Students Bottom 33% Students

31
Would you believe it? 11.What percent of IUPUI undergraduates work for pay off- campus? a)41% b)53% c)65% d)70% e)91% Commitments
41% b)53% c)65% d)70% e)91% Commitments.")
32
No kidding 12.Among those who work for pay, how many hours per week do they average? a)15 b)20 c)25 d)29 e)35 Commitments
15 b)20 c)25 d)29 e)35 Commitments.")
33
Work Commitments of IUPUI Undergraduates Are you currently working for pay on-campus? N% Yes25119% No106381% Are you currently working for pay off-campus? N% Yes91470% No39030% Source: IMIR 2005 Continuing Student Satisfactions and Priorities Survey

34
Work Commitments of IUPUI Undergraduates How many hours per week on average do you work for pay? MeanSTD25%'ileMedian75%'ile 29.313.720.030.040.0 N% 1-1517717% 16-2527326% 26-34 14714% 35-40 30129% > 4014314% How many jobs are you currently holding? N% 184681% 217417% 3 or more 232% Source: IMIR 2005 Continuing Student Satisfactions and Priorities Survey

35
Work Commitments of IUPUI Undergraduates Which of the following describes your history regarding on-campus employment? N% I have never attempted to find an on-campus job 62973% Tried to find an on-campus job - never been successful 13516% I have worked on campus, but I am not now 10012% Source: IMIR 2005 Continuing Student Satisfactions and Priorities Survey

36
Work Commitments of UCOL Undergraduates Are you currently working for pay on-campus? N% Yes2217% No10683% Are you currently working for pay off-campus? N% Yes9071% No3729% Source: IMIR 2005 Continuing Student Satisfactions and Priorities Survey

37
Work Commitments of UCOL Undergraduates How many hours per week on average do you work for pay? MeanSTD 25%'ile Median75%'ile 28.613.320.030.040.0 N% 1-151919% 16-252626% 26-34 1212% 35-40 3232% > 401111% How many jobs are you currently holding? N% 1 85 83% 21616% 3 or more 11% Source: IMIR 2005 Continuing Student Satisfactions and Priorities Survey

38
A lot of mouths to feed 13.What percent of students have children? a)7 b)17 c)21 d)27 e)35 Commitments
7 b)17 c)21 d)27 e)35 Commitments.")
39
Family Commitments of IUPUI Undergraduates Marital Status N% Single87166% Married32925% Sep/W/D 1139% Do you live with a spouse or partner? N% Yes47536% No83964% Do you have children at home? N% Yes35227% No96373% Source: IMIR 2005 Continuing Student Satisfactions and Priorities Survey

40
Family Commitments of UCOL Undergraduates Marital Status N% Single9372% Married2519% Sep/W/D 119% Do you live with a spouse or partner? N% Yes3527% No9473% Do you have children at home? N% Yes3326% No9674% Source: IMIR 2005 Continuing Student Satisfactions and Priorities Survey

41
Better than it used to be... 14.What percent of IUPUI full-time, fall beginning freshmen attain a GPA below 2.00 in their first semester? a)7% b)12% c)17% d)22% e)27% First Year Grade Performance
7% b)12% c)17% d)22% e)27% First Year Grade Performance.")
42
FT Beginners with GPA < 2.00 27% 36% 29% 26% 0% 10% 20% 30% 40% 50% 1998199920002001200220032004 Fall Semester of Entry

43
First-Year Retention Rate by GPA 0% 20% 40% 60% 80% 100% 199819992000200120022003 Fall Semester of Entry 87% 85% 84% 85% 83% 84% 3.00-4.00 69% 74% 77% 75% 69% 2.00-2.99 24% 28% 27% 30% 27% 31% < 2.00

44
Can you believe it? 15.What percent of IUPUI first-time freshmen expect to receive higher grades in their first semester of college than they received in high school? a)7% b)27% c)37% d)57% e)77% Expectations
7% b)27% c)37% d)57% e)77% Expectations.")
45
Expected Grades by H.S. Grades

46
Surprise? 16.What percent of senior students/faculty report that their courses often or very often require memorizing facts, ideas, or methods, so you/students can repeat them in pretty much the same form? a)25/25 b)25/60 c)60/25 d)60/60 Differences in Student and Faculty Perceptions
25/25 b)25/60 c)60/25 d)60/60 Differences in Student and Faculty Perceptions.")
48
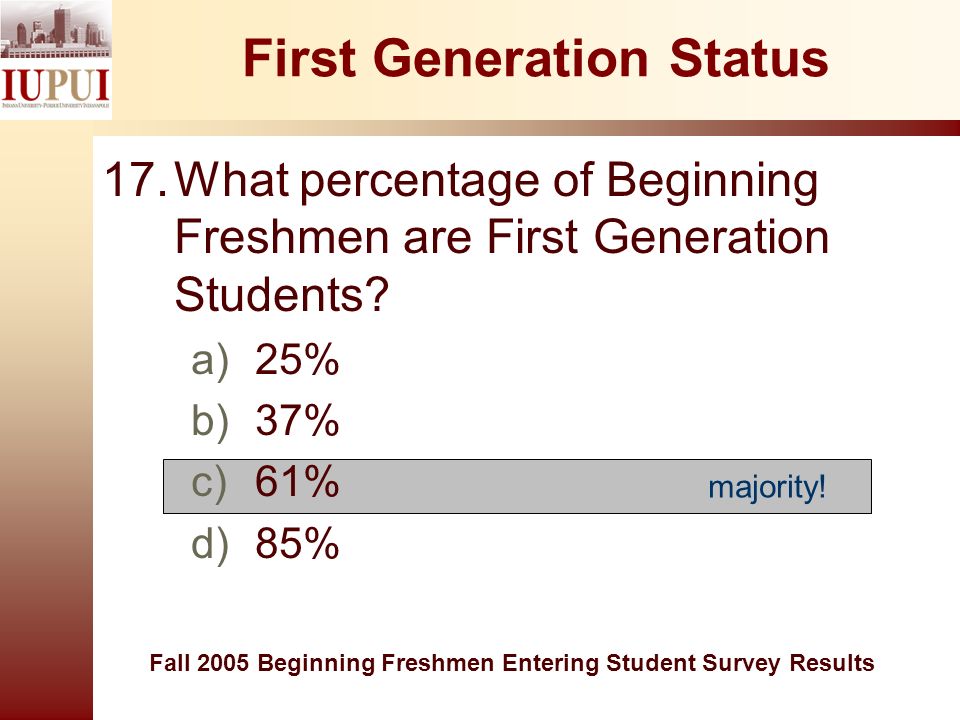
majority! 17.What percentage of Beginning Freshmen are First Generation Students? a)25% b)37% c)61% d)85% First Generation Status Fall 2005 Beginning Freshmen Entering Student Survey Results
25% b)37% c)61% d)85% First Generation Status Fall 2005 Beginning Freshmen Entering Student Survey Results.")
49
Can you believe it? Financial Aid Applications 18.What percentage of students reported that they applied for financial aid? a)45% b)60% c)71% d)90% Fall 2005 Beginning Freshmen Entering Student Survey Results
45% b)60% c)71% d)90% Fall 2005 Beginning Freshmen Entering Student Survey Results.")
50
Surprise? 19.What percentage of students reported they applied to another college or university other than IUPUI? a)25% b)40% c)52% d)85% Applying to IUPUI Fall 2005 Beginning Freshmen Entering Student Survey Results
25% b)40% c)52% d)85% Applying to IUPUI Fall 2005 Beginning Freshmen Entering Student Survey Results.")
51
WOW! 20.If applied to other universities, what percentage reported that IUPUI was their First choice? a)15% b)25% c)55% d)63% College Choice Fall 2005 Beginning Freshmen Entering Student Survey Results
15% b)25% c)55% d)63% College Choice Fall 2005 Beginning Freshmen Entering Student Survey Results.")
52
86% 21.Which of the following had the highest percentage of students reporting current educational goal? a)Earn at least two-year (associate’s) degree b)Earn at least four-year (bachelor’s) degree c)Take course for personal interest d)Take course for prof. dev. in current job e)Take course to explore career options f)Not sure Educational Goal Fall 2005 Beginning Freshmen Entering Student Survey Results
Earn at least two-year (associate’s) degree b)Earn at least four-year (bachelor’s) degree c)Take course for personal interest d)Take course for prof. dev. in current job e)Take course to explore career options f)Not sure Educational Goal Fall 2005 Beginning Freshmen Entering Student Survey Results.")
53
Educational Goal Earn at least four-year (bachelor’s) degree 86% Earn at least two-year (associate’s) degree 8% Take course to explore career options3% Not sure3% Take course for prof. dev. in current job.07% Take course for personal interest.03% Fall 2005 Beginning Freshmen Entering Student Survey Results

54
Can you believe it? Educational Goal 22.What percent of undergraduates intend to complete their college degree at IUPUI? a)27% b)45% c)56% d)78% e)94% Source: IMIR 2005 Continuing Student Satisfactions and Priorities Survey
27% b)45% c)56% d)78% e)94% Source: IMIR 2005 Continuing Student Satisfactions and Priorities Survey.")
55
ambitious! Educational Goal 23.What percent of undergraduates expect to enroll for a more advanced degree when they graduate? a)12% b)26% c)38% d)61% e)77% Source: IMIR 2005 Continuing Student Satisfactions and Priorities Survey
12% b)26% c)38% d)61% e)77% Source: IMIR 2005 Continuing Student Satisfactions and Priorities Survey.")
56
1998 Cohort Educational Goal Source: IMIR 1998 Continuing Student Satisfactions and Priorities Survey Do you intend to complete your college degree program at IUPUI? N% Yes 92292% No 838% When you graduate, do you expect to enroll for a more advanced degree? N% Yes 56459% No 39241%

57
2005 UCOL Educational Goal Source: IMIR 2005 Continuing Student Satisfactions and Priorities Survey Do you intend to complete your college degree program at IUPUI? N% Yes 11891% No 119% When you graduate, do you expect to enroll for a more advanced degree? N % Yes 7458% No 5342%

58
Reasons for Attending College 24.What was the most important reason affecting decision to attend college? a)Acquire knowledge and skills applicable to a specific job or type of work b)Fulfill a lifelong goal c)Make more money d)Meet new people e)My parents wanted me to go Fall 2005 Beginning Freshmen Entering Student Survey Results
Acquire knowledge and skills applicable to a specific job or type of work b)Fulfill a lifelong goal c)Make more money d)Meet new people e)My parents wanted me to go Fall 2005 Beginning Freshmen Entering Student Survey Results.")
59
Reasons for Attending College 1.Acquire knowledge and skills applicable to a specific job or type of work 2.Fulfill a lifelong goal 3.Get a better job 4.Make more money 5.Gain a general education 6.Meet new people 7.Prepare for graduate or professional school 8.My parents wanted me to go 9.Change in financial situation 10.Advance in my current job 11.Issues related to children or childcare 12.Change in marital status (rank order by mean importance)
")
60
Reasons for Attending IUPUI 25.What was most important reason impacting decision to attend IUPUI? a)Cost b)Recommendation from family member c)Ability to work while attending college d)Availability of specific academic programs (majors) e)Location Fall 2005 Beginning Freshmen Entering Student Survey Results
Cost b)Recommendation from family member c)Ability to work while attending college d)Availability of specific academic programs (majors) e)Location Fall 2005 Beginning Freshmen Entering Student Survey Results.")
61
Top 10 Reasons 1.Availability of specific academic programs (majors) 2.Location 3.Opportunity to receive an Indiana University or Purdue University degree 4.Career and job opportunities available in the area after completing my degree 5.Ability to work while attending college 6.Cost 7.Admissions requirements 8.IUPUI's reputation 9.Opportunities associated with the location of IUPUI in Indianapolis 10.Ability to live at home while attending college (rank order by mean importance)
 2.Location 3.Opportunity to receive an Indiana University or Purdue University degree 4.Career and job opportunities available in the area after completing my degree 5.Ability to work while attending college 6.Cost 7.Admissions requirements 8.IUPUI s reputation 9.Opportunities associated with the location of IUPUI in Indianapolis 10.Ability to live at home while attending college (rank order by mean importance)")
62
Reasons Continued… 11.The variety of entertainment and social activities in the downtown area 12.Opportunity to interact with students from a wide variety of backgrounds 13.Opportunity to prepare to transfer to another college or university 14.Friends attending IUPUI 15.A scholarship offer 16.Recommendation of a family member 17.IUPUI accommodates the needs of adult learners 18.Social services (such as health care and child care) available in the area 19.The advice of my employer 20.A specific pre-college program, such as Upward Bound or SPAN (rank order by mean importance)
 available in the area 19.The advice of my employer 20.A specific pre-college program, such as Upward Bound or SPAN (rank order by mean importance)")
63
Vast majority! Computer Access 26.What percentage of students have access to a personal computer, either at home or work, that they can use for school work? a)50% b)74% c)83% d)95% Fall 2005 Beginning Freshmen Entering Student Survey Results
50% b)74% c)83% d)95% Fall 2005 Beginning Freshmen Entering Student Survey Results.")
64
Has increased! Campus Housing 27.What percentage of students live in a campus residence? a)2% b)7% c)15% d)21% e)30% Fall 2005 Beginning Freshmen Entering Student Survey Results
2% b)7% c)15% d)21% e)30% Fall 2005 Beginning Freshmen Entering Student Survey Results.")
65
Housing 1.House of apartment within driving distance = 73% 2.Campus residence = 21% 3.House of apartment within walking distance of campus = 6% Fall 2005 Beginning Freshmen Entering Student Survey Results

66
majority! Living Arrangements 28.What percentage of students live with family members (parents, spouse, children, or other relatives)? a)10% b)27% c)58% d)76% Fall 2005 Beginning Freshmen Entering Student Survey Results
. a)10% b)27% c)58% d)76% Fall 2005 Beginning Freshmen Entering Student Survey Results.")
67
Living Arrangements 1.With one or more roommates who are students attending IUPUI = 26% 2.Live alone = 11% 3.With others not attending this college = 5% Fall 2005 Beginning Freshmen Entering Student Survey Results

68
About 75% Incoming Students’ Needs 29.What is the “top” area that Fall Beginning students report needing help with? a)Financial Aid b)Math Skills c)Study Skills d)Finding Work e)Writing Skills
Financial Aid b)Math Skills c)Study Skills d)Finding Work e)Writing Skills.")
69
Report Needing Help With (Top 5 Areas)… 1.Financial Aid 2.Math Skills 3.Study Skills 4.Finding Work 5.Writing Skills Trend Based on Fall Beginning Freshmen Entering Student Survey Results
… 1.Financial Aid 2.Math Skills 3.Study Skills 4.Finding Work 5.Writing Skills Trend Based on Fall Beginning Freshmen Entering Student Survey Results")
70
Score Grade Interpreting Your Score 10 - 6You haven’t been paying much attention, have you? 25+Genius! You’ve made the student knowledge hall of fame 24-20Superior Intellect (or at least good observer) 19-16Above average Average15-11 < 5Remedial Math for you!
 19-16Above average Average15-11 < 5Remedial Math for you!.")
71
www.imir.iupui.edu

72
http://uc.iupui.edu/staff/research.asp

Similar presentations


 Activity Provider Emily Sellers » Indiana Commission for Higher Education February 26, 2015.>")