Download presentation
Presentation is loading. Please wait.

1
Visualizing Physical Geography Copyright © 2008 John Wiley and Sons Publishers Inc. Chapter 6 Weather Systems

2
Air Masses Air Mass: large body of air with fairly uniform temperature and moisture characteristics Source region: region where an air mass acquires its characteristics Air masses move in response to pressure gradients and upper-level wind patterns

3
Visualizing Physical Geography Copyright © 2008 John Wiley and Sons Publishers Inc. Air Masses North American Air Masses: cA—very cold, dry cP—cold, dry mP—cool, moist mT—warm, moist cT—hot, dry

4
Visualizing Physical Geography Copyright © 2008 John Wiley and Sons Publishers Inc. Air Masses Front: surface of contact between two unlike air masses

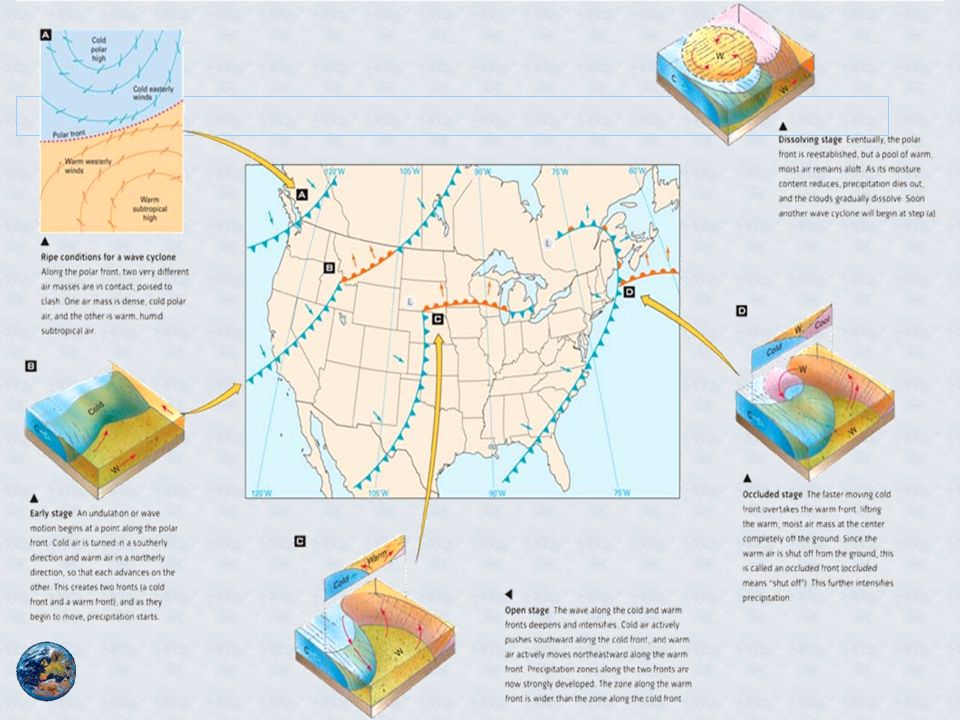
5
Visualizing Physical Geography Copyright © 2008 John Wiley and Sons Publishers Inc. Air Masses Cold, Warm, and Occluded Fronts Cold front: moving weather front along which a cold air mass moves underneath a warm air mass, lifting the warm air mass Cumulus and cumulonimbus clouds Thunderstorms Warm front: moving weather front along which a warm air mass slides over a cold air mass, producing stratiform clouds and precipitation Stratus, nimbostratus clouds Steady precipitation, sometimes thunderstorms

6
Visualizing Physical Geography Copyright © 2008 John Wiley and Sons Publishers Inc. Cold, Warm, and Occluded Fronts Occluded front: weather front along which a moving cold front overtakes a warm front, forcing the warm air mass aloft Stationary Front: two air masses are in contact, but there is little or no relative motion Air Masses

7
Visualizing Physical Geography Copyright © 2008 John Wiley and Sons Publishers Inc. Traveling Cyclones and Anticyclones Cyclonic storm: intense weather disturbance within a moving cyclone generating strong winds, cloudiness, and precipitation Three types of cyclones: 1.Wave cyclone midlatitudes, Arctic, Antarctic zones 2.Tropical cyclone tropical and subtropical zones 3.Tornado An anticyclone is a fair-weather system.

10
Visualizing Physical Geography Copyright © 2008 John Wiley and Sons Publishers Inc. Traveling Cyclones and Anticyclones The Tornado Tornado: small, very intense wind vortex with extremely low air pressure in the center, formed below a dense cumulonimbus cloud in proximity to a cold front Favorable conditions: cold front of mP air lifts mT air Tornados most frequent in U.S Wind speeds up to 100 m/s (225 mph).
..")
11
Visualizing Physical Geography Copyright © 2008 John Wiley and Sons Publishers Inc. Tropical and Equatorial Weather Systems Tropical Cyclones Hurricane in western hemisphere Typhoon in western Pacific Cyclone in Indian Ocean Develops over warm oceans High sea-surface temperatures--27º C (81º F) Develops between 8º to 15º N and S, not on equator Tropical cyclone: intense traveling cyclone of tropical and subtropical latitudes, accompanied by high winds and heavy rainfall Hurricane Katrina, 2005
 Develops between 8º to 15º N and S, not on equator Tropical cyclone: intense traveling cyclone of tropical and subtropical latitudes, accompanied by high winds and heavy rainfall Hurricane Katrina,")
12
Visualizing Physical Geography Copyright © 2008 John Wiley and Sons Publishers Inc. Tropical and Equatorial Weather Systems Tropical Cyclones Circular storm center Extremely low pressure (950 mb) Intense convergence and uplift Heavy rainfall Gains energy through release of latent heat Eye has clear skies and calm winds Wind speeds highest in eyewall
 Intense convergence and uplift Heavy rainfall Gains energy through release of latent heat Eye has clear skies and calm winds Wind speeds highest in eyewall.")
13
Visualizing Physical Geography Copyright © 2008 John Wiley and Sons Publishers Inc. Tropical and Equatorial Weather Systems Tropical Cyclones Always form over warm oceans; temperatures >26.5ºC Move towards west through trade-wind belt Usually occur late summer or early autumn; water temperatures are highest

14
Visualizing Physical Geography Copyright © 2008 John Wiley and Sons Publishers Inc. The intensity of storms increases when sea surface temperatures increase Tropical and Equatorial Weather Systems Hurricanes in 2005—most active year on record for Atlantic hurricanes

15
Visualizing Physical Geography Copyright © 2008 John Wiley and Sons Publishers Inc. Tropical and Equatorial Weather Systems Impacts of Tropical Cyclones Destruction from hurricanes: High winds Wave action Storm surge High rains and freshwater flooding Hurricane Andrew, Florida Hurricane Mitch, Honduras Storm surge: rapid rise of coastal water level accompanying the onshore arrival of a tropical cyclone

16
Visualizing Physical Geography Copyright © 2008 John Wiley and Sons Publishers Inc. Tropical and Equatorial Weather Systems Impacts of Tropical Cyclones Hurricane Katrina, 2005

17
Visualizing Physical Geography Copyright © 2008 John Wiley and Sons Publishers Inc. Cloud Cover, Precipitation, and Global Warming How global climate may be influenced by clouds and precipitation:

Similar presentations


 and the Tropic of Capricorn (23.5S) The weather is very different.>")


 having similar.>")

