Download presentation
Presentation is loading. Please wait.

2
Next on OPRAH – Bringing Data Out of the Closet Walter Giesbrecht, Data Librarian York University Jeff Moon, Head, Documents Unit Queen’s University OLA SuperConference Friday, 1 February, 2002

3
Not this Data …

4
… but these kinds!

5
Before we get all shaken up about data and statistics, with warnings that such and such a percent of people get such and such a disease after following such and such a personal habit... … it is useful to note that: 80% of those who go insane drink coffee, tea, or beer 98% of those who commit suicide sleep indoors and darned near 100% of those injured in traffic accidents are people who move from one place to another!

6
Let’s take a look at Data and Statistical Analysis… have you ever seen the movie “Twins”?

7
Think of “Arnie” as the “Data” continuum… Tables, Charts, Graphs (from books, journals, the web, etc...) A ‘number’ Raw Survey Data # French Mother Tongue (1996) in Ontario Employment levels by occupation class Annual inflation rate from 1914 to present Aggregate Data Microdata Coded responses of surveyed individuals
 A ‘number’ Raw Survey Data # French Mother Tongue (1996) in Ontario Employment levels by occupation class Annual inflation rate from 1914 to present Aggregate Data Microdata Coded responses of surveyed individuals")
8
Canada - Employment Telecommunication Equipment Industry 479,285 Aggregate Data: A Number Tables, Charts, GraphsTime Series

9
Sources of Aggregate Data… Statistics Canada is generally the first stop for Canadian Data: The Canada Year Book (print) The Daily (web) Canadian Social Trends (web/print) CANSIM / E-Stat (web) – time series… “Canadian Statistics” (web) Beyond 20/20 Files – multidimensional tables…
 The Daily (web) Canadian Social Trends (web/print) CANSIM / E-Stat (web) – time series… Canadian Statistics (web) Beyond 20/20 Files – multidimensional tables…")
10
Survey Data (microdata): Statistical analysis software is used to generate meaningful results… e.g. SPSS, SAS. “variables” “respondents”

11
Sources of Survey Data… Once again, Statistics Canada is generally the first stop for Canadian Data: The “Data Liberation Initiative” (DLI) provides access to hundreds of publicly released survey data files. Polling Companies (Environics, CROP, etc.) produce microdata files as well. For US & International data, the “Inter-university Consortium for Political & Social Research” (ICPSR)
 produce microdata files as well. For US & International data, the Inter-university Consortium for Political & Social Research (ICPSR).")
12
Survey Data Aggregate Data Postcard Camera “Fixed” “Flexible”

13
Think of “Danny” as the “Statistical Analysis” continuum… Percentages Counts Standard Deviations Tests of Significance Descriptive Statistics Averages Inferential Statistics

14
Significance testing PercentagesCountsStandard Deviations Averages Tables, Charts, Graphs A ‘number’ Raw Survey Data Data continuum… Statistical Analysis continuum… Aggregate / DescriptiveMicrodata / Inferential

15
To review… Data Aggregate & Survey Data (Microdata) Statistical Analysis Counts, Percentages, Averages, Standard Deviations, Cross- tabulations, t-tests, Regression, etc.
 Statistical Analysis Counts, Percentages, Averages, Standard Deviations, Cross- tabulations, t-tests, Regression, etc.")
16
Reference Question Example: How many of you have had a patron arrive at the Reference Desk with a newspaper article reporting Statistics Canada data?

17
Globe & Mail, Dec 17, 2001, p A15 “…71% of 15- to 17-year-olds use online chat rooms, double the proportion of the only slightly older 20- 24-year-olds.”

18
First, note that the article says: “Statistics Canada, in a study released last week…” So… where do you go from here?

19
First… Let’s try: http://www.statcan.ca/start.html

20
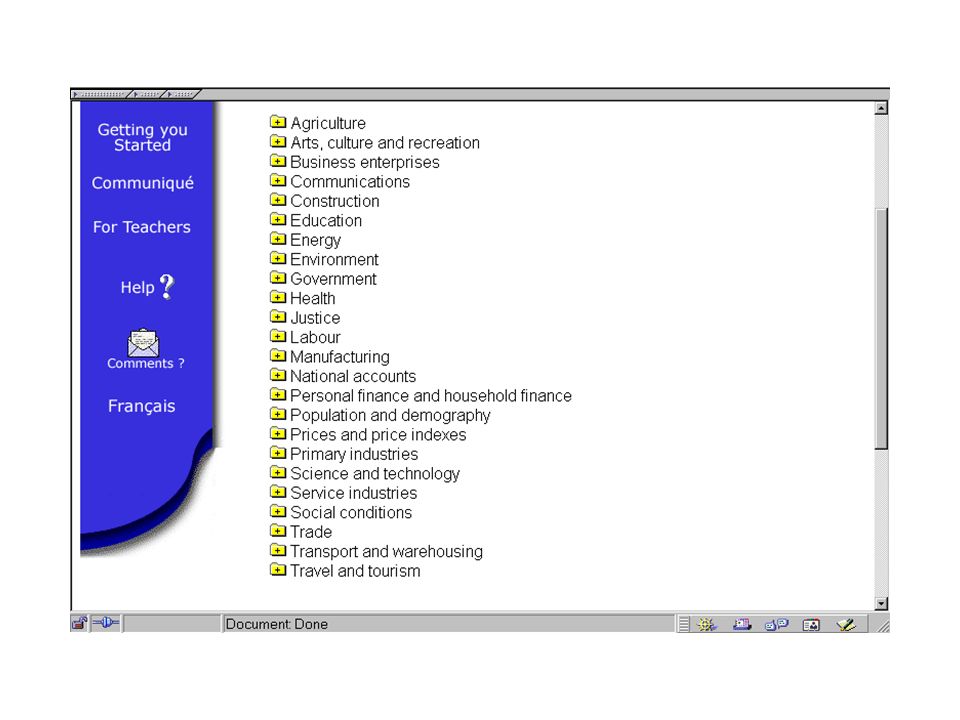
Which leads you to the following:

21
Canadian Social Trends, Winter 2001 Which leads, in turn to: Here is the statistic quoted in the Globe… and here is the source…

22
So… how do we check out this source? General Social Survey, 2000 DLI Web Site (or Local Data Centre) http://www.statcan.ca/english/Dli/dli.htm
")
24
Documentation and Data…

25
So… going to your campus “Data Centre” http://library.queensu.ca/webdoc/ssdc/key.htm

27
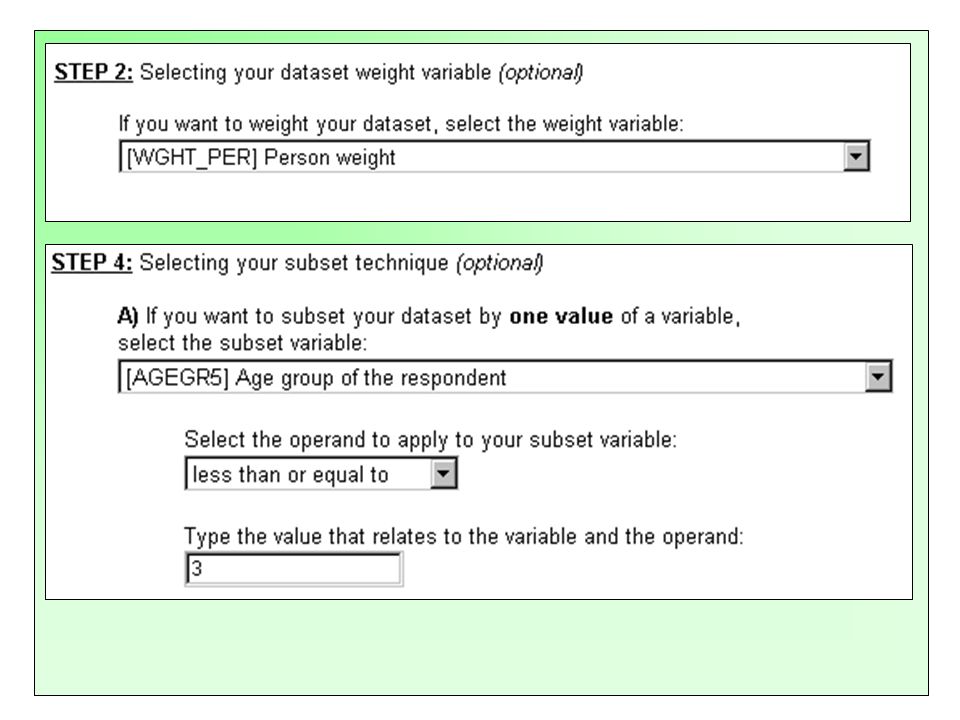
AGEGR5 less than or equal to 3

31
Results…

32
79.9 % 65.9 % 71 % 48 % vs Canadian Social Trends ? Our cross-tab

33
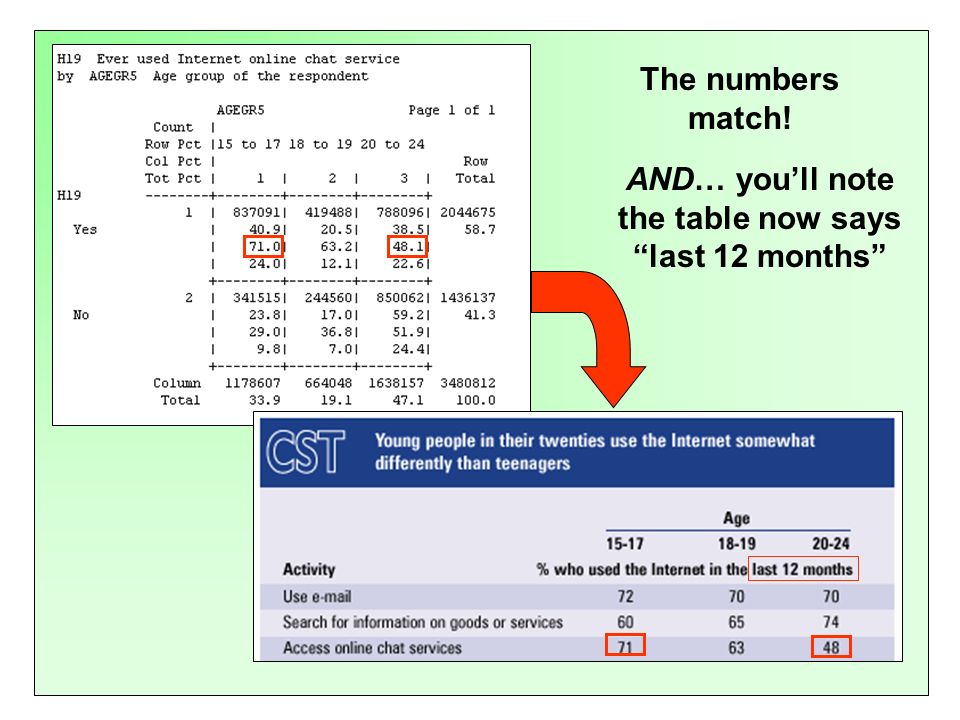
“An errata will be issued for the table appearing in CST because the table does not show percentages for those who used the Net in the last month but for those who used the Net in the last year.” “The difference in the numbers is because I used the variable H19 while your client is using the variable H20. H19 asked respondents who had used the Internet in the last year, if they had ever used the Internet to connect to an ONLINE CHAT SERVICE. H20 asked respondents how often they used the Internet to connect to an online chat service in the last month.” Reply from Statistics Canada… So… let’s try again with H19

34
So we need…

36
The numbers match! AND… you’ll note the table now says “last 12 months”

37
Original Table… Revised… Dec 2001 Jan 2002

38
So… We can use survey files to verify published results. But… We can also use survey files to expand on published results and explore new avenues of research. For example… 1.What is the influence of gender, education, or income on Internet use? 2.Are there differences between provinces? Between URBAN and RURAL dwellers? 3.Or any number of other “dimensions”… any question asked in the survey.

39
Survey Data Aggregate Data Postcard Camera “Fixed” “Flexible”

40
Sources of Aggregate Data… print –e.g., Canada Year Book, STC print publications CD-ROM –e.g., 1996 Census Profiles, LFHR, other DSP products Web-based –The Daily –“Canadian Statistics” –PDF versions of print publications –Beyond 20/20 Files – multidimensional tables… –CANSIM / E-Stat – time series

41
Beyond 20/20: what is it? Used to display multidimensional data, i.e., more than 3 dimensions or characteristics at once –e.g., age, sex (usually 3!), geography, date, etc.... allows user to customize the display of the data very useful for aggregate data, less so for microdata
, geography, date, etc.... allows user to customize the display of the data very useful for aggregate data, less so for microdata.")
42
Beyond 20/20: what is it used for/in? used in an increasing number of STC products, –many CD-ROM DSP products, e.g., LFHR, ITC, Profiles, Nation Series, Dimensions, etc. –one of available formats on E-Stat

44
CANSIM acronym for CANadian Socio-Economic Information Management System time-series data available –direct from STC ($) –via E-Stat (free to registered institutions) –via DLI (from UofT)
 –via E-Stat (free to registered institutions) –via DLI (from UofT)")
45
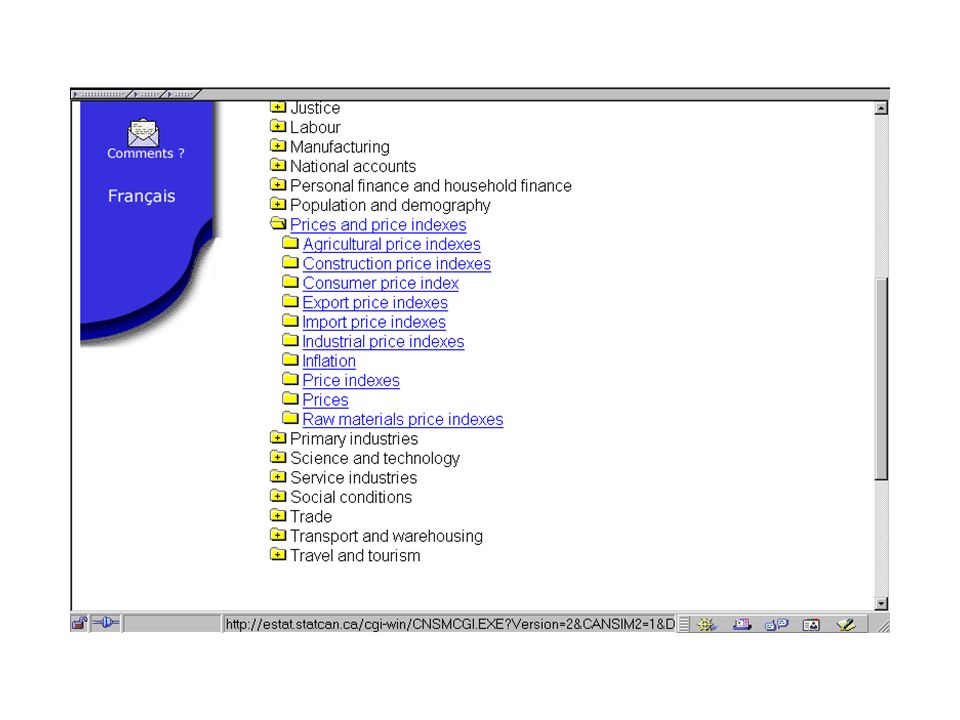
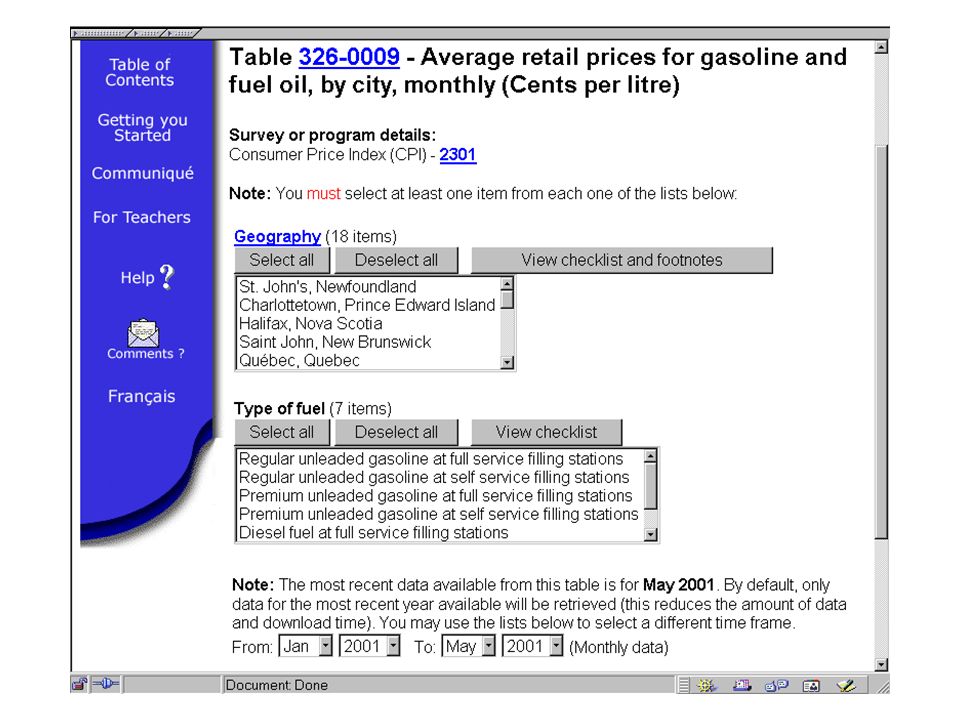
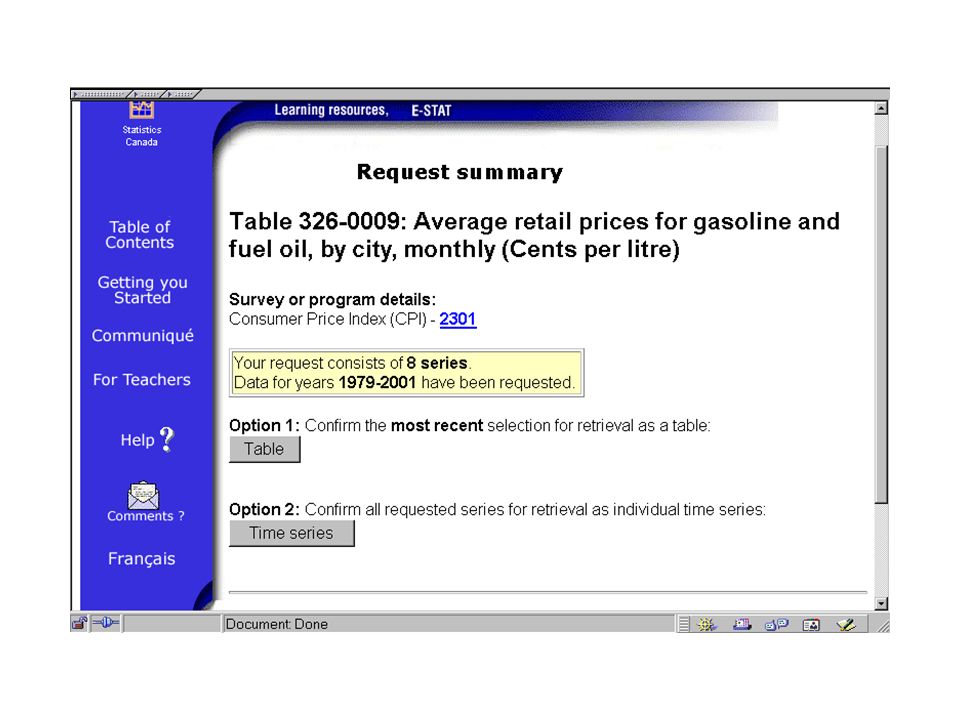
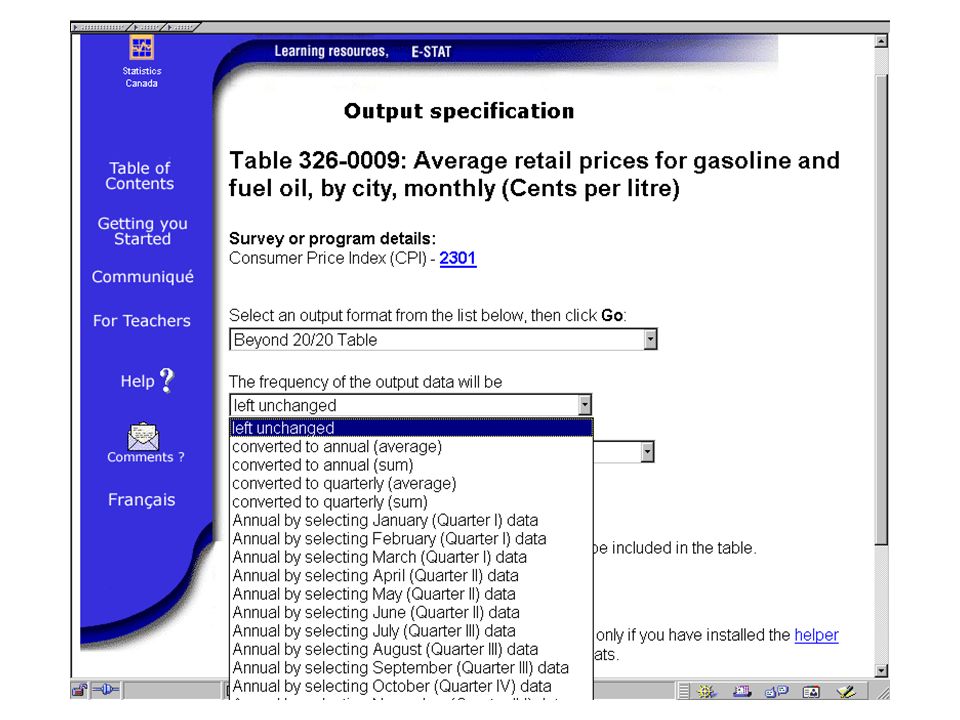
CANSIM II via E-Stat

56
Dealing with data really isn’t that hard...

57
Don’t be afraid to ask for help!

Similar presentations