Download presentation
Presentation is loading. Please wait.

1
Lower workers’ compensation costs? Presented by: Diana Blaha

2
Challenges Aging workforce Medical costs and inflation Managing care and costs Return to work and indemnity costs

3
Aging Workforce Average age is 40+ Vision and hearing issues Back pain – 40/20/20 Economy and unemployment Claims Severity Obesity

4
Meeting the Challenges Connected to wellness Safety programs Technology improving safety Early identification Prompt management

5
The Cost of Care National trends: NCCI and WCRI Pharmacy and narcotics Costly treatments Multiple surgeries

6
Are small medical-only claims becoming lost time?

7
Variance in States

8
© 2011 CorVel Corporation. Medical Cost Drivers State Reforms Understanding the Drivers Managing vs. Paying Pro-active analysis Controlling the Costs

9
© 2011 CorVel Corporation. $1.4B Narcotic Spend Brand Usage Over-Utilization Boutique Drugs Unmanaged Medicare Pharmacy is 10-15% of Total Medical Spend Pharmacy

10
Narcotic Study Average Total, Medical and Indemnity Benefits by Opiate Agonist Level Indemnity Claims Only Data for 3 years of incidents Average Paid Benefits % Payment Increases by Level of Opiate Agonist Prescriptions # of OpiatesTotal BenefitsMedicalIndemnityTotal BenefitsMedicalIndemnity No Opiates$14,346$7,633$6,713 1 Script$14,722$9,108$5,6142.6%19.3%-16.4% 2-3 Prescriptions$34,264$17,031$17,233138.8%123.1%156.7% 4-7 Prescriptions$37,508$21,782$15,726161.5%185.4%134.3% >7 Prescriptions$71,178$30,550$40,628396.2%300.3%505.2%

11
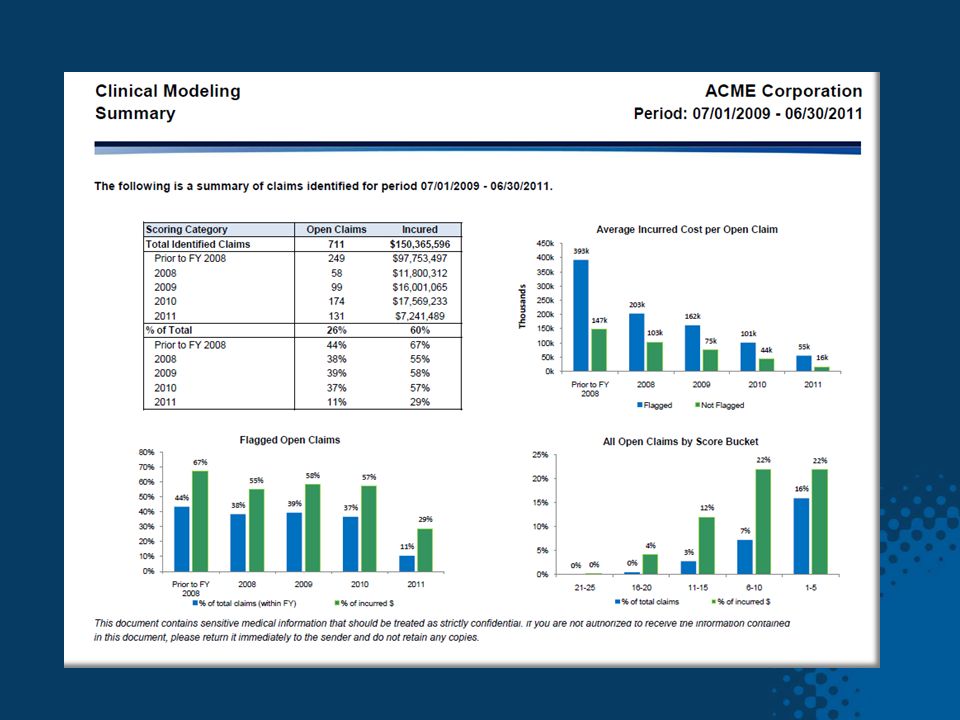
© 2011 CorVel Corporation. The Right Prescription Pharmacy Benefits Manager (PBM) Utilization management State initiatives Complete data Clinical modeling Target narcotic use
 Utilization management State initiatives Complete data Clinical modeling Target narcotic use.")
14
© 2011 CorVel Corporation. Over utilization Unmanaged Few state initiatives Reimbursement drivers Physical Therapy is 30% of Total Medical Spend Physical Therapy

15
© 2011 CorVel Corporation. Flexing Your Muscles Managed program Clinical indicators Take advantage of state initiatives

16
Sample Results for Physical Therapy $222,000 Savings in the First Year

17
© 2011 CorVel Corporation. Inherent Delays Lag time in reporting Lack of referral Inappropriate care Adversarial environment Managing Care as Well as Costs

18
WC Lost-Time Claim Frequency Increased in 2010

19
© 2011 CorVel Corporation. Medical Cost Drivers Nurse Triage Channeling Provider Panels Case Management Managed Programs HealthCare Approach Proactive vs. Reactive

20
© 2011 CorVel Corporation. Return to Work Lack of a RTW program More with Less Union challenges RIFs Indemnity Costs

21
Only 50% return to work if on disability for 6 months. Only 5% return to work if on disability over 12 months.

22
Good News: Indemnity Claims Costs Declined in 2010

23
© 2011 CorVel Corporation. Return to work, stay at work Nurse triage Early attention Transitional duty

24
© 2011 CorVel Corporation. Social Media Mobile Computing Connecting quicker Information at fingertips Address inherent delays Communication methods

25
© 2011 CorVel Corporation. Making the Impact Understand Your Workforce Manage Care and Cost Focus on Return to Work Reduce Cost of Risk

26
Thank you.

Similar presentations