Download presentation
Presentation is loading. Please wait.

1
P14421: Smart PV Panel Bobby Jones: Team Leader Sean Kitko Alicia Oswald Danielle Howe Chris Torbitt

2
AGENDA Project Overview Heat Analysis Electrical Design System Layout Test Plans BOM MSD II Schedule

3
Project Overview

4
Advance Power Systems ▫Jasper Ball ▫Atlanta, GA Snow reduces power output of PV panels Develop method to prevent snow from accumulating in the first place ▫Apply current to conductive, heating ink ▫Keep temperature of panel surface above freezing ▫Sense presence of snow Project Overview

5
Heat Analysis

6
Heat Analysis Process 1 How much power is produced by the panel if there was no snow ▫Uses TMY3 data which is the most average months weather in Rochester ▫Calculates solar beam angles on panel based on time of day and day of year and angle of panel tilt ▫Calculate how much energy panel produces from TMY3 data, solar beam angle, efficiency of panel (19%) and area of panel (0.024m)
 and area of panel (0.024m)")
7
Heat Analysis Process con’t 2 Find energy required to heat the panel in between ink traces to 5°C ▫Length and spacing determined by cell size. Limited to where bus bars on cells were ▫Coefficient of convection (h) ranges from 5 to 28 ▫Modeled sections of cell using fin analysis ▫Was able to calculate m, to get temperature at ink and q fin
 ranges from 5 to 28 ▫Modeled sections of cell using fin analysis ▫Was able to calculate m, to get temperature at ink and q fin.")
8
Cell

9
Heat Analysis Process con’t 3 Calculate total energy ▫q fin values already calculated ▫Calculate q melt based on an average snowfalls rate over 4 hours Uses ice properties (h=33400J/kg) Assumes density of snow=60 kg/m 2 ▫Calculated q rad Uses glass properties and surrounding temperature ▫Total q gen is the sum of these in each section
 Assumes density of snow=60 kg/m 2 ▫Calculated q rad Uses glass properties and surrounding temperature ▫Total q gen is the sum of these in each section")
10
Heat Analysis Process con’t 4 Compare different ink configurations based on q gen calculation ▫q gen was calculated based on sections of a cell ▫Calculations for configs based on an entire panel, not just one cell ▫Conclusion: Configuration 2 is the more efficient in all cases

11
Configuration 1 16 Sections 8-0.013 Sections 8-0.052 sections

12
Configuration 2 8 Sections 8-0.039 Sections

13
Configuration 3 4 Sections 4 0.078 Sections

14
Configuration 4 10 Sections 4-0.031 Sections 4-0.052 Sections 2-0.029 Sections

15
Heat Analysis Process con’t 5 calculated specific convection coefficient for each hour of the day it snows ▫Uses TMY3 data ▫Does not take into account the direction of wind or the angle of panel ▫Temperatures all rounded to nearest degree ▫Conclusions: All Reynolds's numbers were <5*10 5 therefore all used laminar model

16
Heat Analysis Process con’t 6 calculated energy required for snow prevention on panel ▫Uses h that was calculated ▫Uses same process as q gen calculation but uses data for that specific day ▫Snow data could not be found on hour basis, so assumed snows for four hours when most energy could be generated

17
Heat Analysis Process con’t 7 find how much light gets to the panel when snow is left to accumulate ▫Uses equation found on next slide ▫Equation used when there is snow accumulation. ▫As time moves forward, the snow accumulates ▫Snow is assumed to be left on panel for the rest of the day ▫Each day it is assumed there is not snow starting on the panel

18
Percentage of Light vs. Snow Depth

19
Heat Analysis Process con’t 8 Graphically compare results ▫Took the amount of energy required to melt snow over four hours (when there was snow) and subtracted that from how much energy the panel would produce with no snow ▫Took the calculated amount of light that would get through the snow and graphed that
 and subtracted that from how much energy the panel would produce with no snow ▫Took the calculated amount of light that would get through the snow and graphed that")
20
January 2

21
February 10

22
March 5

24
Energy Conclusion: Total energy for one year if snow is prevented: -7.5*10 7 J (-20,823Wh) Total energy for one year if panel was left alone: about 3,300,000J (916.5Wh) Snow prevention is not the best way to get rid of snow from an energy standpoint Suggest seeing energy consumption if snow is allowed to accumulate then heated up to slide off. Only found through testing.

25
Heat Analysis: ANSYS Modeling

26
ANSYS Modeling Goals: Utilize ANSYS modeling to verify Alicia’s analysis Compare various ink layouts for efficiency of heat spread Process: Made models in ANSYS representing various ink pattern layouts Modeled numerous scenarios Based on 5”x 5” cells that will be used in prototype Assumptions: Convection on back of panel can be neglected due to insulation/lack of exposure Thermal conductivity of glass = 1.4 W/m 2 Thermal conductivity of ink = 300 W/m 2 Variables:: Ink temperature (Ranges from 20-45°C) Bulk temperature (Ranges from -10 to 0°C) Convection coefficient (Ranges from 8 to 22 W/m 2 -K)
 Bulk temperature (Ranges from -10 to 0°C) Convection coefficient (Ranges from 8 to 22 W/m 2 -K)")
27
Ink Layout 1 Represents squares of ink in corners between cells. Approximately 1 cm 2 of ink at each location Poor heat spread, inefficient. Majority of cell at - 5°C, overall regardless of ink temperature. Layout 1: h=12W/m 2, T ink =45 °C, T bulk =-5 °C Layout 1: h=12W/m 2, T ink =30 °C, T bulk =-5 °C

28
Ink Layout 2 Represents a zigzag pattern of ink around all edges of cells. Heat doesn’t spread to center. Center of cell at -2°C with ink at 45°C Not efficient. Layout 2: h=12W/m 2, T ink =45 °C, T bulk =-5 °C Layout 2: h=12W/m 2, T ink =25 °C, T bulk =-5 °C

29
Ink Layout 3 Represents having 2 mm thick lines of ink between cells. Isn’t effective for allowing heat to spread across entirety of cell. Majority of cell still at - 4°C Layout 3: h=12W/m 2, T ink =25 °C, T bulk =-5 °C

30
Ink Layout 4 2 mm lines of ink between cells, 1.5mm line down center of cells. Most conducive to successful heat spread. Increasing convection along with lower bulk temperatures can lead to issues. Layout 1: h=12W/m 2, T ink =45 °C, T bulk =-5 °C Layout 4: h=14W/m 2, T ink =25 °C, T bulk =-10 °C

31
Layout 3 vs. Layout 4 Comparing having a center line of ink across cells vs. not – Apparent that the extra line allows for much better heat spread. Verifies that 3 line pattern is best option. Layout 4: h=12W/m 2, T ink =25 °C, T bulk =-5 °C

32
Effects of Adjusting Variables Heat spread most affected by increased convection rather than decreasing ambient temperature. Layout 4: h=12W/m 2, T ink =25 °C, T bulk =-10 °C Layout 4: h=18W/m 2, T ink =45 °C, T bulk =-10 °C

33
Electrical Design

34
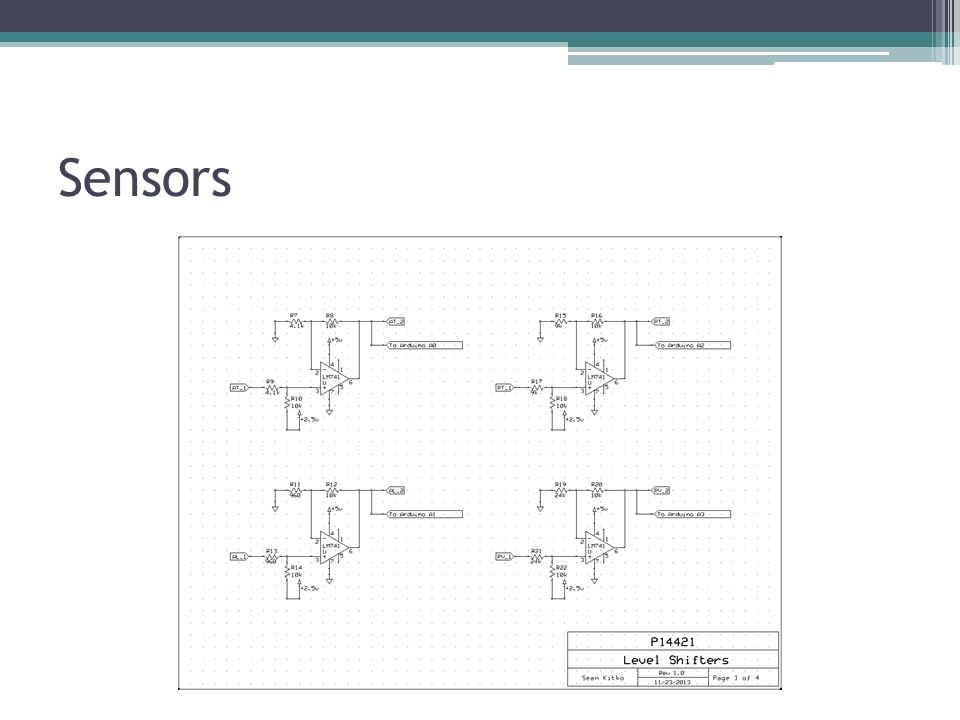
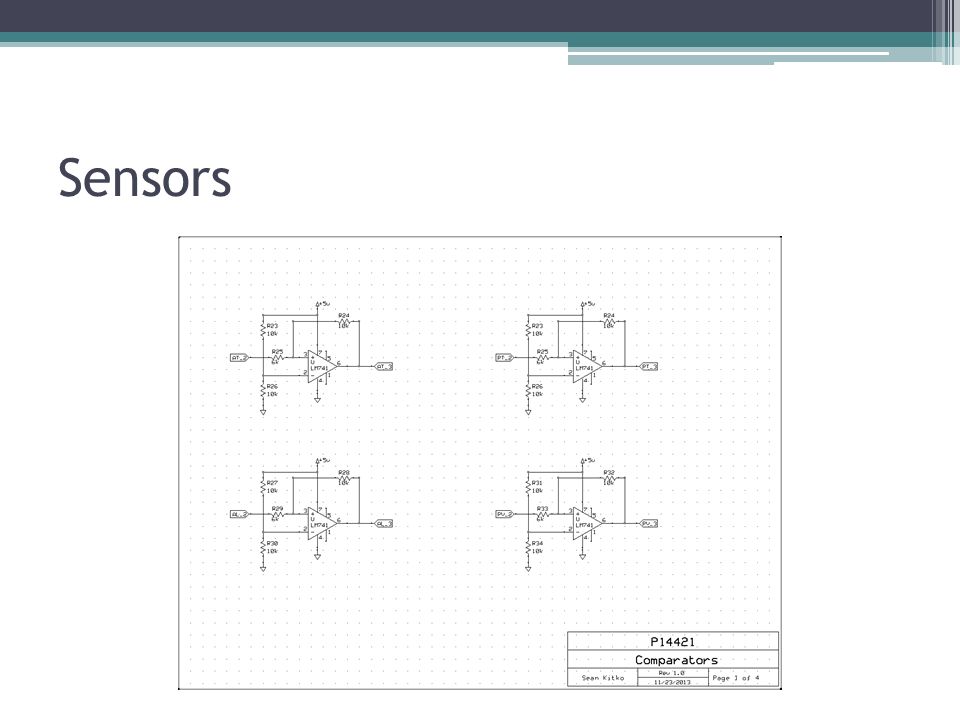
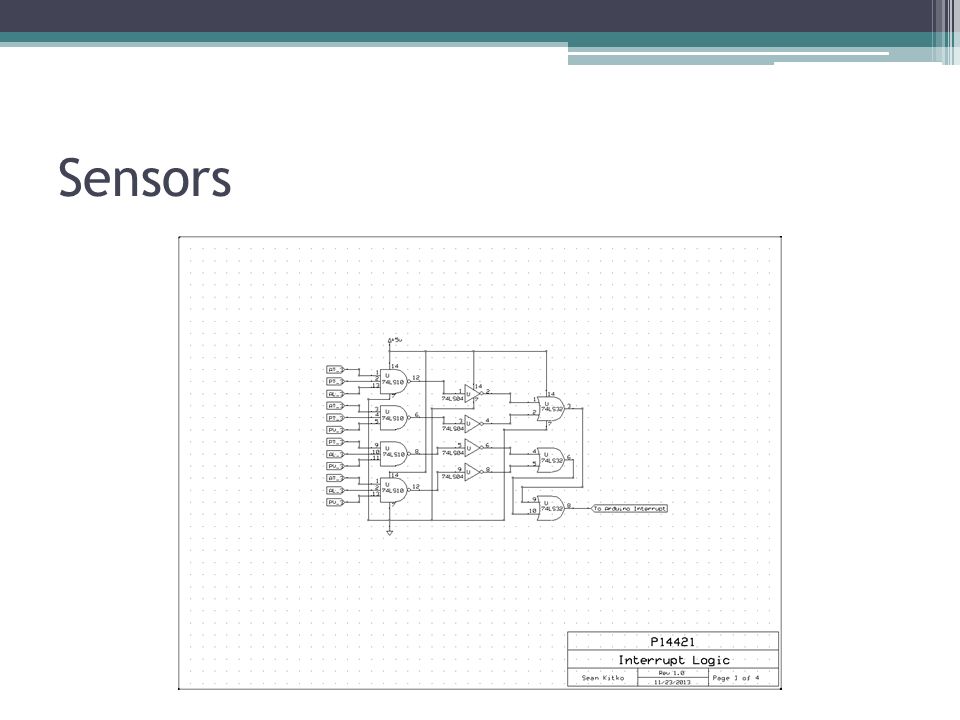
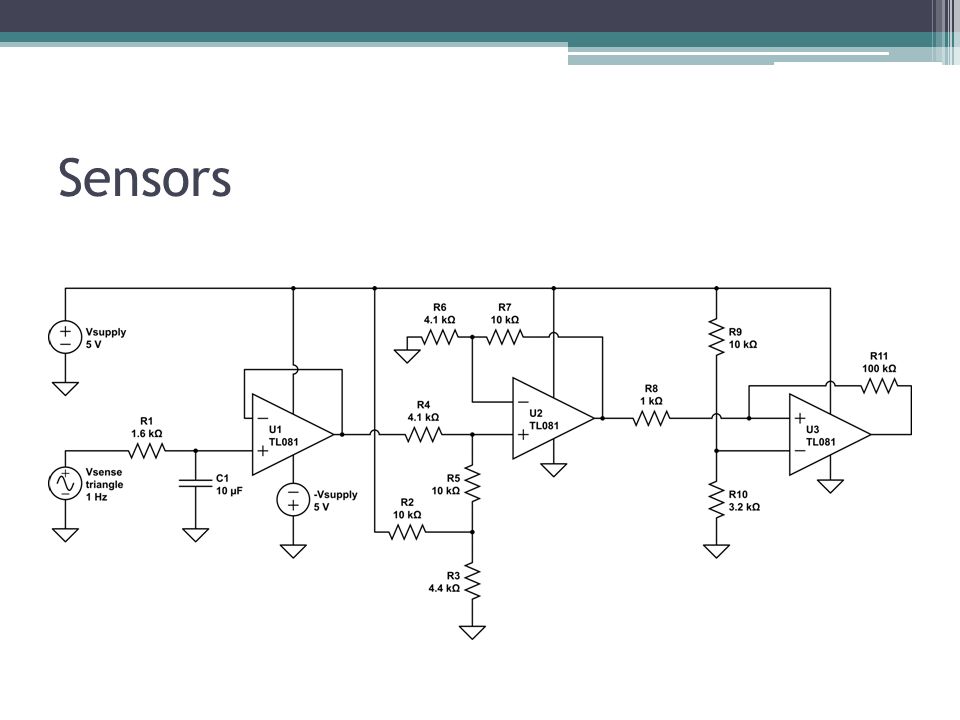
Sensors

39
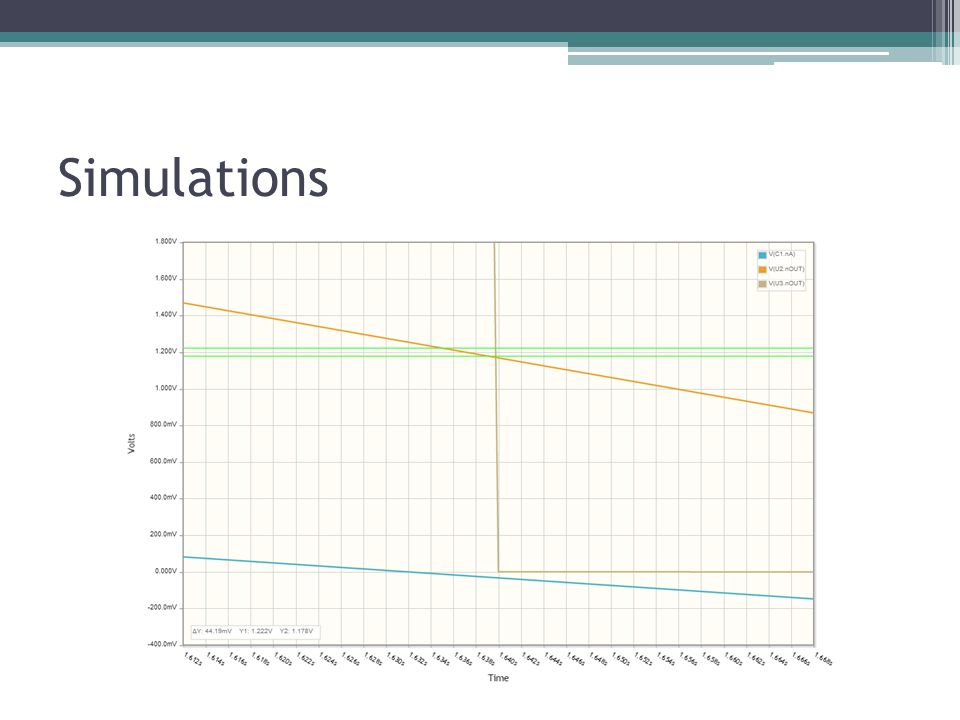
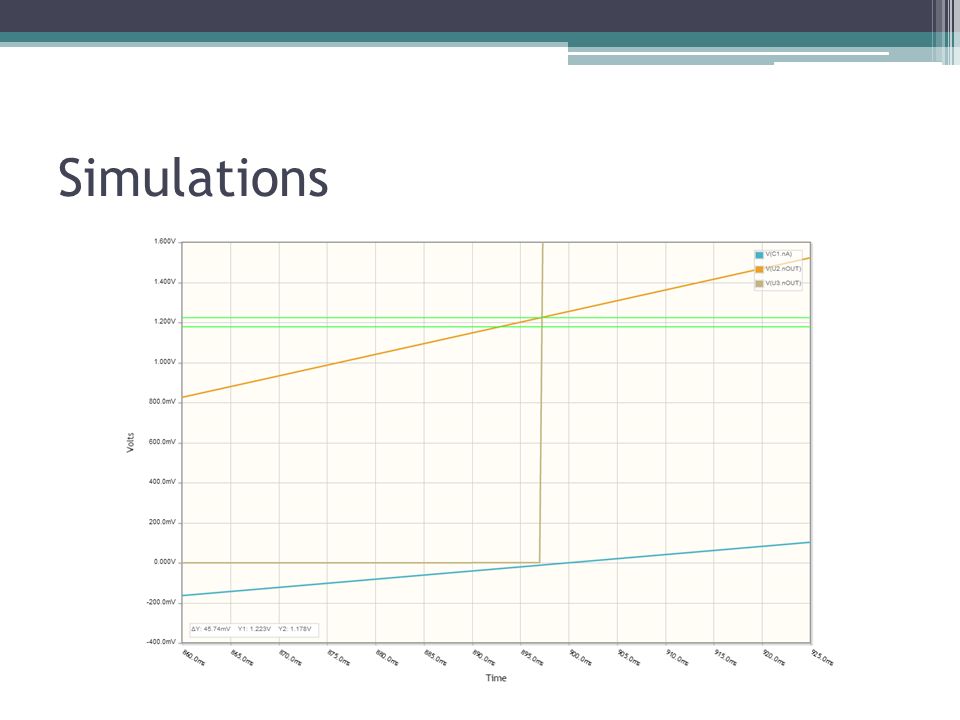
Simulations

42
Power Electronics

43
Power Usage Don’t want the battery to go below 40% Capacity Takes into account Efficiency in Cold Temperatures Power Management ItemCurrent (A)Voltage (V)Time (Hrs)Power (W)Amp Hrs Ink10848240 MicroController0.00023.3240.000660.0048 Charge Controller0.0112240.120.24 OPIC Light Sensor0.00053.3240.001650.012 LM35 Temp sensor0.000055240.000250.0012 Thermocoupler amplifier0.00025240.0010.0048 Totals82.1235640.2628 Needed Battery CapacityEfficiency in ColdChoose battery 64.4204860%103.072768
Voltage (V)Time (Hrs)Power (W)Amp Hrs Ink MicroController Charge Controller OPIC Light Sensor LM35 Temp sensor Thermocoupler amplifier Totals Needed Battery CapacityEfficiency in ColdChoose battery %")
44
Power Electronics Schem

45
Solid State Relay

46
Regulators BP5275 Series MAX1681

47
Battery and Controller Trojan 31-AGM Battery Getting a free AGM battery from a contact at Renewable Rochester Morningstar SS-20L 20 Amp PWM Solar Charge Controllers w/LVD ($78)
")
48
POC CONTROL SYSTEM Atmel's ATMega328P 8-Bit Processor in 28 pin DIP package with in system programmable flash Features: 32K of program space 23 programmable I/O lines 6 of which are channels for the 10-bit ADC. Runs up to 20MHz with external crystal. Package can be programmed in circuit. 1.8V to 5V operating voltage External and Internal Interrupt Sources Temperature Range: -40C to 85C Power Consumption at 1MHz, 1.8V, 25 C –Active Mode: 0.2mA –Power-down Mode: 0.1μA –Power-save Mode: 0.75μA (Including 32kHz RTC)
.")
49
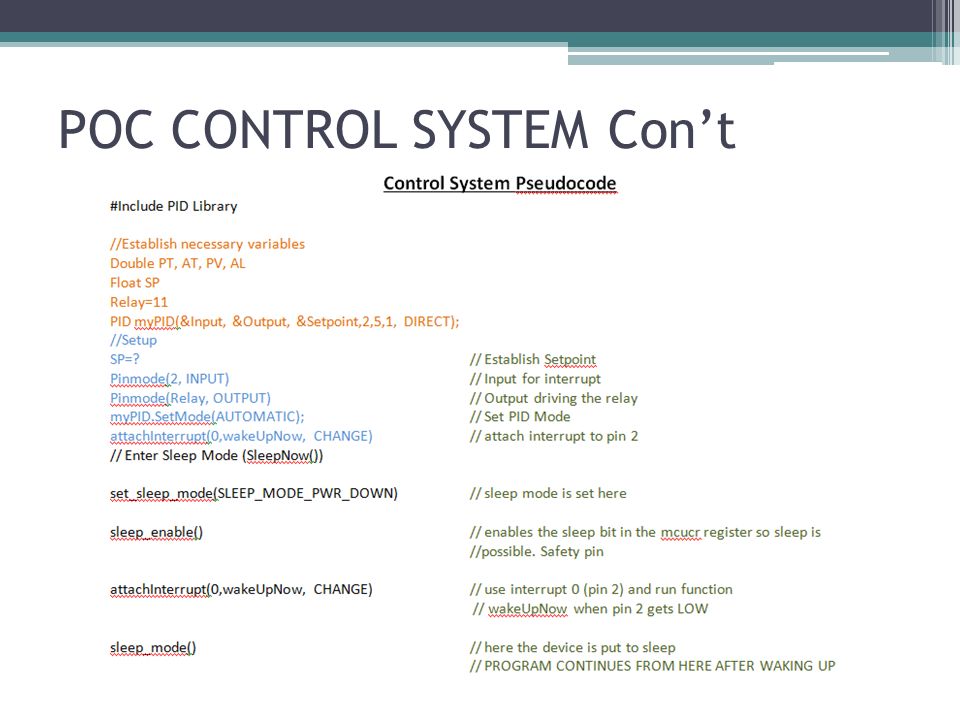
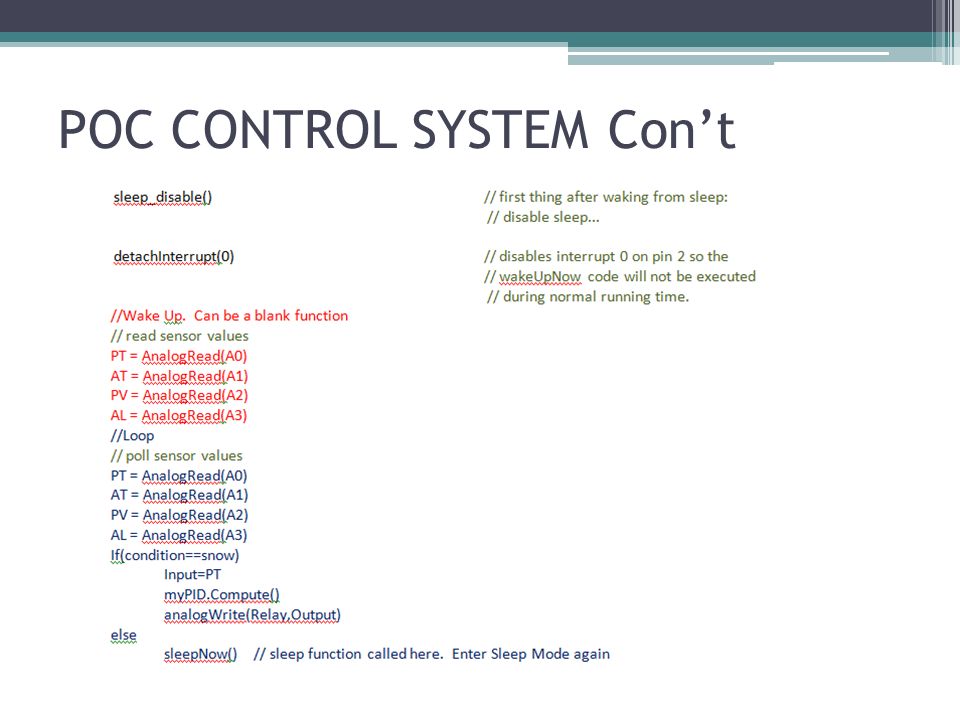
POC CONTROL SYSTEM Con’t

52
POC SENSOR RESEARCH

53
Enclosure

54
Enclosure and Layout

55
BILL OF MATERIALS

56
Risk Assessment and Mitigations

57
TEST PLAN OUTLINE ▫Heat Transfer Test Explores how heat propagates through glass from electrified trace Apply a DC voltage to ink trace Use thermocouples to measure temperature of glass at various locations Multiple applied voltages, multiple ink trace resistances Steady state and transient

58
TEST PLAN OUTLINE ▫Heat Transfer Test Diagram

59
TEST PLAN OUTLINE ▫Switch Simulation Test Explores functionality of heater system with simulated sensor inputs Using switches, apply various combinations of sensor inputs Verify that microcontroller wakes up when appropriate (interrupt test) With simulated inputs, verify that microcontroller can make decisions to melt.
 With simulated inputs, verify that microcontroller can make decisions to melt.")
60
TEST PLAN OUTLINE ▫Integrated System Test Explores full functionality of system in expected environment Install system in a realistic environment Verify sensor functionality ▫Verify microcontroller interrupts when appropriate ▫Verify microcontroller accurately reads values Verify heater functionality ▫Either with simulated or actual sensor inputs, verify that the system can melt snow efficiently.

61
MSD II SCHEDULE P14421 MSD II – Tentative Schedule Weeks 1-3: MSD I issues summarized. Mitigation strategies implemented (Jan 28 th ) Comprehensive and detailed Test Plan completed (Jan 28 th ) Test and Prototype components and systems Create preliminary C-Code for systems controller Begin construction and customization of enclosure Weeks 4 and on: Detailed/Finalized Testing Iterative testing and refinement of system and subsystems Technical paper and poster Confirm deliverables have been met
 Comprehensive and detailed Test Plan completed (Jan 28 th ) Test and Prototype components and systems Create preliminary C-Code for systems controller Begin construction and customization of enclosure Weeks 4 and on: Detailed/Finalized Testing Iterative testing and refinement of system and subsystems Technical paper and poster Confirm deliverables have been met.")
Similar presentations


 Team: Sean Jacobs, Brad Nissenbaum, Colin Tracy Advisor: Professor Anderson.>")


 Outer radius: 1.25” (0.03175 m) Inner radius:>")


 LED Dimmer Circuit>")
