Download presentation
Presentation is loading. Please wait.

1
www.isa.org.usyd.edu.au The University of Sydney AUSTRALIA

2
The University of Sydney AUSTRALIA Manfred Lenzen Barney Foran Christopher Dey Balancing Act A triple bottom line account of the Australian economy

3
What is Balancing Act ? It is a complete life-cycle assessment of Australia’s industry sectors across 10 sustainability indicators.

4
Why is Balancing Act new / special ?

6
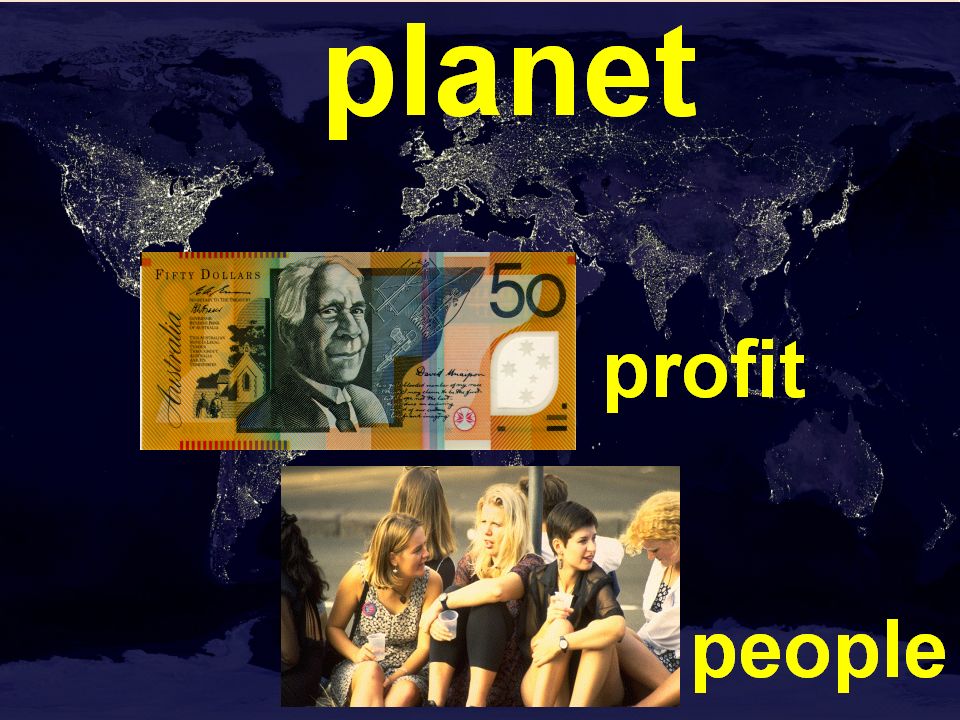
Economic: profits imports taxes and subsidies Environmental: energy & greenhouse material flow water & biodiversity Social: employment health and safety income A Global Reporting Framework The Triple Bottom Line -

7
There are some problems with the GRI’s approach to the TBL.

8
1: Investors need meaningful company benchmarks Water service provider A Pumping Catchment Water service provider B Pumping Catchment C D

9
2: Policy makers want to avoid loopholes in legislation Dairy farming Transport Dairy processing A Water con- sumption 98% <0.1% 2% Dairy farming Transport Dairy processing A 1 A 2

10
3: Producers need incentives for improving performance Dairy processing B Alum. / HDPE Packaging X Bio-plastic Packaging Dairy processing B Y

11
4: Insurers need to see hidden risks, eg. carbon taxation Construction Pty C On-site emissions Embodied emissions from materials Water supplier Pty D On-site emissions Lower embodied emissions from materials

13
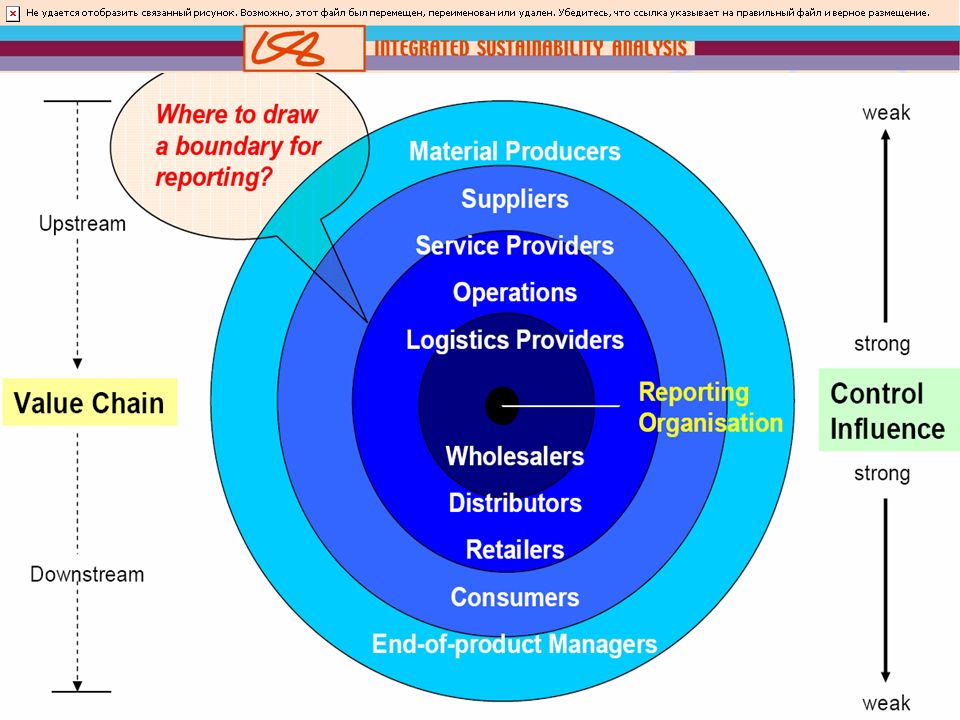
Balancing Act shows how to solve the boundary problem. It is therefore relevant to investors, policy makers, producers and insurers.

14
How does Balancing Act solve the boundary problem?

15
FRGESFRGESFRGESFRGESFRGES FRGESFRGESFRGESFRGESFRGES FRGESFRGESFRGESFRGESFRGES FRGESFRGESFRGESFRGESFRGES FRGESFRGESFRGESFRGESFRGES 4 3 FRGESFRGESFRGESFRGESFRGES 2 Aluminium for use FoodResourcesEnergyGoodsServices 0 1 Shipping of bauxite to smelter Manufacture of ship Iron ore for steel Energy for iron ore mining Steel for ship It looks at the whole supply chain.

16
Integrating National Input- Output Tables Structure and function and knock-on effects Physical data

17
The maths behind the model

18
What did Balancing Act come up with ?

22
Wheat and Other Grains

23
Production layers

24
Structural path analysis

25
Black Coal

26
Sector: Dairy Products

27
Alumina and Aluminium

28
Motor Vehicles and Parts

29
Electricity Supply

30
Banking

31
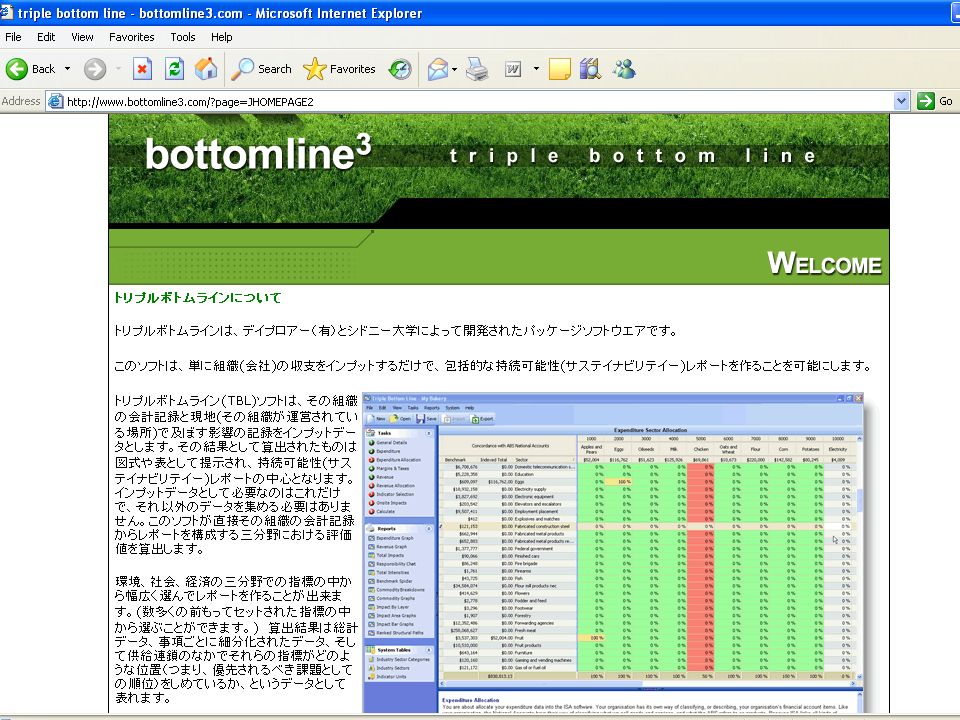
Spin-off 1 : The BL 3 software for businesses

36
Spin-off 2 : Detailed sustainability analysis for business and industry - Example: Aluminium

37
detailed on- site audit complete supply- chain analysis

38
FRGESFRGESFRGESFRGESFRGES FRGESFRGESFRGESFRGESFRGES FRGESFRGESFRGESFRGESFRGES FRGESFRGESFRGESFRGESFRGES FRGESFRGESFRGESFRGESFRGES 4 3 FRGESFRGESFRGESFRGESFRGES 2 Aluminium for use FoodResourcesEnergyGoodsServices 0 1 Shipping to smelter Manufacture of ship Iron ore for steel Energy for iron ore mining Steel for ship Example: Australian aluminium

39
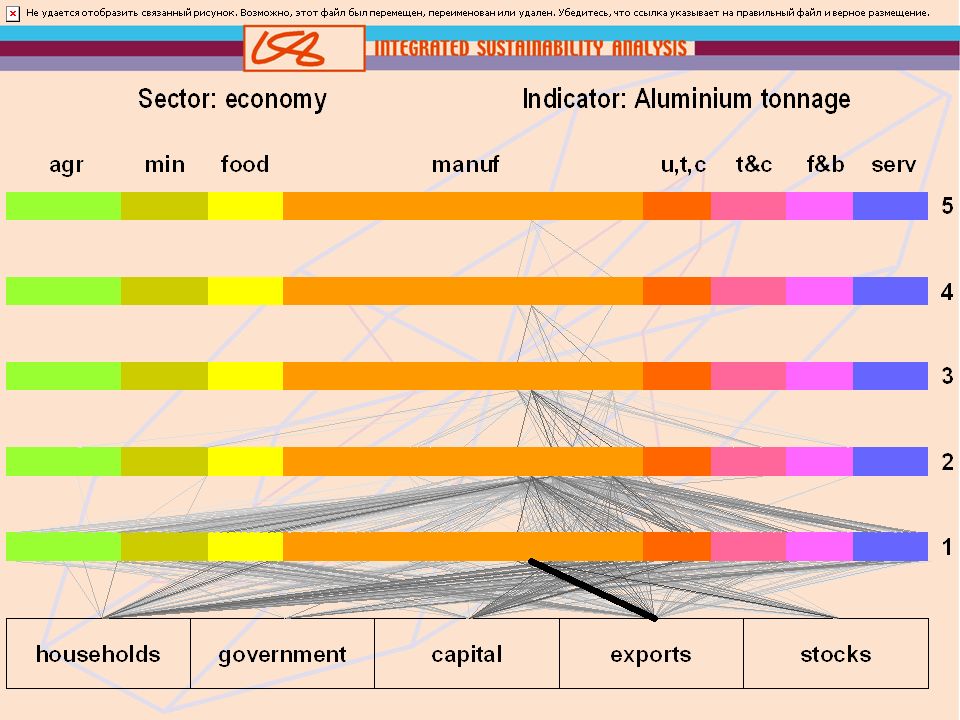
Electricity> Al> exports 46.57 PJ (46.29%) Alumina> Al> exports 14.48 PJ (14.39%) Al> exports 8.24 PJ (8.19%) Electricity> Alumina> Al> exports 1.40 PJ (1.39%) Electricity> Al> stocks 0.78 PJ (0.78%) Petroleum and coal products> Al> exports 0.40 PJ (0.40%) Electricity> Bauxite> Alumina> Al> exports 0.34 PJ (0.34%) Bauxite> Alumina> Al> exports 0.29 PJ (0.29%) Iron and steel> Al> exports 0.26 PJ (0.26%) Alumina> Al> stocks 0.24 PJ (0.24%) 10 top upstream paths: energy use
 Alumina> Al> exports PJ (14.39%) Al> exports 8.24 PJ (8.19%) Electricity> Alumina> Al> exports 1.40 PJ (1.39%) Electricity> Al> stocks 0.78 PJ (0.78%) Petroleum and coal products> Al> exports 0.40 PJ (0.40%) Electricity> Bauxite> Alumina> Al> exports 0.34 PJ (0.34%) Bauxite> Alumina> Al> exports 0.29 PJ (0.29%) Iron and steel> Al> exports 0.26 PJ (0.26%) Alumina> Al> stocks 0.24 PJ (0.24%) 10 top upstream paths: energy use")
41
Al> exports 959,672 t (74.2%) Al> stocks 16,089 t (1.24%) Al> electrical equipm.> construction> investm. 4,514 t (0.3%) Al> electrical equipm.> exports 4,106 t (0.3%) Al> sheet metal> investment 2,963 t (0.2%) Al> basic iron and steel> exports 2,532 t (0.2%) Al> sheet metal> beverages> households 2,144 t (0.2%) Al> electrical equipm.> households 1,891 t (0.1%) Al> electrical equipm.> investment 1,496 t (0.1%) Al> medical,photogr.& scientif.equipm.>exports 1,437 t (0.1%) 10 top downstream paths: aluminium use
 Al> electrical equipm.> exports 4,106 t (0.3%) Al> sheet metal> investment 2,963 t (0.2%) Al> basic iron and steel> exports 2,532 t (0.2%) Al> sheet metal> beverages> households 2,144 t (0.2%) Al> electrical equipm.> households 1,891 t (0.1%) Al> electrical equipm.> investment 1,496 t (0.1%) Al> medical,photogr.& scientif.equipm.>exports 1,437 t (0.1%) 10 top downstream paths: aluminium use.")
43
Spin-off 3 : The Australian Triple Bottom Line Atlas

44
Total energy requirement (GJ/cap)
")
45
Energy intensity (MJ/A$)
")
46
… and a whole continent. Covering the full supply chain …

47
Spin-off 4 : Environmental Impact Assessment

48
Emissions embodied in renewable energy technology

50
Where from here ?

51
Interlink time and space Multi-regional time series The Next Generation in Science

52
Growth in Greenhouse Gas Emissions since 1970 ACCELERATORS: Population growth +1.1% Economic growth +1.5% Industrial structure+1.0% Export volume+0.8% Residential energy mix+0.1% RETARDANTS: Energy intensity of industry -1.3% Fuel mix -0.3% Final demand mix -0.2% Destination of final demand -0.2% Export mix -0.1% Richard Wood University of Sydney plus 4.5% /year minus 2.1% /year 2.3%

53
Spatial impact modelling using GIS

54
Complex TBL Accounting Which Way Forward ?

55
www.bottomline3.com www.isa.org.usyd.edu.au For further info...

Similar presentations


 2009-04-23 A catalyst for growth Presented by Thomas Knutzen May 18, 2009.>")


