Download presentation
Presentation is loading. Please wait.

1
www.isa.org.usyd.edu.au The University of Sydney AUSTRALIA

2
Christopher Dey, Manfred Lenzen, Joy Murray Richard Wood & Thomas Wiedmann (SEI) Analysis of Sustainability
 Analysis of Sustainability")
3
1. What is sustainability “ development that meets the needs of the present world without compromising the ability of future generations to meet their own needs” (Bruntland Report of 1987 )
.")
4
Meets the needs of the present generation

5
Doesn’t compromise the ability of future generations to meet their needs Rault Family Biscuiterie 1870-2006

6
Socially and economically sustainable

7
The Walmart conversion

8
http://www.globalreporting.org/Homehttp://www.globalreporting.org/Home (Dec 2009) Economic: wages & pensions monies received & paid taxes paid and subsidies received Environmental: energy & greenhouse materials & effluents water & biodiversity Social: labour practices human rights bribery & corruption
 Economic: wages & pensions monies received & paid taxes paid and subsidies received Environmental: energy & greenhouse materials & effluents water & biodiversity Social: labour practices human rights bribery & corruption")
9
2. Triple bottom line accounting: the issues

10
A lot of reporting… is still very general… data and reporting are not standardized…not… a true apples- to-apples comparison Mike Tunnell, director of environmental research for the American Transportation Research Institute, June, 2010 we need a reliable, consistent way to measure impacts UK Climate Change and Env Minister Ian Pearson (May 2007) There is no single, quantifiable measure that companies can use for their upstream supply chain Trucost & Defra (May 2006) Standardised, quantifiable
 There is no single, quantifiable measure that companies can use for their upstream supply chain Trucost & Defra (May 2006) Standardised, quantifiable")
11
Carbon Disclosure Project

12
Take one environmental indicator for example…

13
cheatneutral Helping you because you can't help yourself Are you a cheater? Can I offset all my cheating? Loyal and faithful? What is Cheat Offsetting? so far, cheatneutral has offset 65, 768 cheats and has 9002 faithful people ready to neutralise your misdemeanours When you cheat on your partner you add to the heartbreak, pain and jealousy in the atmosphere. http://www.cheatneutral.com/http://www.cheatneutral.com/ 28/06/07

14
How the system works they fund Chris and Mim through Cheatneutral Chris and Mim promise to remain loyal and faithful. “Cheatneutral gave us advice on how to reduce our cheating first.” “We offset the remaining, unavoidable cheating by funding projects like Chris and Mim." http://www.cheatneutral.com/http://www.cheatneutral.com/ 28/06/07 James and Jo have been together since school.

15
So what does ‘Carbon Neutral’ mean? …cancelling out the harm done to the earth’s atmosphere by carbon- generating human activities, through other human activites that: either reduce CO2 emissions by an equal amount ; or prevent an equal amount being generated ‘there is no common agreed definition of the term ‘carbon neutral’ and there is evidence of this being exploited for PR purposes’ http://uk.standardlifeinvestments.com/content/data/press/press_articles/f inance_week_06_2006.htmlhttp://uk.standardlifeinvestments.com/content/data/press/press_articles/f inance_week_06_2006.html SLI, 2006

16
What do we count? Where do we draw the boundary?

17
Production layers and structural paths Lenzen & Murray, 2003

18
Know your supply chain Government expects businesses to ‘maintain high environmental standards throughout the supply chain’ http://www.businesslink.gov.uk/bdotg/action/layer?r.s=tl&r.l1=1079068363&r.lc=en&topicId=1082890707 (03/12/09) http://www.businesslink.gov.uk/bdotg/action/layer?r.s=tl&r.l1=1079068363&r.lc=en&topicId=1082890707 Businesses’ approach to corporate responsibility needs to extend throughout the supply chain Defra (Nov 2009) http://www.defra.gov.uk/environment/business/index.htm
 r.s=tl&r.l1= &r.lc=en&topicId= Businesses’ approach to corporate responsibility needs to extend throughout the supply chain Defra (Nov 2009)")
19
Why is it important? Case 1: Investors & consumers need meaningful company benchmarks Water service provider A Pumping Catchment Water service provider B Pumping Catchment C D

20
Why is it important? Case 2: Policy makers want to avoid loopholes in legislation Dairy farming Transport Dairy processing A Dairy farming Transport Dairy processing A 1 A 2 Water use 98% <0.1% 2%

21
Why is it important? Case 3: Producers need incentives for improving performance Dairy processing B Alum. / HDPE Packaging X Bio-plastic Packaging Dairy processing B Y

22
Why is it important? Case 4: Investors & insurers need to see hidden risks, eg. GHG emissions Construction Pty C On-site emissions Embodied emissions from materials Water supplier Pty D On-site emissions Lower embodied emissions from materials

23
3. Boundary-less quantifiable TBL accounting

24
Boundary

25
Bounded and un-bounded approaches ISA The GRI

26
Quantification: Input-Output Analysis Wassily Leontief (from 1930s) – eventually a Nobel prize Elements found in many economic models: “neutral from both an analytical and ideological point of view” (Nobel Laureate Richard Stone) Static, snap-shot of the complex linkages in an economy Appropriate for reporting and linkage analysis
 – eventually a Nobel prize Elements found in many economic models: neutral from both an analytical and ideological point of view (Nobel Laureate Richard Stone) Static, snap-shot of the complex linkages in an economy Appropriate for reporting and linkage analysis")
27
Agricultu re MiningManufact uring UtilitiesServices Agricultu re Mining Manufact uring Utilities Services Input to mining Input to services Output from mining Output from Services

28
Input Coefficients To Ag,For&FishMiningManufacturing Utilities,Trade,T ransport&Com municationServices Ag,For&Fish 10.9 ¢/$0.0 ¢/$4.5 ¢/$0.4 ¢/$0.2 ¢/$ Mining 0.1 ¢/$8.3 ¢/$4.5 ¢/$1.2 ¢/$0.1 ¢/$ Manufacturing 16.5 ¢/$10.6 ¢/$23.8 ¢/$15.2 ¢/$6.1 ¢/$ Utilities,Trade,Tra nsport&Communic ation 13.5 ¢/$12.8 ¢/$9.8 ¢/$17.1 ¢/$9.8 ¢/$ Services 5.7 ¢/$6.2 ¢/$5.2 ¢/$14.8 ¢/$20.3 ¢/$ 4.5c of agriculture is needed for every dollar’s worth of manufacturing

29
Quantification: Input-Output Analysis ‘Generalised IOA’ means that other production factors (eg. labour, imports, energy, etc) are incorporated Result is a common framework for different indicators
 are incorporated Result is a common framework for different indicators.")
30
Integration National Input- Output Tables Structure and function and knock-on effects Physical data

31
e.g. total emissions (direct plus indirect) e.g. direct (on-site) emissions e.g. purchases of a company The structure of the economy

32
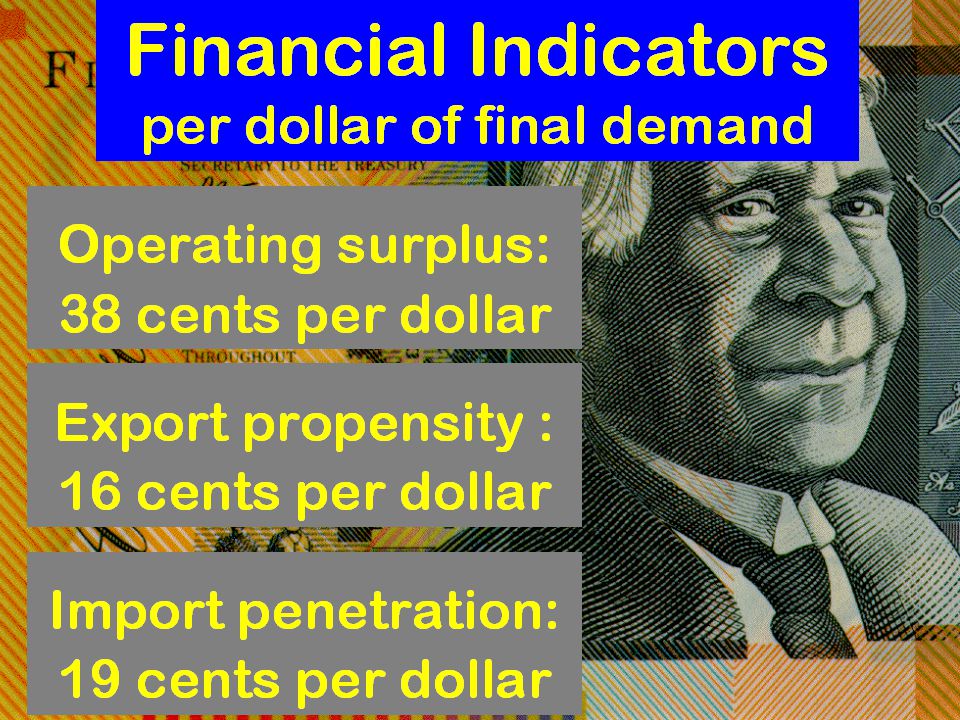
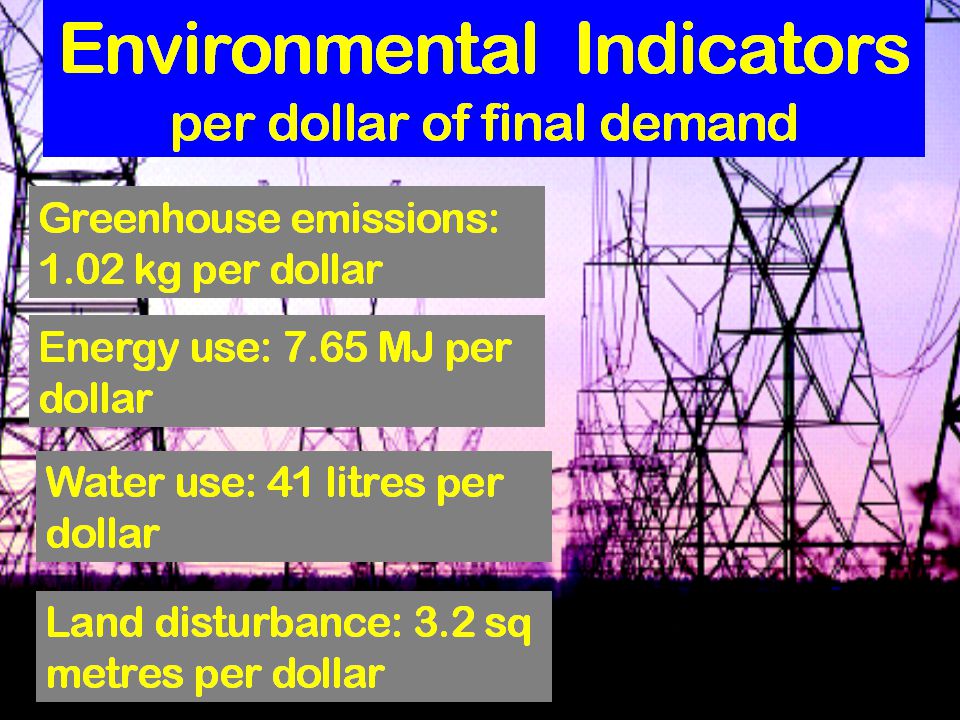
Satellite Account Greenhouse gas emissions 6.2 kg/$0.6 kg/$0.3 kg/$0.4 kg/$0.1 kg/$ Water use 441 L/$7.2 L/$2.6 L/$9.2 L/$1.5 L/$ Land use 127.03 m2/$ 0.01 m2/$ 0.05 m2/$ 1.05 m2/$ 441 L of water for every dollar’s worth of agriculture

33
A triple bottom line analysis of 135 sectors of the Australian economy Barney Foran 1 Manfred Lenzen 2 Christopher Dey 2 2005 1 CSIRO/ANU 2 University of Sydney

34
Key aspects of the BA report a complete life-cycle assessment of 135 industry sectors across 10 sustainability indicators comparable since related to the same $ of final demand full chain analysis (no boundaries - all upstream) standard data sources (ABS, ABARE, AGO …) quantitative and repeatable benchmarks descriptions of sectors, future trends and opportunities
 standard data sources (ABS, ABARE, AGO …) quantitative and repeatable benchmarks descriptions of sectors, future trends and opportunities")
38
Sectoral performance: the spider diagram

39
Wheat and other grains

40
Production layers

41
Structural path analysis

42
Knowing your full production chain Confectionary (Cn) Water: 90 litres per $
 Water: 90 litres per $")
43
4. Knowing your organisation’s supply chain

44
Two types of data inputs Financial accounts On-site impacts

45
Financial accounts

46
Allocation

47
Outputs More than 100 TBL indicators Quantification of total (direct and indirect) impacts Sector benchmarking Production layer analysis Structural path analysis
 impacts Sector benchmarking Production layer analysis Structural path analysis")
48
Typical TBL results

49
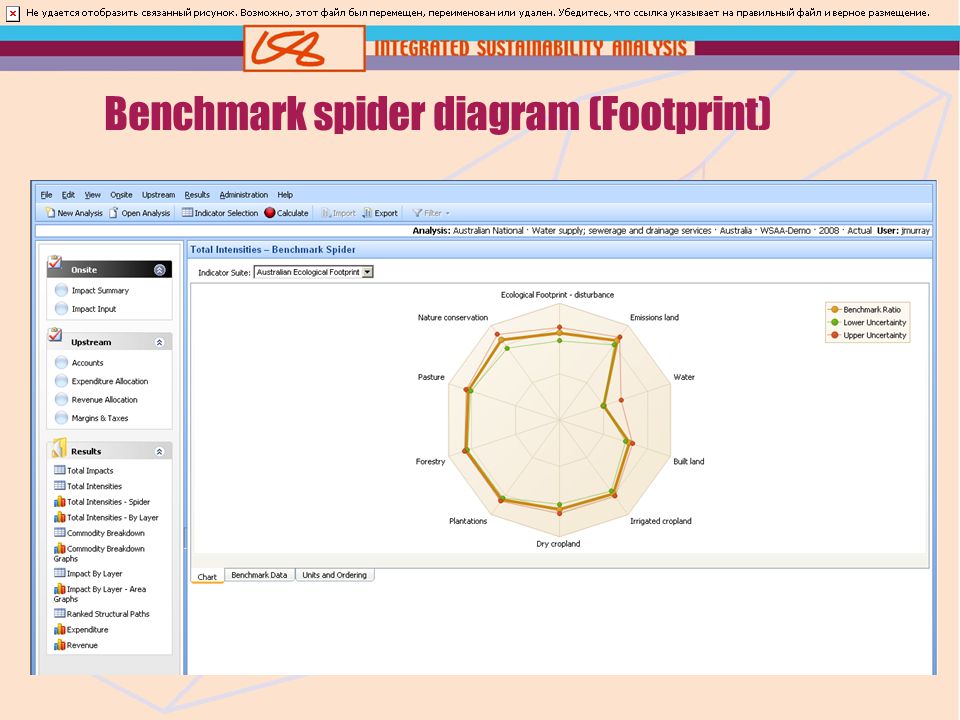
Benchmark spider diagram (Footprint)
")
51
Structural path analysis (energy) RankPath DescriptionPath Value Path Order Percentage in total impact 1My Bakery1,438 GJ146.1 % 2Electricity supply > My Bakery568 GJ218.2 % 3Refined sugar > My Bakery189 GJ26.05 % 4Vegetables > My Bakery56.0 GJ21.79 % 5Paper products > My Bakery49.1 GJ21.57 % 6Electricity supply > Fresh meat > My Bakery47.3 GJ31.52 % 7Road freight > My Bakery39.0 GJ21.25 % 8Paper containers > My Bakery34.4 GJ21.10 % 9Flour mill products > My Bakery32.2 GJ21.03 % 10Fresh meat > My Bakery26.6 GJ20.85 % 11Electricity supply > Electricity supply > My Bakery25.0 GJ30.80 % 12Raw sugar > Refined sugar > My Bakery24.4 GJ30.78 % 13Wholesale trade > My Bakery23.3 GJ20.75 % 14Gas supply > My Bakery20.3 GJ20.65 % 15Electricity supply > Poultry, slaughtered > My Bakery19.1 GJ30.61 % 16Electricity supply > Flour mill products > My Bakery18.9 GJ30.60 % 17Eggs > My Bakery18.9 GJ20.60 % 18Gluten > My Bakery17.0 GJ20.55 % 19Dairy products > My Bakery15.5 GJ20.50 % 20Electricity supply > Offal, hides, skins, blood meal > My Bakery13.3 GJ30.43 %
 RankPath DescriptionPath Value Path Order Percentage in total impact 1My Bakery1,438 GJ146.1 % 2Electricity supply > My Bakery568 GJ218.2 % 3Refined sugar > My Bakery189 GJ26.05 % 4Vegetables > My Bakery56.0 GJ21.79 % 5Paper products > My Bakery49.1 GJ21.57 % 6Electricity supply > Fresh meat > My Bakery47.3 GJ31.52 % 7Road freight > My Bakery39.0 GJ21.25 % 8Paper containers > My Bakery34.4 GJ21.10 % 9Flour mill products > My Bakery32.2 GJ21.03 % 10Fresh meat > My Bakery26.6 GJ20.85 % 11Electricity supply > Electricity supply > My Bakery25.0 GJ30.80 % 12Raw sugar > Refined sugar > My Bakery24.4 GJ30.78 % 13Wholesale trade > My Bakery23.3 GJ20.75 % 14Gas supply > My Bakery20.3 GJ20.65 % 15Electricity supply > Poultry, slaughtered > My Bakery19.1 GJ30.61 % 16Electricity supply > Flour mill products > My Bakery18.9 GJ30.60 % 17Eggs > My Bakery18.9 GJ20.60 % 18Gluten > My Bakery17.0 GJ20.55 % 19Dairy products > My Bakery15.5 GJ20.50 % 20Electricity supply > Offal, hides, skins, blood meal > My Bakery13.3 GJ30.43 %")
52
What's New GHG Protocol releases India GHG Program Guide Read More Read More Sign-up for our quarterly newsletter: Supply Chain Partners. http://www.ghgprotocol.org/ghg-protocols-product-and-supply-chain-initiative-launched-in-washington-dc-and-london … standards for measuring and managing GHG emissions throughout the product life cycle and across the entire … value chain. GHG Protocol’s Product and Supply Chain Initiative launches in Washington, DC and London GHG Protocol Steering Committee members in Washington, DC …accounting methods that can … produce robust results, and encourage …adoption by companies and organizations around the world.

53
www.CartoonStock.com
54
ISA @ The University of Sydney http://www.isa.org.usyd.edu.au www.bottomline3.com For further information

Similar presentations


 Recycling Committee Meeting March 18, 2010 Greenhouse Gas Protocol Product/Supply.>")


