Download presentation
Presentation is loading. Please wait.

1
手 手 羅 S N O 手 持 火 炬 的 火 炬 的 火 炬 的 手 手 手 俄 羅 羅 R E L O A D E D 手 持 火 炬 的 Results fromthe Salt Phase of the SNO Experiment Results from the Salt Phase of the SNO Experiment Joseph A. Formaggio University of Washington WIN ’03

2
Mapping the Sun with ’s Neutrinos from the sun allow a direct window into the nuclear solar processes. Each process has unique energy spectrum Only electron neutrinos are produced SNO sensitive to 8 B neutrinos Light Element Fusion Reactions p + p 2 H + e + + e p + e - + p 2 H + e 2 H + p 3 He + 3 He + 4 He 7 Be + 7 Be + e - 7 Li + + e 7 Li + p + 3 He + 3 He 4 He + 2p 99.75% 0.25% 85%~15% 0.02% 15.07% ~10 -5 % 7 Be + p 8 B + 8 B 8 Be* + e + + e 3 He + p 4 He + e + + e SNO, SK ChlorineGallium

3
Solar Neutrino Experiments SAGE 71 Ga + e 71 Ge + e -GALLEX/GNO SuperKamiokande e - + e e + e -

4
L-peak: 65.8 +6.6 -6.3 SNU K-peak: 71.5 +5.8 -5.6 SNU Overall: 69.1 +5.7 -5.4 SNU SSM : 129 +9 -7 SNU SAGE (January 1990 – March 2003) Results from SAGE Uses 71 Ga metal to measure e flux. Threshold = 233 keV Sensitive to lowest (pp chain) energy neutrinos. V. Gavrin, TAUP 2003
 energy neutrinos. V. Gavrin, TAUP")
5
Results from Gallex & GNO Uses Ga 3 Cl acid to measure e flux. Improved counting technique from GALLEX E. Bellotti, TAUP 2003 GNO (31/08/2003)62.9 ± 5.4 ± 2.5 SNU (L 68. ± 9. K 60. ± 7.) GALLEX77.5 ± 6.2 +4.3 -4.7 SNU GALLEX+GNO69.3 ± 4.1 ± 3.6 SNU Gallex GNO
62.9 ± 5.4 ± 2.5 SNU (L 68. ± 9. K 60. ± 7.) GALLEX77.5 ± SNU GALLEX+GNO69.3 ± 4.1 ± 3.6 SNU Gallex GNO.")
6
Recent Super-K Analysis New SuperK analysis of Day-Night Spectrum improves errors by 25%. Makes use of full zenith-angle dependence and 1496-day dataset. M. Smy, TAUP 2003

7
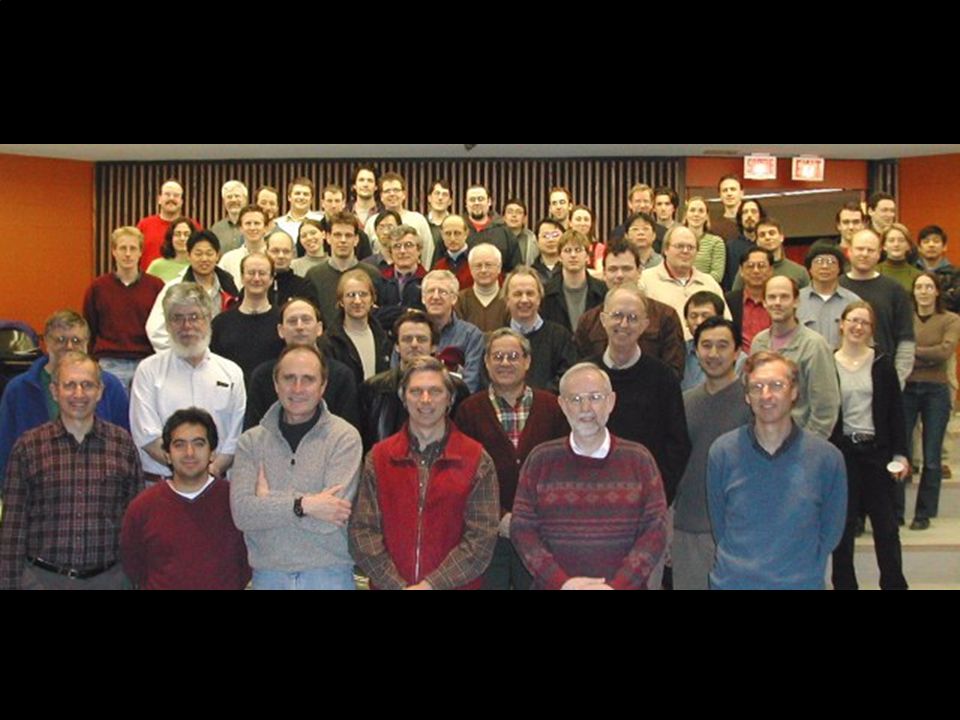
The SNO Collaboration G. Milton, B. Sur Atomic Energy of Canada Ltd., Chalk River Laboratories S. Gil, J. Heise, R.J. Komar, T. Kutter, C.W. Nally, H.S. Ng, Y.I. Tserkovnyak, C.E. Waltham University of British Columbia J. Boger, R.L Hahn, J.K. Rowley, M. Yeh Brookhaven National Laboratory R.C. Allen, G. B ü hler, H.H. Chen * University of California, Irvine I. Blevis, F. Dalnoki-Veress, D.R. Grant, C.K. Hargrove, I. Levine, K. McFarlane, C. Mifflin, V.M. Novikov, M. O'Neill, M. Shatkay, D. Sinclair, N. Starinsky Carleton University T.C. Andersen, P. Jagam, J. Law, I.T. Lawson, R.W. Ollerhead, J.J. Simpson, N. Tagg, J.-X. Wang University of Guelph J. Bigu, J.H.M. Cowan, J. Farine, E.D. Hallman, R.U. Haq, J. Hewett, J.G. Hykawy, G. Jonkmans, S. Luoma, A. Roberge, E. Saettler, M.H. Schwendener, H. Seifert, R. Tafirout, C.J. Virtue Laurentian University Y.D. Chan, X. Chen, M.C.P. Isaac, K.T. Lesko, A.D. Marino, E.B. Norman, C.E. Okada, A.W.P. Poon, S.S.E Rosendahl, A. Schülke, A.R. Smith, R.G. Stokstad Lawrence Berkeley National Laboratory M.G. Boulay, T.J. Bowles, S.J. Brice, M.R. Dragowsky, M.M. Fowler, A.S. Hamer*, A. Hime, G.G. Miller, R.G. Van de Water, J.B. Wilhelmy, J.M. Wouters Los Alamos National Laboratory J.D. Anglin, M. Bercovitch, W.F. Davidson, R.S. Storey * National Research Council of Canada J.C. Barton, S. Biller, R.A. Black, R.J. Boardman, M.G. Bowler, J. Cameron, B.T. Cleveland, X. Dai, G. Doucas, J.A. Dunmore, H. Fergani, A.P. Ferrarris, K. Frame, N. Gagnon, H. Heron, N.A. Jelley, A.B. Knox, M. Lay, W. Locke, J. Lyon, S. Majerus, G. McGregor, M. Moorhead, M. Omori, C.J. Sims, N.W. Tanner, R.K. Taplin, M.Thorman, P.M. Thornewell, P.T. Trent, N. West, J.R. Wilson University of Oxford E.W. Beier, D.F. Cowen, M. Dunford, E.D. Frank, W. Frati, W.J. Heintzelman, P.T. Keener, J.R. Klein, C.C.M. Kyba, N. McCauley, D.S. McDonald, M.S. Neubauer, F.M. Newcomer, S.M. Oser, V.L Rusu, S. Spreitzer, R. Van Berg, P. Wittich University of Pennsylvania R. Kouzes Princeton University E. Bonvin, M. Chen, E.T.H. Clifford, F.A. Duncan, E.D. Earle, H.C. Evans, G.T. Ewan, R.J. Ford, K. Graham, A.L. Hallin, W.B. Handler, P.J. Harvey, J.D. Hepburn, C. Jillings, H.W. Lee, J.R. Leslie, H.B. Mak, J. Maneira, A.B. McDonald, B.A. Moffat, T.J. Radcliffe, B.C. Robertson, P. Skensved Queen’s University D.L. Wark Rutherford Appleton Laboratory, University of Sussex R.L. Helmer, A.J. Noble TRIUMF Q.R. Ahmad, M.C. Browne, T.V. Bullard, G.A. Cox, P.J. Doe, C.A. Duba, S.R. Elliott, J.A. Formaggio, J.V. Germani, A.A. Hamian, R. Hazama, K.M. Heeger, K. Kazkaz, J. Manor, R. Meijer Drees, J.L. Orrell, R.G.H. Robertson, K.K. Schaffer, M.W.E. Smith, T.D. Steiger, L.C. Stonehill, J.F. Wilkerson University of Washington

9
Somewhere in the Depths of Canada...

10
Sudbury Neutrino Observatory 2092 m to Surface (6010 m w.e.) PMT Support Structure, 17.8 m 9456 20 cm PMTs ~55% coverage within 7 m 1000 Tonnes D 2 O Acrylic Vessel, 12 m diameter 1700 Tonnes H 2 O, Inner Shield 5300 Tonnes H 2 O, Outer Shield Urylon Liner and Radon Seal
 PMT Support Structure, 17.8 m cm PMTs ~55% coverage within 7 m 1000 Tonnes D 2 O Acrylic Vessel, 12 m diameter 1700 Tonnes H 2 O, Inner Shield 5300 Tonnes H 2 O, Outer Shield Urylon Liner and Radon Seal")
11
SNO during Construction

12
Unique Signatures Charged-Current (CC) e +d e - +p+p E thresh = 1.4 MeV e only Elastic Scattering (ES) x +e - x +e - x, but enhanced for e Neutral-Current (NC) x + d x + n+p E thresh = 2.2 MeV e
 e +d e - +p+p E thresh = 1.4 MeV e only Elastic Scattering (ES) x +e - x +e - x, but enhanced for e Neutral-Current (NC) x + d x + n+p E thresh = 2.2 MeV e ")
13
Results from Pure D 2 O Measurement of 8 B flux from the sun. Pure D 2 O extracted flux: NC SNO * = 5.09 8B SSM * = 5.05 +1.01 - 0.81 +0.44 +0.46 - 0.43 -0.43 * in units of 10 6 cm -2 s -1 Phys. Rev. Lett. 89, 011301 (2002)
.")
14
SNO Phase II - Salt Enhanced NC sensitivity n ~40% above threshold n+ 35 Cl 36 Cl+ ∑ Systematic check of energy scale E ∑ = 8.6 MeV NC and CC separation by event isotropy NC sensitivity n ~14.4% above threshold n+ 2 H 3 H+ Energy near threshold E = 6.25 MeV NC and CC separation by energy, radial, and directional distributions D2OD2O Salt

15
Advantages of Salt Neutrons capturing on 35 Cl provide much higher neutron energy above threshold. Gamma cascade changes the angular profile. Higher capture efficiency Same Measurement, Different Systematics n 36 Cl * 35 Cl 36 Cl

16
Cherenkov light and 14 ij Charged particle light cone Lagrange expansion of angular distribution

17
Steps to a Signal Calibrations Optics Energy Neutron Capture Backgrounds Internal photo-disintegration PMT - External neutrons and other sources Signal Extraction Charged current and neutral current events Systematics Global Fits

18
Sources of Calibration Use detailed Monte Carlo to simulate events Check simulation with large number of calibrations: Calibration Pulsed Laser 16 N 252 Cf 8 Li AmBe U & Th Sources Radon Spike Simulates... 337-620 nm optics 6.13 MeV neutrons <13 MeV decay 4.4 MeV ,n) source 214 Bi & 208 Tl ( , ) Rn backgrounds
 source 214 Bi & 208 Tl ( , ) Rn backgrounds.")
19
Optical Calibration The PMT angular response and attenuation lengths of the media are measured directly using laser+diffuser (“laserball”). Attenuation for D 2 O and H 2 O, as well as PMT angular response, also measured in-situ using radial scans of the laserball. Exhibit a change as a function of time after salt was added to the detector.

20
16 N Calibration Source ~1.2% ~2.0% 16 N Energy (MeV) Energy response of the detector determined from 16 N decay. Mono-energetic at 6.13 MeV, accompanied by tagged decay. Provides check on the optical properties of the detector. Radial, temporal, and rate dependencies well modeled by Monte Carlo.

21
16 N Energy Response In addition to 16 N, additional calibration sources are employed to understand energy response of the detector. Muon followers 252 Cf 8 Li 24 Na Systematics dominated by source uncertainties, optical models, and radial/asymmetry distributions Energy Scale = + 1.1% 252 Cf 8 Li Energy Resolution = + 3.4%

22
Neutron Response Use neutron calibration sources ( 252 Cf and AmBe) to determine capture profile for neutrons. 252 Cf decays by emission or spontaneous fission. Observe resulting cascade from neutron capture on 35 Cl. Monte Carlo agrees well with observed distributions. Neutrons/fission = 3.7676 + 0.0047 Radius (cm)
.")
23
Radial Position of 252 Cf Source, cm Neutron Capture Efficiency in SNO 35 Cl(n, ) 36 Cl Average Efficiency 39.9% T e ≥ 5.5 MeV and R ≤ 550 cm 2 H(n, ) 3 H Average Efficiency 14.4% T e ≥ 5.0 MeV and R ≤ 550 cm
 36 Cl Average Efficiency 39.9% T e ≥ 5.5 MeV and R ≤ 550 cm 2 H(n, ) 3 H Average Efficiency 14.4% T e ≥ 5.0 MeV and R ≤ 550 cm")
24
Backgrounds Calibrations Optics Energy Neutron Capture Backgrounds Internal photo-disintegration PMT - External backgrounds and other sources Signal Extraction Charged current and neutral current events Systematics Global Fits

25
3.27 MeV MeV Uranium An Ultraclean Environment Highly sensitive to any above neutral current (2.2 MeV) threshold. Sensitive to 238 U and 232 Th decay chains “I will show you fear in a handful of dust.” -- T.S. Eliot Thorium 2.615 MeV

26
Measuring U/Th In-situ: Low energy data Ex-situ: Ion exchange ( 224 Ra, 226 Ra) Membrane degassing Count daughter product decays Pure D 2 O Salt Added Bottom of vessel 2/3 way up Top of vessel MnOx HTiO MnOx HTiO Radon Spike!
 Membrane degassing Count daughter product decays Pure D 2 O Salt Added Bottom of vessel 2/3 way up Top of vessel MnOx HTiO MnOx HTiO Radon Spike!")
27
Old Backgrounds, New Technique: Radon `Spikes’ Controlled radon spike added to D 2 O to measure behavior of low-energy backgrounds. 80 Bq of Rn slowly mixed in heavy water.

28
New Backgrounds Salt and heightened neutron sensitivity introduces new/increased backgrounds in salt phase. 24 Na from neck of vessel. Cosmic rays Atmospheric neutrinos, Fission “External” ( ,n) reactions on carbon and oxygen in acrylic vessel Use radial profile to explicitly fit for external neutron, regardless of source. (Reconstructed radius, cm/ 600) 3 Headaches
 reactions on carbon and oxygen in acrylic vessel Use radial profile to explicitly fit for external neutron, regardless of source. (Reconstructed radius, cm/ 600) 3 Headaches.")
29
SourceNo. Events Deuteron photodisintegration 73.1 +24.0,-25.5 2 H( , )pn 2.8 +/- 0.7 17,18 O( ,n) 1.4 +/- 0.9 Fission, atmospheric ’s 23.0 +/- 7.2 Terrestrial and reactor ’s 2.3 +/- 0.8 Neutrons from rock <1 24 Na activation 8.4 +/- 2.3 Neutrons from CNO ’s 0.3 +/- 0.3 Total internal neutrons111.3 +/- 25 Internal (fission, atm. ) 5.2 +/- 1.3 16 N decays< 2.5 (68% CL) External-source neutrons (from fit) 84.5 +/- 34 Cherenkov events from - decays <14.7 (68% CL) “AV events”< 5.4 (68% CL) Backgrounds
pn 2.8 +/ ,18 O( ,n) 1.4 +/- 0.9 Fission, atmospheric ’s /- 7.2 Terrestrial and reactor ’s 2.3 +/- 0.8 Neutrons from rock <1 24 Na activation 8.4 +/- 2.3 Neutrons from CNO ’s 0.3 +/- 0.3 Total internal neutrons /- 25 Internal (fission, atm. ) 5.2 +/ N decays< 2.5 (68% CL) External-source neutrons (from fit) /- 34 Cherenkov events from - decays <14.7 (68% CL) AV events < 5.4 (68% CL) Backgrounds.")
30
Signal Extraction Calibrations Optics Energy Neutron Capture Backgrounds Internal photo-disintegration PMT - External backgrounds and other sources Signal Extraction Charged current and neutral current events Systematics Global Fits

31
Uncertainties in Fluxes Internal neutrons Energy scale Resolution Radial accuracy Angular res. Isotropy mean Isotropy width Radial E bias Cher. bkds “AV” events Neutron capture Total %

32
Isotropy Angle to Sun Kinetic Energy Signal Extraction for Salt Data from July 26, 2001 to Oct. 10, 2002 254.2 live days Blind analysis performed 3055 candidate events: 1339.6 +63.8 -61.5 CC 1344.2 +69.8 -69.0 NC 170.3 +23.9 -20.1 ES

33
Flux Measurements cc = 1.59 +0.08 (stat) +0.06 (syst) -0.07 -0.08 ES = 2.21 +0.31 (stat) + 0.10 (syst) -0.26 NC = 5.21 + 0.27 (stat) + 0.38 (syst) cc = 1.70 + 0.07 (stat) +0.09 (syst) -0.10 ES = 2.13 +0.29 (stat) +0.15 (syst) -0.28 - 0.08 NC = 4.90 + 0.24 (stat) +0.29 (syst) -0.27 Unconstrained Flux: Constrained Flux: * in units of 10 6 cm -2 s -1
 (syst) ES = (stat) (syst) NC = (stat) (syst) cc = (stat) (syst) ES = (stat) (syst) NC = (stat) (syst) Unconstrained Flux: Constrained Flux: * in units of 10 6 cm -2 s -1")
34
Ratios & Implications Constrains sterile component to : f B < 1.16 (3 ) 8 B SSM015.05 x 10 6 cm -2 s -1 NC Pure D 2 O 5.09 + 0.64 x 10 6 cm -2 s -1 NC Salt Constrained 4.90 + 0.38 x 10 6 cm -2 s -1 NC Salt Unconstrained5.21 + 0.47 x 10 6 cm -2 s -1 CC/NCConstrained 0.306 + 0.026 (stat) + 0.024 (sys) “…convincingly show that the flavor transitions of solar neutrinos are affected by Mikheyev-Smirnov- Wolfenstein (MSW) effects” A. Bandyopadhyay et. al, hep-ph/0309174 G.L. Fogli et. al,hep-ph/0309100

35
Oscillation Measurements SNO Only: Includes D/N and spectra from pure D 2 O, and new salt fluxes. SNO + Solar: Includes SK spectra, radiochemical experiments SNO + Solar + KamLAND: Reactor experiment information limits LMA region to one island (at 3 sigma) Maximal mixing rejected at 5.4 sigma
 Maximal mixing rejected at 5.4 sigma.")
36
Coming Soon… SNO III: REVOLUTIONS

37
Salt Removal Salt is being removed using a reverse osmosis unit, which produces a concentrated brine. The target is for ~1ppm salt in the D 2 O after multiple (3- 4) passes through the unit. Once the salt has been removed, SNO will move to the third phase of the experiment… First pass has been completed. 1950 out of 2000 kg of salt removed.
 passes through the unit. Once the salt has been removed, SNO will move to the third phase of the experiment… First pass has been completed out of 2000 kg of salt removed..")
38
SNO Phase III The Neutral Current Detectors Physics Motivation Event-by-event separation. Measure NC and CC in separate systems. Different systematic uncertainties than neutron capture on NaCl. NCD array as a neutron absorber. Array of 3 He counters 40 Strings on 1-m grid 398 m total active length Detection Principle 2 H + x p + n + x -2.22 MeV (NC) 3 He + n p + 3 H x n
 3 He + n p + 3 H x n.")
39
Current Status of the NCD Project Milestones Counter construction complete Done Radioassays complete April 2001 NCD in-situ background test Sep 2000 Neutron Background Estimates From radioassay: < 4.0% SSM Schedule Routine data taking+analysis Ongoing Training for NCD installation Complete Salt removal and NCD assembly Ongoing Deployment of NCD array Winter 2003

40
Conclusion Mapping of the solar neutrino parameters moves into precision phase (new results from SK, SAGE, GNO, and SNO). SNO’s salt measurement provides model-independent analysis of solar flux. Neutral current detectors soon to be installed, providing further precision on the solar flux. And be on the lookout for new analyses: Anti-neutrinos Spectrum Day-Night Combined Analyses Hep Lots of exciting physics to come!

41
Conclusion Many thanks to Hamish Robertson, John Wilkerson, Josh Kline, Alan Poon, and Sean McGee for their help.

43
Why Event-by-Event?

Similar presentations


 田 (da) 義 (yoshi) 章 (aki) with Lin Guey-Lin ( 林 貴林 ) National Chiao-Tung University.>")


