Download presentation
Presentation is loading. Please wait.

1
Queen’s University, Kingston General Hospital
Iatrogenic Underfeeding is Harmful to ‘High-Risk’ Critically ill Patients! Daren K. Heyland Professor of Medicine Queen’s University, Kingston General Hospital Kingston, ON Canada Add data from iatrogenic malnutrition slides

2
Learning Objectives Review the evidentiary basis for the amount of macronutrients provided to critically ill patients List strategies to improve nutritional adequacy in the critical care setting

4
R PERMIT Trial Design Primary Outcome Protein dose the same
40-60% prescribed calories for 14 days Primary Outcome 894 ICU Patients Fed enterally Protein dose the same R 90-day mortality 70-100% prescribed for 14 days

5
Results of PERMIT Trial

6
SHOULD WE PERMIT SYSTEMATIC UNDERFEEDING IN ALL ICU PATIENTS?
How do we Integrate the results of the PERMIT study in our clinical practice guidelines.

7
To answer these question, we need to consider….
Who were these patients studied in the PERMIT study? What was the intervention? Were all clinically important outcomes considered?

8
My Big Idea! Underfeeding in some ICU patients results in increased morbidity and mortality! Driven by misinterpretation of clinical data Not all patients will benefit the same; need better tools to risk stratify There are effective tools to overcome iatrogenic malnutrition

9
To answer these question, we need to consider….
Who were these patients studied in the PERMIT study? What was the intervention? Were all clinically important outcomes considered?

10
Patients Enrolled in PERMIT Trial

11
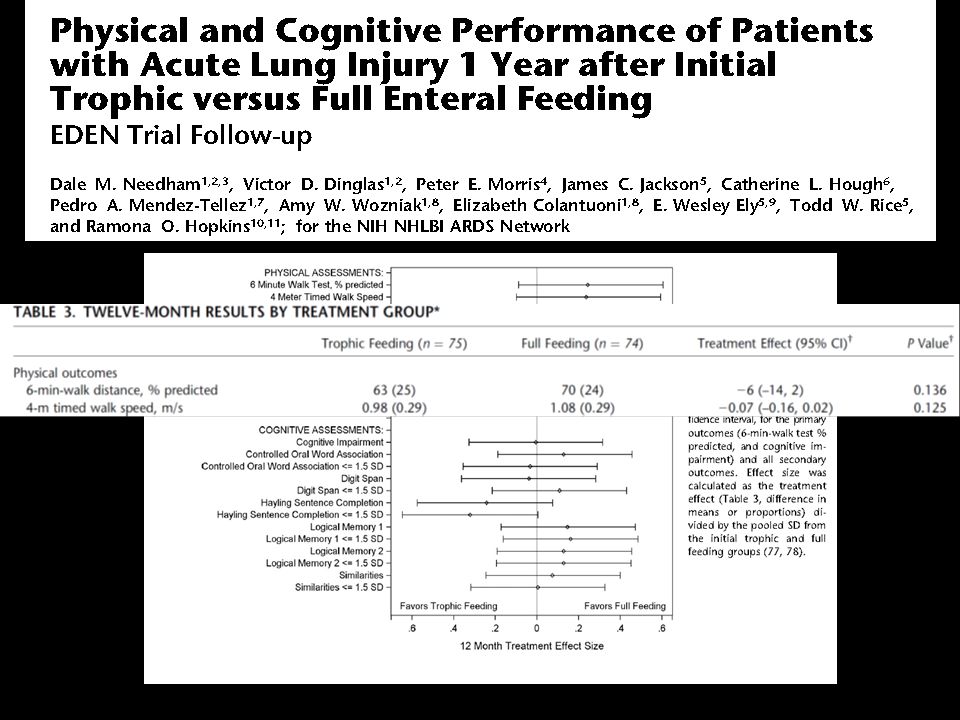
Initial Tropic vs. Full EN in Patients with Acute Lung Injury
The EDEN randomized trial Enrolled 12% of patients screened Rice TW, et al. JAMA. 2012;307(8):
:")
12
No effect in young, healthy, overweight patients who have short stays!
Trophic vs. Full EN in Critically Ill Patients with Acute Respiratory Failure Average age 52 Few comorbidities Average BMI* 29-30 All fed within 24 hours (benefits of early EN) Average duration of study intervention 5 days No effect in young, healthy, overweight patients who have short stays! * BMI: body mass index Alberda C, et al. Intensive Care Med. 2009;35(10):
 Average duration of study intervention 5 days. No effect in young, healthy, overweight patients who have short stays! * BMI: body mass index. Alberda C, et al. Intensive Care Med. 2009;35(10):")
13
ICU patients are not all created equal…should we expect the impact of nutrition therapy to be the same across all patients?

14
Not all ICU Patient the same!
Low Risk 34 year former football player, BMI 35 otherwise healthy involved in motor vehicle accident Mild head injury and fractured R leg requiring ORIF High Risk 79 women BMI 35 PMHx COPD, poor functional status, frail Admitted to hospital 1 week ago with CAP Now presents in respiratory failure requiring intubation and ICU admission

15
Point prevalence survey of nutrition practices in ICU’s around the world conducted Jan. 27, 2007
Enrolled 2772 patients from 158 ICU’s over 5 continents Included ventilated adult patients who remained in ICU >72 hours

16
50% 25% 75% 100%

17
Mechancially Vent’d patients >7days (average ICU LOS 28 days)
Faisy BJN 2009;101:1079

18
How do we figure out who will benefit the most from Nutrition Therapy?
Need picture of malnourshed child

19
A Conceptual Model for Nutrition Risk Assessment in the Critically Ill
Chronic Recent weight loss BMI? Acute Reduced po intake pre ICU hospital stay Starvation Nutrition Status micronutrient levels - immune markers - muscle mass Inflammation Acute IL-6 CRP PCT Chronic Comorbid illness

20
The Development of the NUTrition Risk in the Critically ill Score (NUTRIC Score).
Variable Range Points Age <50 50-<75 1 >=75 2 APACHE II <15 15-<20 20-28 >=28 3 SOFA <6 6-<10 >=10 # Comorbidities 0-1 2+ Days from hospital to ICU admit 0-<1 1+ IL6 0-<400 400+ AUC 0.783 Gen R-Squared 0.169 Gen Max-rescaled R-Squared 0.256 BMI, CRP, PCT, weight loss, and oral intake were excluded because they were not significantly associated with mortality or their inclusion did not improve the fit of the final model.

21
Interaction between NUTRIC Score and nutritional adequacy (n=211)*
The Validation of the NUTrition Risk in the Critically ill Score (NUTRIC Score). Interaction between NUTRIC Score and nutritional adequacy (n=211)* P value for the interaction=0.01 Heyland Critical Care 2011, 15:R28
. Interaction between NUTRIC Score and nutritional adequacy (n=211)* P value for the interaction=0.01. Heyland Critical Care 2011, 15:R28.")
22
In a second data set of 1200 ICU patients Minus IL-6 levels
Further validation of the “modified NUTRIC” nutritional risk assessment tool In a second data set of 1200 ICU patients Minus IL-6 levels Rahman Clinical Nutrition 2015

23
Who might benefit the most from nutrition therapy?
High NUTRIC Score? Clinical BMI Projected long length of stay Nutritional history variables Sarcopenia Medical vs. Surgical Others?

24
It is plausible that nutrition high risk patients (not well represented in these study) could still benefit from optimal nutritional delivery.
 could still benefit from optimal nutritional delivery.")
25
Optimal Amount of Calories for Critically Ill Patients: Depends on how you slice the cake!
Objective: To examine the relationship between the amount of calories recieved and mortality using various sample restriction and statistical adjustment techniques and demonstrate the influence of the analytic approach on the results. Design: Prospective, multi-institutional audit Setting: 352 Intensive Care Units (ICUs) from 33 countries. Patients: 7,872 mechanically ventilated, critically ill patients who remained in ICU for at least 96 hours. Heyland Crit Care Med 2011
 from 33 countries. Patients: 7,872 mechanically ventilated, critically ill patients who remained in ICU for at least 96 hours. Heyland Crit Care Med")
26
Association Between 12-day Nutritional Adequacy and 60-Day Hospital Mortality
Optimal amount= 80-85% Heyland CCM 2011

27
Optimal Nutrition (>80%) is associated with Optimal Outcomes!
(For High Risk Patients) If you feed them (better!) They will leave (sooner!)
 If you feed them (better!) They will leave (sooner!)")
28
To answer these question, we need to consider….
Who were these patients studied in the PERMIT study? What was the intervention? Were all clinically important outcomes considered?

29
RCTs of Early vs. Delayed EN
Infection RR 0.76 (0.69, 0.98) Mortality RR 0.68 (0.46, 1.01)
 Mortality. RR 0.68 (0.46, 1.01)")
30
Nutritional and Non-nutritional benefits of Early Enteral Nutrition
Attenuate oxidative stress ↓ Systemic Inflammatory Response Syndrome (SIRS) Reduce gut/lung axis of inflammation Maintain MALT tissue ↑Production of Secretory IgA at epithelial surfaces ↑Dominance of anti-inflammatory Th2 over pro-inflammatory Th1 responses Modulate adhesion molecules to ↓ transendothelial migration of macrophages and neutrophils ↑ Muscle function, mobility, return to baseline function Provide micro & macronutrients, antioxidants Maintain lean body mass ↓Muscle and tissue glycosylation ↑ Mitochondrial function ↑ Protein synthesis to meet metabolic demand Maintain gut integrity ↓Gut permeability Support commensal bacteria Stimulate oral tolerance ↑Butyrate production Promote insulin sensitivity, ↓hyperglycemia (AGEs) ↑ Absorptive capacity Influence anti-inflammatory receptors in GI tract ↓ Virulence of pathogenic organisms ↑ Motility, contractility McClave CCM 2015
 Reduce gut/lung axis of inflammation Maintain MALT tissue ↑Production of Secretory IgA at epithelial surfaces. ↑Dominance of anti-inflammatory Th2 over pro-inflammatory Th1 responses Modulate adhesion molecules to ↓ transendothelial migration of macrophages and neutrophils. ↑ Muscle function, mobility, return to baseline function. Provide micro & macronutrients, antioxidants Maintain lean body mass ↓Muscle and tissue glycosylation ↑ Mitochondrial function ↑ Protein synthesis to meet metabolic demand. Maintain gut integrity ↓Gut permeability Support commensal bacteria Stimulate oral tolerance ↑Butyrate production Promote insulin sensitivity, ↓hyperglycemia (AGEs) ↑ Absorptive capacity Influence anti-inflammatory receptors in GI tract ↓ Virulence of pathogenic organisms ↑ Motility, contractility. McClave CCM")
31
Pragmatic RCT in 33 ICUs in England
2400 patients expected to require nutrition support for at least 2 days after unplanned admission Early EN vs Early PN According to local products and policies Powered to detect a 6.4% ARR in 30 day mortality NEJM Oct

32
No difference in 30 day or 90 day mortality or infection nor 14 other secondary outcomes
Relied on micro data plus antibiotics, no adjudication or explication how the presence or absence of infection was determined. Reported as number of infections per patient. Suboptimal method of determining infection Protein Delivered: EN 0.7 gm/kg; PN 1.0 gm/kg

33
Updated Meta-analysis of EN vs PN Effect on Infection
RR 0.64 (95%CI 0.48, 0.87) Unpublished data
 Unpublished data.")
34
Early EN (within 24-48 hrs of admission) is recommended!
Optimal Amount of Protein and Calories for Critically Ill Patients?

35
R PERMIT Trial Design Primary Outcome Protein dose the same
40-60% prescribed calories for 14 days Primary Outcome 894 ICU Patients Fed enterally Protein dose the same R 90-day mortality 70-100% prescribed for 14 days

36
0.7 g/kg/day in both groups
How well did they do? 0.7 g/kg/day in both groups 68% 46% vs. 71%

38
Impact of Protein Intake on 60-day Mortality
Data from 2828 patients from 2013 International Nutrition Survey Patients in ICU ≥ 4 d Variable 60-Day Mortality, Odds Ratio (95% CI) Adjusted¹ Adjusted² Protein Intake (Delivery > 80% of prescribed vs. < 80%) 0.61 (0.47, 0.818) 0.66 (0.50, 0.88) Energy Intake (Delivery > 80% vs. < 80% of Prescribed) 0.71 (0.56, 0.89) 0.88 (0.70, 1.11) ¹ Adjusted for BMI, Gender, Admission Type, Age, Evaluable Days, APACHE II Score, SOFA Score ² Adjusted for all in model 1 plus for calories and protein Nicolo JPEN 2015 (in press)
 Adjusted¹. Adjusted². Protein Intake (Delivery > 80% of prescribed vs. < 80%) (0.47, 0.818) (0.50, 0.88) Energy Intake (Delivery > 80% vs. < 80% of Prescribed) (0.56, 0.89) (0.70, 1.11) ¹ Adjusted for BMI, Gender, Admission Type, Age, Evaluable Days, APACHE II Score, SOFA Score. ² Adjusted for all in model 1 plus for calories and protein. Nicolo JPEN 2015 (in press)")
39
Rate of Mortality Relative to Adequacy of Protein and Energy Intake Delivered
Nicolo JPEN 2015 (in press)
")
40
113 select ICU patients with sepsis or burns
On average, receiving 1900 kcal/day and 84 grams of protein No significant relationship with energy intake but…… 1.45 gm/kg/d 1.06 gm/kg/d 0.79 gm/kg/d Clinical Nutrition 2012

41
It is an open question whether higher amounts of protein will translate into improved clinical outcomes for such heterogeneous critically ill patients.

42
To answer these question, we need to consider….
Who were these patients studied in the PERMIT study? What was the intervention? Were all clinically important outcomes considered?

43
Initial Tropic vs. Full EN in Patients with Acute Lung Injury
The EDEN randomized trial Rice TW, et al. JAMA. 2012;307(8):
:")
44
Initial Tropic vs. Full EN in Patients with Acute Lung Injury
The EDEN randomized trial Rice TW, et al. JAMA. 2012;307(8):
:")
46
Trophic vs. Full enteral feeding in critically ill patients with acute respiratory failure
“survivors who received initial full-energy enteral nutrition were more likely to be discharged home with or without help as compared to a rehabilitation facility (68.3% for the full-energy group vs. 51.3% for the trophic group; p = .04).” Rice CCM 2011;39:967
. Rice CCM 2011;39:967.")
47
Nutritional Adequacy and Long-term Outcomes in Critically Ill Patients Requiring Prolonged Mechanical Ventilation Sub study of the REDOXS study 302 patients survived to 6-months follow-up and were mechanically ventilated for more than eight days in the intensive care unit were included. Nutritional adequacy was obtained from the average proportion of prescribed calories received during the first eight days of mechanical ventilation in the ICU. HRQoL was prospectively assessed using Short-Form 36 Health Survey (SF-36) questionnaire at three-months and six-months post ICU admission. Wei CCM 2015
 questionnaire at three-months and six-months post ICU admission. Wei CCM")
48
Estimates of association between nutritional adequacy and SF-36 scores
*Every 25% increase in nutritional adequacy; adjusted for age, APACHE II score, baseline SOFA, Functional Comorbidity Index, admission category, primary ICU diagnosis, body mass index, and region

49
So if we follow the results from the PERMIT study and continue to permit underfeeding, it is possible that we are harming some ICU patients, particularly those with long ICU stays.

50
Earlier and Optimal Nutrition (>80%) is Better!
(For High Risk Patients) If you feed them (better!) They will leave (sooner!)
 If you feed them (better!) They will leave (sooner!)")
51
Failure Rate The Prevalence of Iatrogenic Underfeeding
in the Nutritionally ‘At-Risk’ Critically Ill Patient % high risk patients who failed to meet minimal quality targets (80% overall energy adequacy) Of all at-risk patients, 14% were ever prescribed volume-based feeds 15% ever received sPN Heyland Clinical Nutrition 2015 Failure Rate
 Of all at-risk patients, 14% were ever prescribed volume-based feeds. 15% ever received sPN. Heyland. Clinical Nutrition Failure Rate.")
52
The same thinking that got you into this mess won’t get you out of it!
Can we do better? The same thinking that got you into this mess won’t get you out of it!

53
A Major Paradigm Shift in How we Feed Enterally
The Efficacy of Enhanced Protein-Energy Provision via the Enteral Route in Critically Ill Patients: The PEP uP Protocol! Different feeding options based on hemodynamic stability and suitability for high volume intragastric feeds. In select patients, we start the EN immediately at goal rate, not at 25 ml/hr. We target a 24 hour volume of EN rather than an hourly rate and provide the nurse with the latitude to increase the hourly rate to make up the 24 hour volume. Start with a semi elemental solution, progress to polymeric Tolerate higher GRV threshold (300 ml or more) Motility agents and protein supplements are started immediately, rather than started when there is a problem. A Major Paradigm Shift in How we Feed Enterally Heyland Crit Care 2010; see for more information on the PEP uP collaborative
 Motility agents and protein supplements are started immediately, rather than started when there is a problem. A Major Paradigm Shift in How we Feed Enterally. Heyland Crit Care 2010; see for more information on the PEP uP collaborative.")
54
Results of 2013 International Nutrition Survey
Results of the Canadian PEP uP Collaborative Results of 2013 International Nutrition Survey Heyland JPEN 2014

55
Health Care Associated Malnutrition
What if you can’t provide adequate nutrition enterally? … to add PN or not to add PN, that is the question!

56
Early vs. Late Parenteral Nutrition in Critically ill Adults
4620 critically ill patients Randomized to early PN Rec’d 20% glucose 20 ml/hr then PN on day 3 OR late PN D5W IV then PN on day 8 All patients standard EN plus ‘tight’ glycemic control Results: Late PN associated with 6.3% likelihood of early discharge alive from ICU and hospital Shorter ICU length of stay (3 vs 4 days) Fewer infections (22.8 vs 26.2 %) No mortality difference Cesaer NEJM 2011
 Fewer infections (22.8 vs 26.2 %) No mortality difference. Cesaer NEJM")
57
Early Nutrition in the ICU: Less is more! Post-hoc analysis of EPANIC
Indication bias: 1) patients with longer projected stay would have been fed more aggressively; hence more protein/calories is associated with longer lengths of stay. (remember this is an unblinded study). 2) 90% of these patients are elective surgery. there would have been little effort to feed them and they would have categorically different outcomes than the longer stay patients in which their were efforts to feed Protein is the bad guy!! Casaer Am J Respir Crit Care Med 2013;187:247–255
 patients with longer projected stay would have been fed more aggressively; hence more protein/calories is associated with longer lengths of stay. (remember this is an unblinded study). 2) 90% of these patients are elective surgery. there would have been little effort to feed them and they would have categorically different outcomes than the longer stay patients in which their were efforts to feed. Protein is the bad guy!! Casaer Am J Respir Crit Care Med 2013;187:247–255.")
58
Early vs. Late Parenteral Nutrition in Critically ill Adults
Cesaer NEJM 2011

59
Early vs. Late Parenteral Nutrition in Critically ill Adults
? Applicability of data No one give so much IV glucose in first few days No one practice tight glycemic control Right patient population? Majority (90%) surgical patients (mostly cardiac-60%) Short stay in ICU (3-4 days) Low mortality (8% ICU, 11% hospital) >70% normal to slightly overweight Not an indictment of PN Clear separation of groups after 2-3 days Early group only rec’d PN on day 3 for 1-2 days on average Late group –only ¼ rec’d any PN Cesaer NEJM 2011
 surgical patients (mostly cardiac-60%) Short stay in ICU (3-4 days) Low mortality (8% ICU, 11% hospital) >70% normal to slightly overweight. Not an indictment of PN. Clear separation of groups after 2-3 days. Early group only rec’d PN on day 3 for 1-2 days on average. Late group –only ¼ rec’d any PN. Cesaer NEJM")
60
Lancet Dec 2012 Doig, ANZICS, JAMA May 2013

61
What if you can’t provide adequate nutrition enterally?
… to TPN or not to TPN, that is the question! Case by case decision Maximize EN delivery prior to initiating PN Use early in high risk cases

62
Start PEP UP within 24-48 hrs
At 72 hrs >80% of Goal Calories? YES No NO Yes Anticipated Long Stay? High Risk? Yes Carry on! No Maximize EN with motility agents and small bowel feeding No problem YES Yes NO Tolerating EN at 96 hrs? No Supplemental PN? No problem

63
In Conclusion Not all ICU patients are the same in terms of ‘risk’
Iatrogenic underfeeding is harmful in some ICU patients or some will benefit more from aggressive feeding (avoiding protein/calorie debt) BMI and/or NUTRIC Score is one way to quantify that risk Need to do something to reduce iatrogenic underfeeding in your ICU! Audit your practice first! (JOIN International Critical Care Nutrition Survey in 2014) PEP uP protocol in all Selective use of small bowel feeds then sPN in high risk patients
 BMI and/or NUTRIC Score is one way to quantify that risk. Need to do something to reduce iatrogenic underfeeding in your ICU! Audit your practice first! (JOIN International Critical Care Nutrition Survey in 2014) PEP uP protocol in all. Selective use of small bowel feeds then sPN in high risk patients.")
65
Questions?

Similar presentations


 for severe sepsis and septic shock treatment>")


 Brought to you by www.criticalcarenutrition.com and your ICU Dietitianwww.criticalcarenutrition.com Background: There.>")


 With the right.>")

