Download presentation
Presentation is loading. Please wait.

1
Simulation Examples ~ By Hand ~ Using Excel
Chapter 2

2
Why do examples by hand or spreadsheet??
Insight to system Hands-on Helps with programming Complex systems not amenable to spreadsheet simulation

3
Process Determine Characteristics of system Construct simulation table
Generate & compute values

4
Key Components Random Numbers Descriptive Statistics
Number: between 0 & 1 Variable: some quantity; perhaps from a known distribution Descriptive Statistics Values used for describing a systems and making predictions about its behavior Note: has files

5
Random Variable A quantity determined by some random experiment
Examples Number of heads obtained when flipping a coin 10 times Number of customers arriving in an hour Maximum length of a queue during the day Shortest service time for a customer for the day

6
Randomness True Random vs. Pseudo-Random Random number sequence Where?
Uniformly distributed Each number statistically independent of previous numbers Where? Random Number Generators (functions) Random Number Tables
 Random Number Tables")
7
Excel – Random numbers =RAND( ) =RANDBETWEEN (low, high)
Generates real values: 0 <= val < 1 =RANDBETWEEN (low, high) Generates integers: low <= val <= high To use in Excel IF (RAND ( ) < 0.5, 0, 1) IF (A2 <= 0.33, 0, (IF A2 <= 0.66, 1, 2) Problem with Excel….
 Generates integers: low <= val <= high. To use in Excel. IF (RAND ( ) < 0.5, 0, 1) IF (A2 <= 0.33, 0, (IF A2 <= 0.66, 1, 2) Problem with Excel….")
8
Other sources of random numbers
Authors provide Visual Basic functions in the sample spreadsheets on web site. We will not use these. Discussed in and 2.1.3 Random Number Tables in text Table A1 (p. 592) – uniform Table A2 (p. 593) – normal Limitations: Excel & VB functions – don’t use in professional work
 – uniform. Table A2 (p. 593) – normal. Limitations: Excel & VB functions – don’t use in professional work.")
9
Random Number Generator (RNG) Features
RNG is a mathematical function Different strategies Period: Number of values generated before sequence repeats Seed: Initialization value for a RNG

10
Example: Coin Tossing Monte Carlo Simulation
Fair coin Head/Tail equally likely IF (RAND ( ) < 0.5, “H”, “T”)
 < 0.5, H , T )")
11
Example: Random Service Times
Integer value 1 to 10, inclusive =RANDBETWEEN (1, 10) Integer value with given probability 30%; 45%, 25% Develop cumulative probability 3 6 .75 – 1 10 IF (A2 <= 0.3, 3, (IF A2 <= 0.75, 6, 10) Why not? IF (RAND() <= 0.3, 3, (IF RAND <= 0.75, 6, 10))
 Integer value with given probability. 30%; 45%, 25% Develop cumulative probability – 1 10. IF (A2 <= 0.3, 3, (IF A2 <= 0.75, 6, 10) Why not IF (RAND() <= 0.3, 3, (IF RAND <= 0.75, 6, 10))")
12
Arrival Times Arrival Time vs. Inter-Arrival Time
Arrival time – Clock time of arrival Inter-Arrival Time: time between successive arrivals Example: Initialize: Clock = 0 Inter-Arrival Time Arrival Time (Clock) 3 7 10 2 12
")
13
Queuing(Waiting Line) Systems
Calling population Infinite vs. Finite population Nature of arrivals Arrival Rate vs. Effective Arrival Rate Service mechanism Single vs. Multiple vs. Sequential Service time Queue discipline

14
Arrivals & Services Generally defined by a distribution (random)
Time between arrivals – inter-arrival time Service Service times Arrival rate must be less than the service rate. What if it is not? Unstable, explosive

15
Queue Basics System State Event Clock
Number & status of entities (units) Event Circumstance that causes a change in system state Clock Relative time
 Event. Circumstance that causes a change in system state. Clock. Relative time.")
16
Single Server & Queue What are the state variables?
Arrive Queue Server Depart What are the state variables? What are the events? Refer to flow diagrams – Pg. 42 +

17
Future Events List (FEL)
Can Generate Events up-front Before simulation begins OK for small/short simulations on-the-fly As needed Used for professional/complex simulations Generate Inter-arrival times & Service times

18
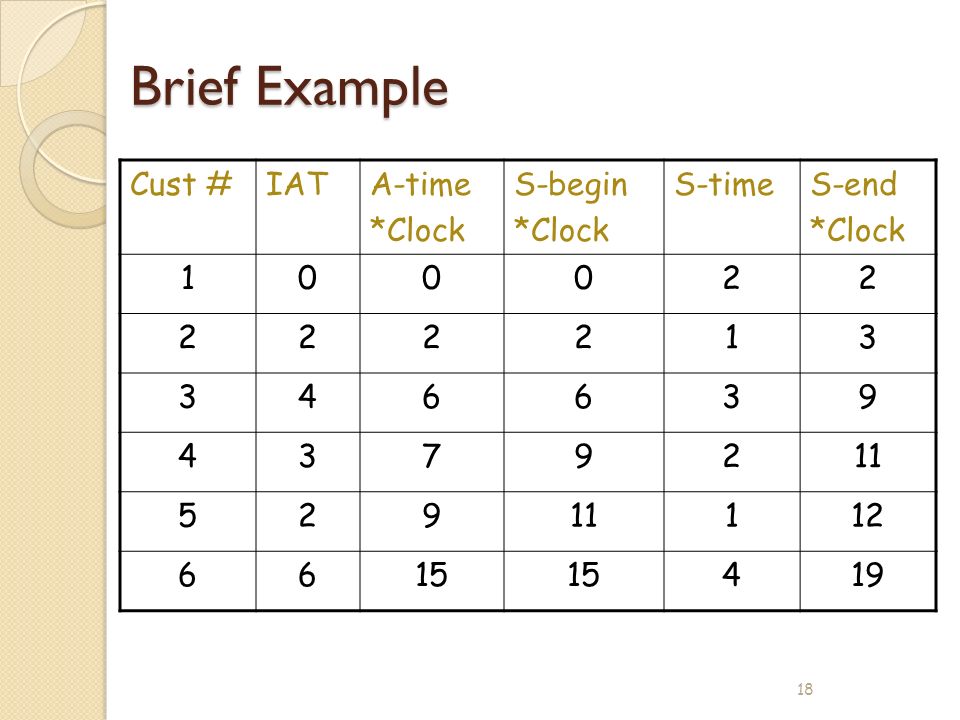
Brief Example Cust # IAT A-time *Clock S-begin S-time S-end 1 2 3 4 6
2 3 4 6 9 7 11 5 12 15 19
19
Other simulation items
What else can we keep track of during the simulation? Wait time in queue Time in system Server idle time Calculate these for previous example.

20
Other simulation items
What can we calculate at the end of simulation? Average inter-arrival time Average service time Server utilization (% busy) *Average queue length Calculate for previous example.
 *Average queue length. Calculate for previous example.")
21
Common Stats to Calculate
Customer Time in queue, Time in system, Probability of waiting in queue, Inter-arrival time Averages, max, min Server Utilization, Service times (max, min, average) Queue Length (current, average, max, min)
 Queue. Length (current, average, max, min)")
22
System State vs. Performance Measure * Current vs. After Simulation
Current queue length Server status (busy, idle) Customer wait time Average, max, min queue length Average, min, max service time; utilization Average wait time, max, min
 Customer wait time. Average, max, min queue length. Average, min, max service time; utilization. Average wait time, max, min.")
23
Simulation Statistics
Numerous standard statistics of interest Some results calculated from parameters Used to verify the simulation Most calculated by program

24
Statistics – Performance Measures
Average Wait time for a customer = total time customers wait in queue total number of customers Average wait time of those who wait = total time of customers who wait in queue number of customers who wait

25
More Statistics Proportion of server busy time
= number of time units server busy total time units of simulation Average service Time = total service time number of customers serviced

26
More Statistics Average time customer spends in system
= total time customers spend in system total number of customers Probability a customer has to wait in queue = number of customers who wait

27
Traffic Intensity A measure of the ability of the server to keep up with the number of the arrivals TI= (service mean)/(inter-arrival mean) If TI > 1 then system is unstable & queue grows without bound
/(inter-arrival mean) If TI > 1 then system is unstable & queue grows without bound.")
28
Server Utilization % of time the server is busy serving customers
If there is 1 server SU = TI = (service mean)/(inter-arrival mean) If there are N servers SU = 1/N * (service mean)/(inter-arrival mean)
/(inter-arrival mean) If there are N servers. SU = 1/N * (service mean)/(inter-arrival mean)")
29
Weighted Averages Necessary when unequal probability of values.
Example: Service times: 20% take 5 minutes, 38% take 8 minutes, 42% take 11 minutes. What is the average service time? Is it ( ) / 3 = 8 ???
 / 3 = 8")
30
Correct Answer 20% take 5 minutes, 38% take 8 minutes, 42% take 11 minutes. AST = .2 * * * 11 = = 8.66

31
Spreadsheet Homework DUE:
Page 78+ (Show all work & document) # 2: Calculate expected number of customers per day & number of bagels needed: Based in these values, what is expected cost, income, & profit. Don’t simulate. # 4: Calculate expected # of calls 9 am – 5 pm. & avg. service time. What is utilization of taxi? What is utilization if 2 taxis? Complete an Excel Simulation for 9 to 5 day with 1 taxi. (Print off values & formulas version. Document well.) #51: Calculate best case, worst case, and average case scenario for the student. What are the maximum & minimum loan amounts that he will need? Don’t simulate.
 # 2: Calculate expected number of customers per day & number of bagels needed: Based in these values, what is expected cost, income, & profit. Don’t simulate. # 4: Calculate expected # of calls 9 am – 5 pm. & avg. service time. What is utilization of taxi What is utilization if 2 taxis Complete an Excel Simulation for 9 to 5 day with 1 taxi. (Print off values & formulas version. Document well.) #51: Calculate best case, worst case, and average case scenario for the student. What are the maximum & minimum loan amounts that he will need Don’t simulate.")
Similar presentations


 Simulation>")


 4 Inventory systems (Dynamic and Static) 4 Monte-Carlo simulation.>")
 arrive at a station, wait in a line (or queue),>")


. Queueing Models Probabilistic and stochastic models Important aspects: –Interarrival time –Service time –Waiting.>")


