Download presentation
Presentation is loading. Please wait.

1
Update on Housing Market Conditions And Other Research Update on Housing Market Conditions And Other Research

2
Kevin P. Kane Chief Housing Market Analyst Economic & Market Analysis Division Special Thanks – Randall Goodnight (Ft. Worth) State of the Nation’s Housing Markets
 State of the Nation’s Housing Markets.")
3
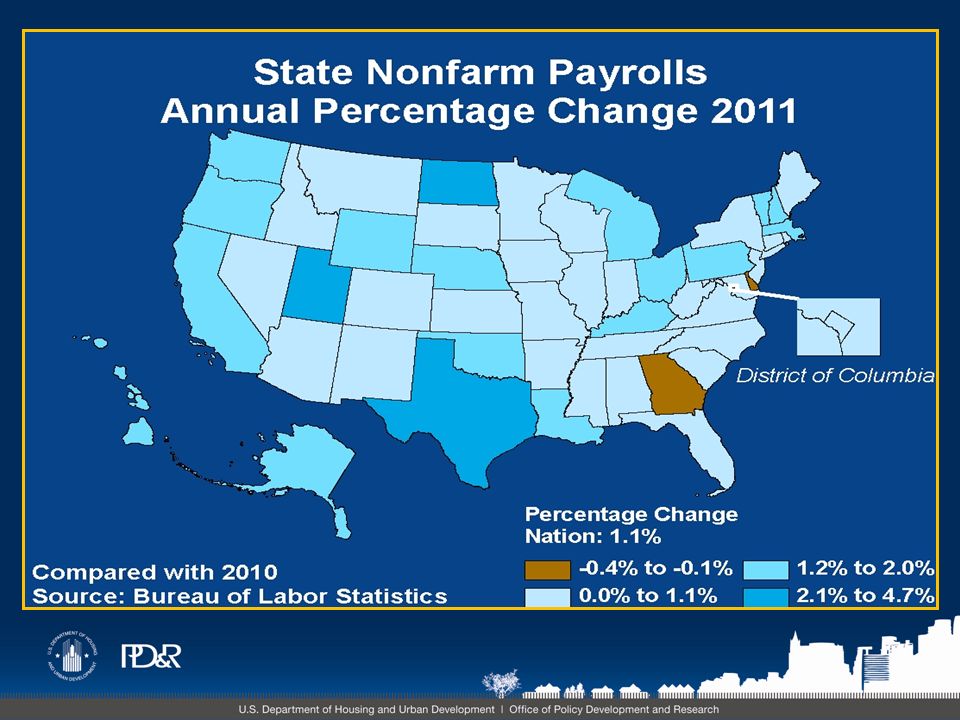
Nonfarm Payrolls Annual Average Percentage Change (12-month avg.)
")
4
Regional Nonfarm Payrolls Percentage Change 12 months ending December 2011

8
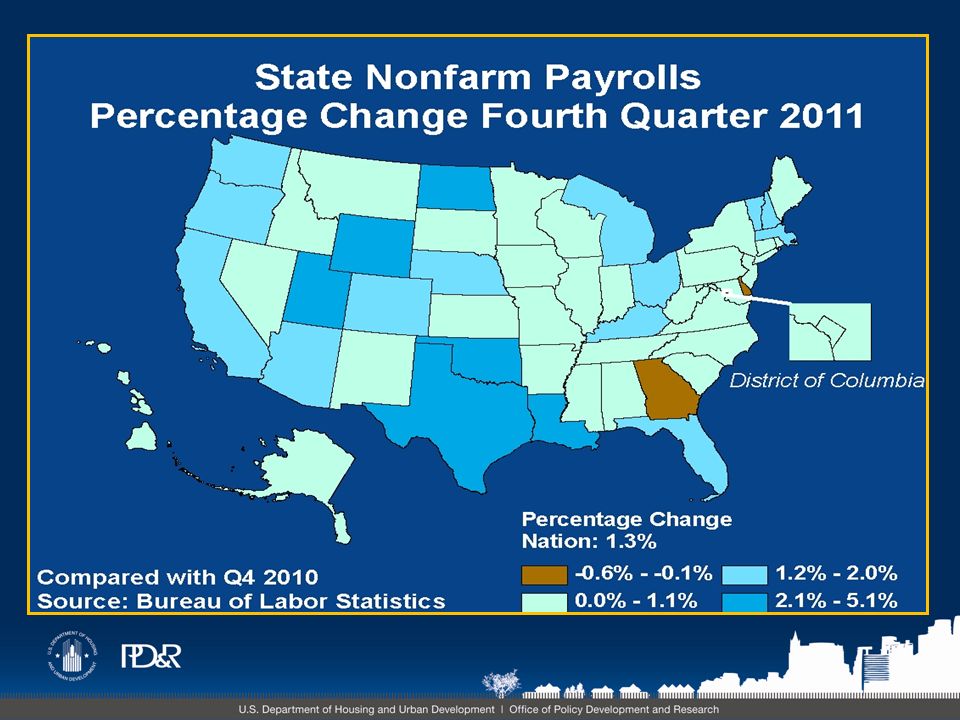
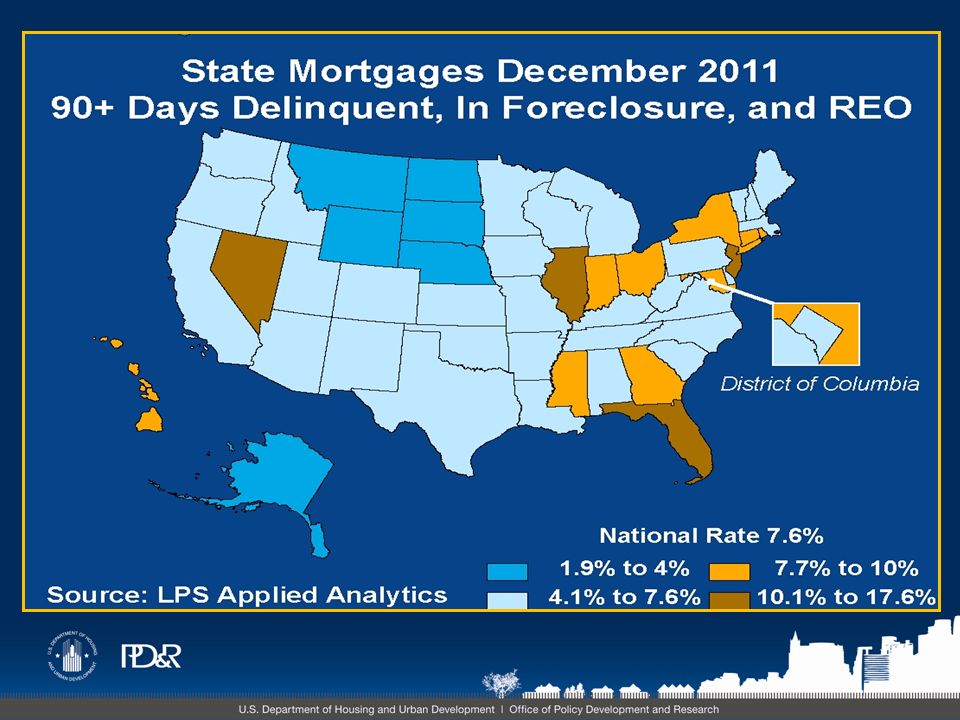
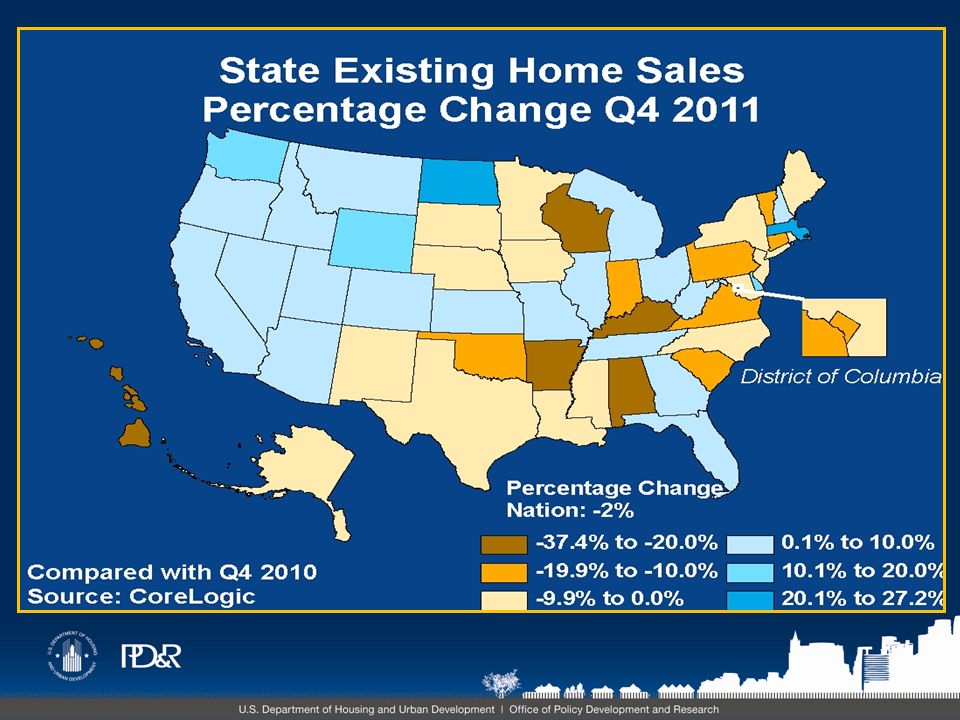
U.S. Housing Market Conditions: 4Q 2011 Sales market conditions continue to remain soft Sales market conditions continue to remain soft Year over year home sales prices continued to decline in 4Q2011 (6 straight quarters)Year over year home sales prices continued to decline in 4Q2011 (6 straight quarters) Existing home sales declined 2 percent compared with 4Q2010 (compared with 17% increase in 3Q2011)Existing home sales declined 2 percent compared with 4Q2010 (compared with 17% increase in 3Q2011)
Year over year home sales prices continued to decline in 4Q2011 (6 straight quarters) Existing home sales declined 2 percent compared with 4Q2010 (compared with 17% increase in 3Q2011)Existing home sales declined 2 percent compared with 4Q2010 (compared with 17% increase in 3Q2011).")
9
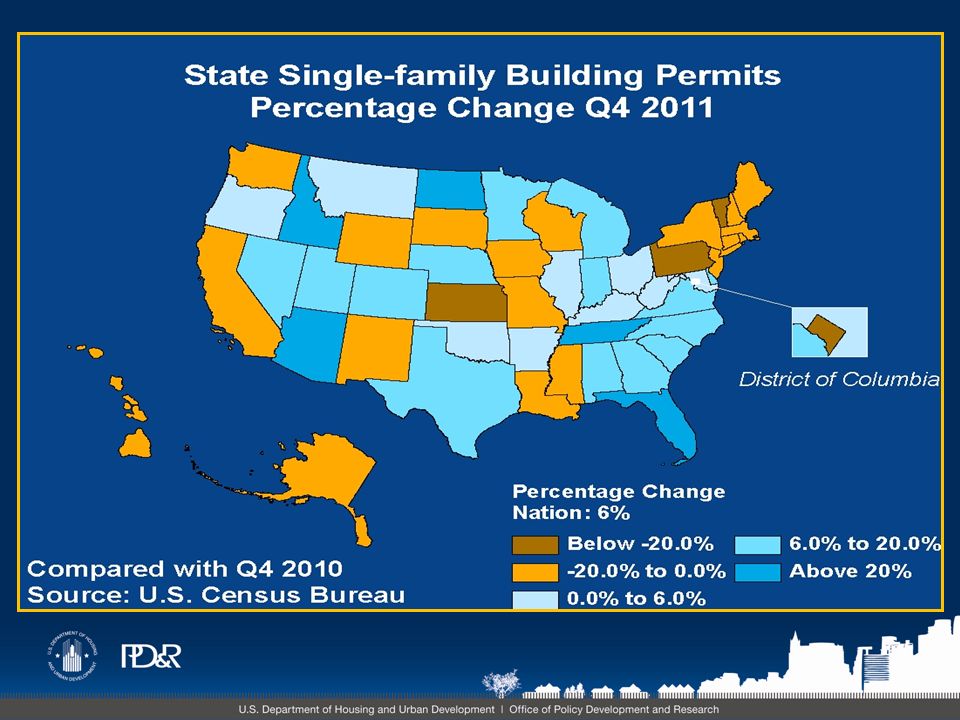
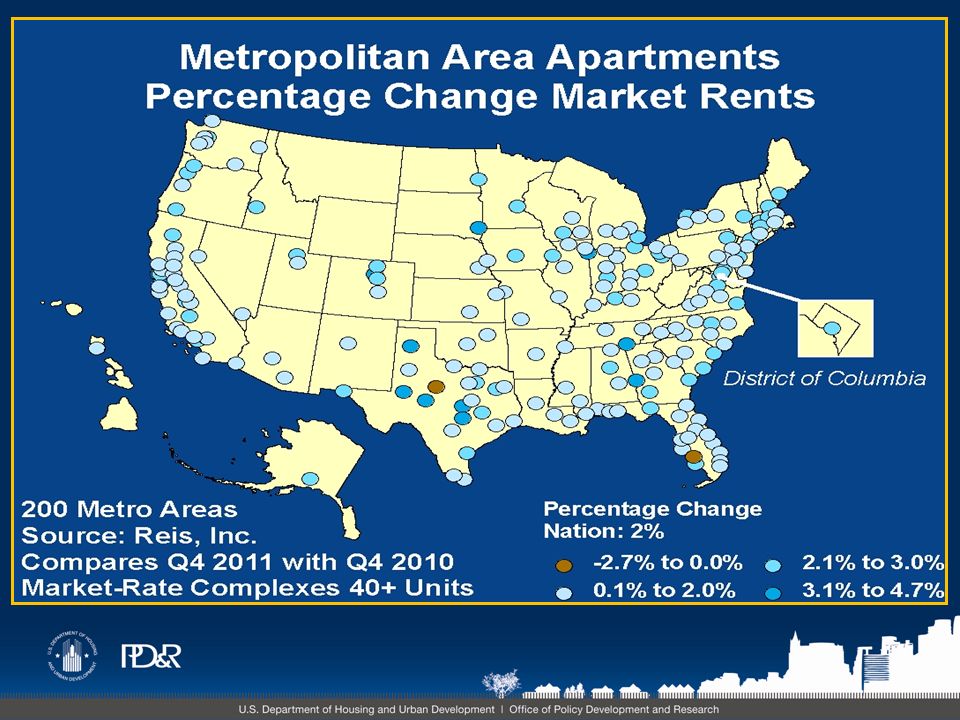
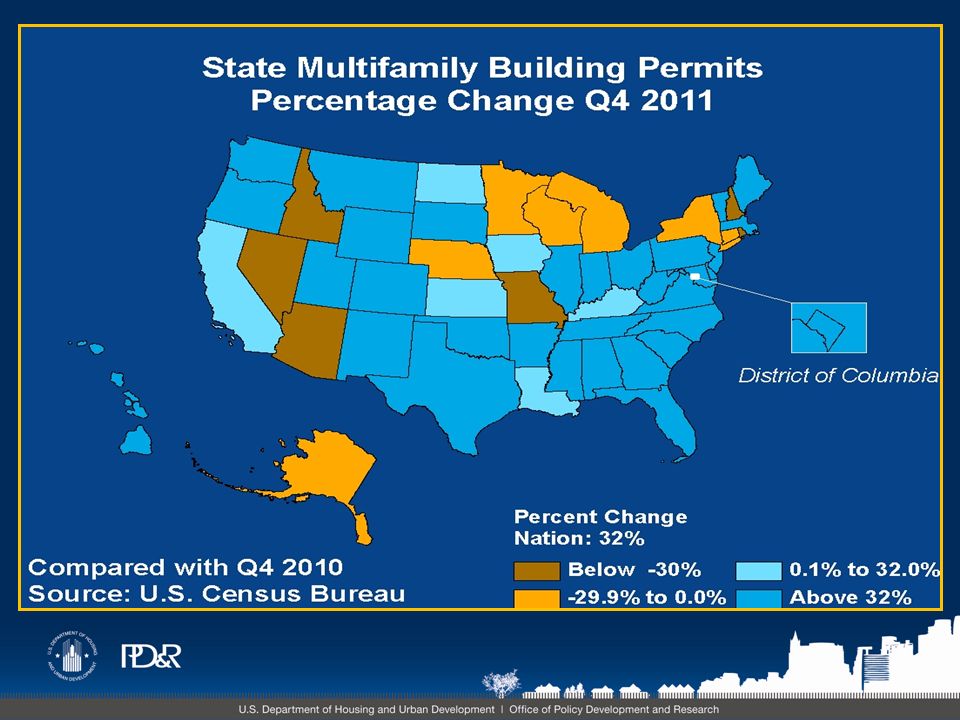
U.S. Housing Market Conditions: 4Q 2011 Inventories of new homes for sale were down 19 percentInventories of new homes for sale were down 19 percent from a year ago and down 7 percent for existing homes from a year ago and down 7 percent for existing homes Rental market conditions are balanced to tightRental market conditions are balanced to tight Apartment absorption is up slightly and the number of multifamily units permitted increased by 32 percent in 4Q2011Apartment absorption is up slightly and the number of multifamily units permitted increased by 32 percent in 4Q2011

10
Regional Conditions 4Q 2011 Region I (New England)SoftBalanced to Tight Region II (NY/NJ)SoftTight Region III (Mid-Atlantic)SoftBalanced to Tight Region IV (Southeast- Caribbean)SoftBalanced Region V (MidwestSoftBalanced to Tight Region VI (Southwest)Soft Mixed (Soft in TX- improving) Region VII (Great Plains)SoftBalanced to Tight Region VIII (Rocky Mountains)SoftBalanced to Tight Region IX (Pacific)SoftMixed (NV&AZ – soft) Region X (Northwest)SoftBalanced to Tight
SoftBalanced to Tight Region II (NY/NJ)SoftTight Region III (Mid-Atlantic)SoftBalanced to Tight Region IV (Southeast- Caribbean)SoftBalanced Region V (MidwestSoftBalanced to Tight Region VI (Southwest)Soft Mixed (Soft in TX- improving) Region VII (Great Plains)SoftBalanced to Tight Region VIII (Rocky Mountains)SoftBalanced to Tight Region IX (Pacific)SoftMixed (NV&AZ – soft) Region X (Northwest)SoftBalanced to Tight")
11
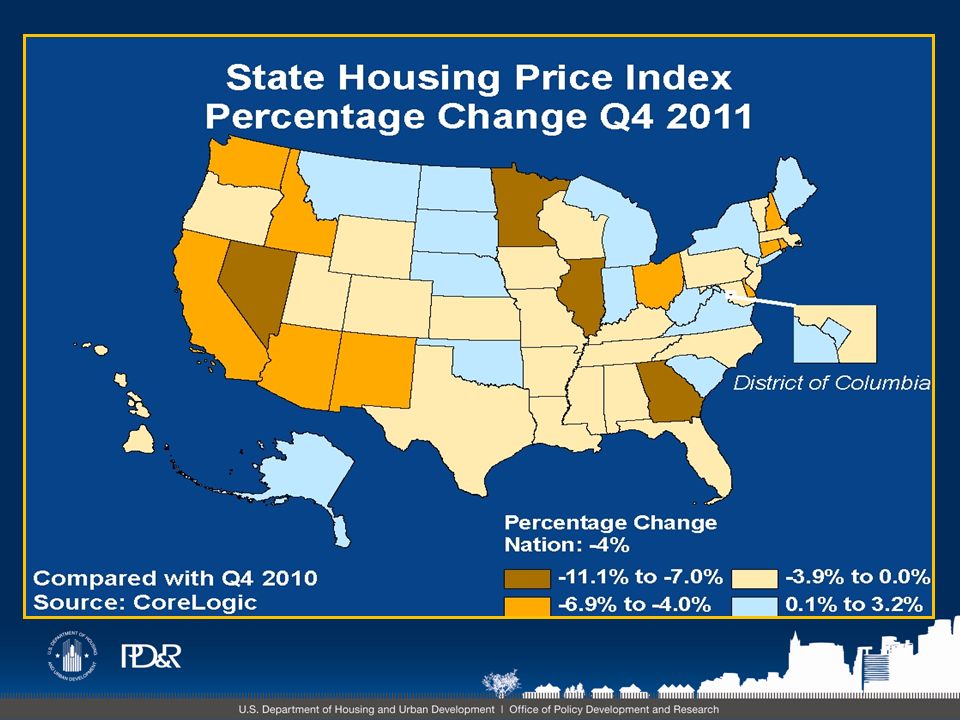
National Home Price Indices Based on Qtr. To Same Qtr. Previous Year

15
Percentage Change in SF Activity 12 Months Ending 12/10 to 12/11

19
Percentage Change in MF Activity 12 Months Ending 12/10 to 12/11

21
Summary: Year over year job growth occurred during 2011 at a rate of 1.1%. Sales Market conditions remain soft. Prices continued to decline and sales also declined slightly in 4Q2011. Rental Market conditions are balanced to tight. Rents are continuing to increase and vacancy rates arecontinuing to decline.

22
4 Contact Information: Kevin P. Kane Chief Housing Market Analyst Office of Policy Development and Research U.S. Department of Housing & Urban Development Email: kevin.p.kane@hud.gov Regional/Field Economist 4Q2011 U.S. Housing Market Conditions www.huduser.org

23
Michael Hollar Economist and Research Office of Policy Development and Research Economic Development and Public Finance Division Overview of the LIHTC Program and HUD’s LIHTC Data Collection

24
LIHTC Data Collection Overview of LIHTC Program LIHTC Property Data New LIHTC Tenant Data

25
Overview of the LIHTC Program Created in 1986 to encourage private development of low-income rental housing. Developers receive federal tax credits, which are usually sold to investors. This reduces or eliminates the need for a mortgage. Developers can receive tax credits: 1. Allocated through state competition; or 2. In conjunction with Private Activity Bond revenue.

26
Location of properties is affected by incentives and decisions of various agencies. Federal: - Congress: QCTs & DDAs - IRS State: - Housing Finance Agency: QAP - State Bond-Issuing Agency Overview of the LIHTC Program

27
HUD’s LIHTC Property Data In mid-1990’s, PD&R began collecting data from state HFAs on characteristics of LIHTC properties. The latest update includes properties placed in service through 2009. Data can be accessed at: lihtc.huduser.org

28
HUD’s LIHTC Property Data Strengths: -Only national database of LIHTC properties -Property addresses are geocoded, which facilitates tract-level analysis Weakness: - Lack of tenant detail

29
LIHTC Tenant Data Collection Housing and Economic Recovery Act (HERA) requires: 1)State HFAs must provide to HUD: Race Ethnicity Family Composition Age 2)Data must be collected at least annually and made publically available. Income Use of Rental Assistance Disability Status Monthly Rental Payments

30
Benefits of New Tenant Data Provides understanding of who the program is assisting Combined with HUD’s administrative data, provides a complete picture of subsidized programs Adds detail to property data - Number and location of buildings in property - Reliance on Rental Assistance

31
Evidence on the Spatial Distribution of Low Income Housing Tax Credits Casey Dawkins National Center for Smart Growth Urban Studies and Planning Program University of Maryland Based in part on research funded by U.S. Department of Housing and Urban Development

32
Evidence on the Geographic Location of LIHTC Properties Approximately 58 percent of all metropolitan LIHTC units are located in central cities, compared to 76 percent of other project-based federally-assisted housing units (Freeman 2004). The share of LIHTC properties constructed within suburban neighborhoods rose during the housing bubble (McClure 2006).
..")
33
Evidence on the Geographic Location of LIHTC Properties (continued) LIHTC properties tend to be located in census tracts that exhibit higher poverty rates, lower median incomes, and lower shares of non-Hispanic white residents (Freeman 2004; Khadduri, Buron, and Climaco 2006; Ellen, et al. 2009). The location of LIHTC properties in a given census tract increases the likelihood of LIHTC properties being located in nearby census tracts (Oakley 2008).
. The location of LIHTC properties in a given census tract increases the likelihood of LIHTC properties being located in nearby census tracts (Oakley 2008)..")
34
Boston SOURCE: Dawkins, Casey. 2011. Exploring the Spatial Distribution of Low Income Housing Tax Credit Properties. U.S. Department of Housing and Urban Development, Washington, DC. Accessible at www.huduser.org.

35
Houston SOURCE: Dawkins, Casey. 2011. Exploring the Spatial Distribution of Low Income Housing Tax Credit Properties. U.S. Department of Housing and Urban Development, Washington, DC. Accessible at www.huduser.org.

36
Evidence on LIHTC Spatial Clustering LIHTC properties are clustered over long radial distances, although the extent of clustering differs by metropolitan area. LIHTC clusters tend to be located in more densely- developed central city locations that have higher poverty rates and lower shares of non-Hispanic whites.

37
Evidence on LIHTC Spatial Clustering (continued) Clustered LIHTC properties are more likely to be located in QCTs and DDAs in most metropolitan areas. Houston is unique - Few LIHTC properties are located in clusters - Clustered properties are located in lower-density census tracts, outside of central cities, with relatively lower poverty rates and higher shares of non-Hispanic whites - Fewer clustered properties are located in QCTs and DDAs

38
Contact Information: Casey Dawkins National Center for Smart Growth Urban Studies and Planning Program University of Maryland dawkins1@umd.edu

39
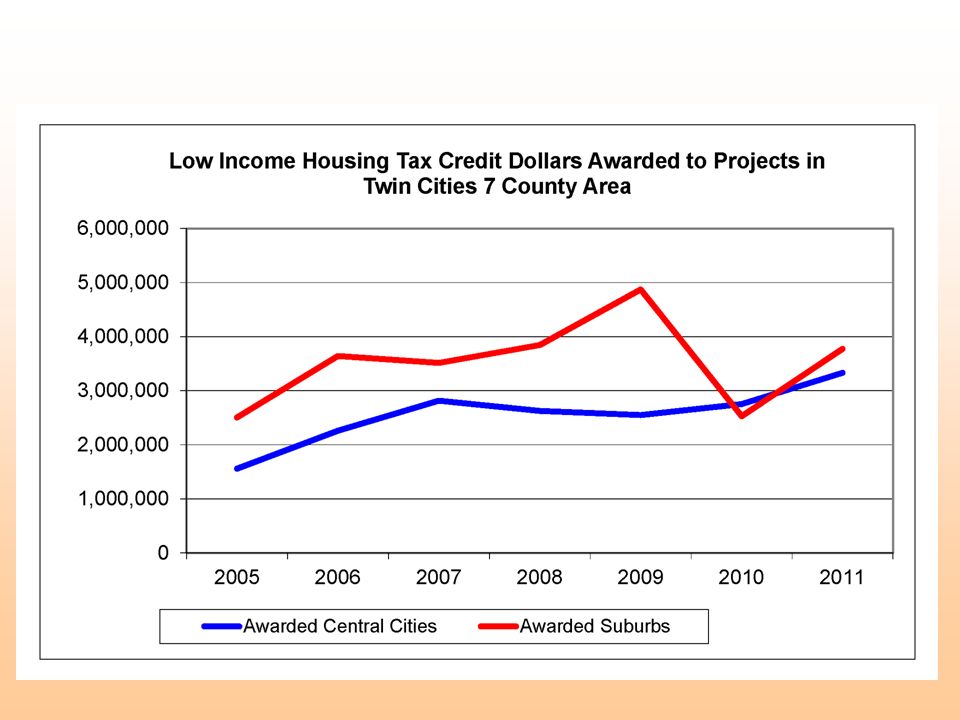
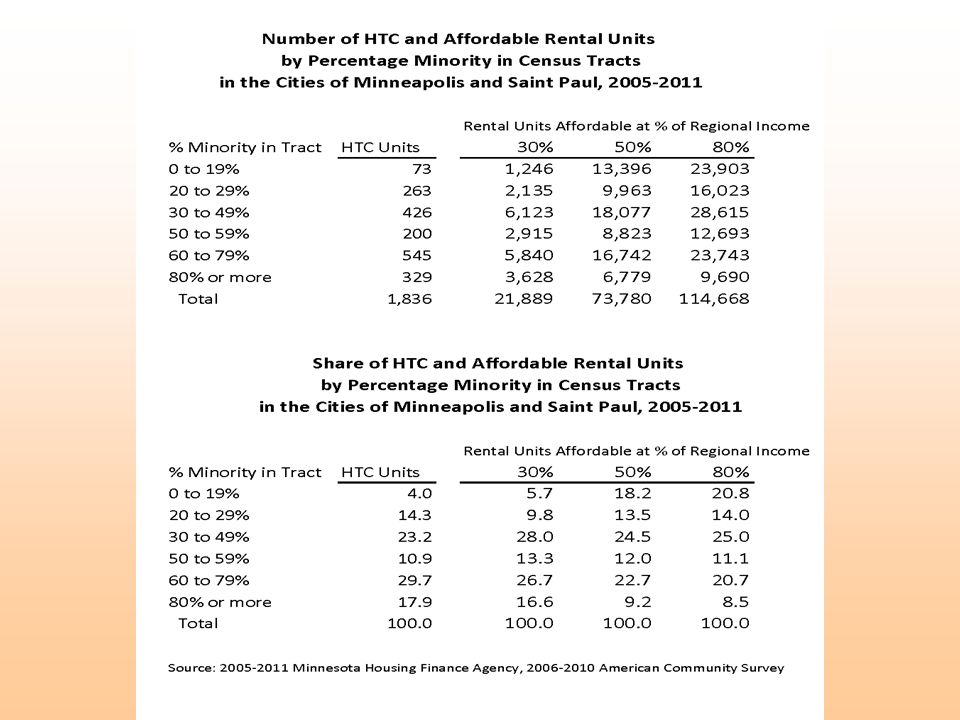
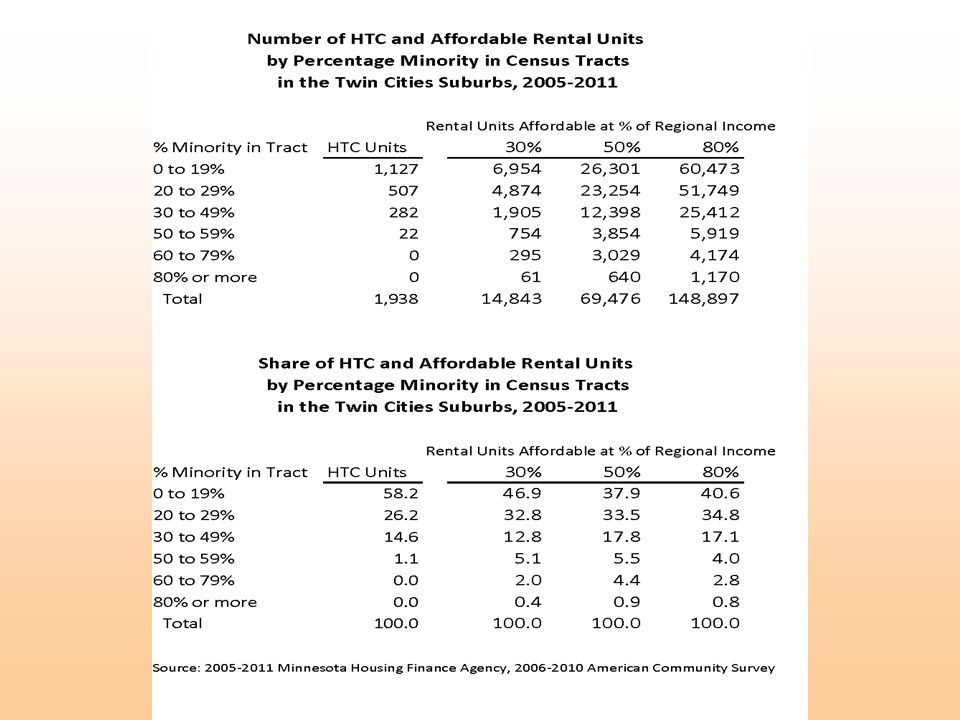
School and Housing Demographics in the Twin Cities Myron Orfield March 22, 2012

53
Considerations for HUD, Researchers, and Advocates Mark Shelburne PD&R Quarterly Briefing March 22, 2012

54
Background Appreciate the opportunity and premise not an education of HFAs we can all learn from each other Covering two main areas: shortcomings in research on LIHTCs thoughts for advocacy groups Introduction

55
Not speaking for all HFAs, just myself Caution due to legal actions litigation in three states complaints and audits in others Omitting some concepts for sake of time Disclaimers

56
Several studies critique LIHTCs, e.g. Dawkins 2011 “Spatial Distribution…” UCLA 2009 report on California Abt’s 2006 “Are States…” report Assume all units are sited by LIHTCs Inaccurate for two main reasons: rehabilitation and HOPE VI / public housing redevelopment Concerns with Research

57
LIHTCs fund both (1) new construction and (2) rehabilitation of existing housing With rehab the units were already in place when funded by the state HFA LIHTCs had no role in their location Rehabs should be excluded from any analysis of whether program concentrates Yet were included in studies critiquing Rehabilitation
 new construction and (2) rehabilitation of existing housing With rehab the units were already in place when funded by the state HFA LIHTCs had no role in their location Rehabs should be excluded from any analysis of whether program concentrates Yet were included in studies critiquing Rehabilitation")
58
Excluding rehab would matter for results Example MSAs from Dawkins paper: in Boston 69% of the units were rehab Chicago were 61% rehab Abt study mentions Conn., >70% rehab Similar results in other areas Many are project-based Section 8 or in another HUD program Significance of Rehab %

59
A material % of new const. LIHTC units in many metro areas are HOPE VI When replacing a unit of public housing, the net effect on concentration is zero Yet studies count LIHTCs as an increase, with no offset or even mention of net Same shortcoming as rehab: housing was there before and after LIHTCs HOPE VI / Public Housing

60
Acting on studies’ conclusions would mean reduced support for HUD priorities: Rehab of rent-assisted portfolio Leverage for public housing redevelopment Problems with methodology mean the studies should not inform policymaking Lack of research (based on the right units) showing LIHTCs exacerbate concentrations Consequences
 showing LIHTCs exacerbate concentrations Consequences")
61
Effect on segregation is very complicated 2011 NYU Wagner School paper asked where HHs would have lived otherwise relative %s between HHs and surroundings neighborhood change over time Conclusion: evidence suggests LIHTC units do not contribute to increased segregation, even in high poverty areas Other Questions

62
HFAs have the essentially the same goals Challenge for any QAP policy are trade-offs and implementation: conflicting objectives with local CDCs benefit of relocating vs. staying in community finding affordable sites with zoning (NIMBY) IRC Sec. 42 required preference for QCTs 5 th Cir. opinion on race-based approach limited/unusable data Advocacy Groups
 IRC Sec. 42 required preference for QCTs 5 th Cir. opinion on race-based approach limited/unusable data Advocacy Groups.")
63
See HFAs as partners Understand our concerns and limitations Accept policy change takes time (years) and effort, even at state level Consult with other groups for how to make approach (e.g. preservation, green) posting to a website is not enough need productive, cooperative outreach Suggestions
 posting to a website is not enough need productive, cooperative outreach Suggestions.")
64
Mark Shelburne Counsel and Policy Coordinator North Carolina Housing Finance Agency mhshelburne@nchfa.com Contact Information :

Similar presentations


 with Section 8 Voucher Program ---- A Regional Difference.>")


