Download presentation
Presentation is loading. Please wait.

1
State of the Nation’s Housing Markets 2 nd Quarter 2010 Update Kevin P. Kane Chief Housing Market Analyst Office of Policy Development and Research Special Thanks – Randall Goodnight (Ft. Worth)
.")
2
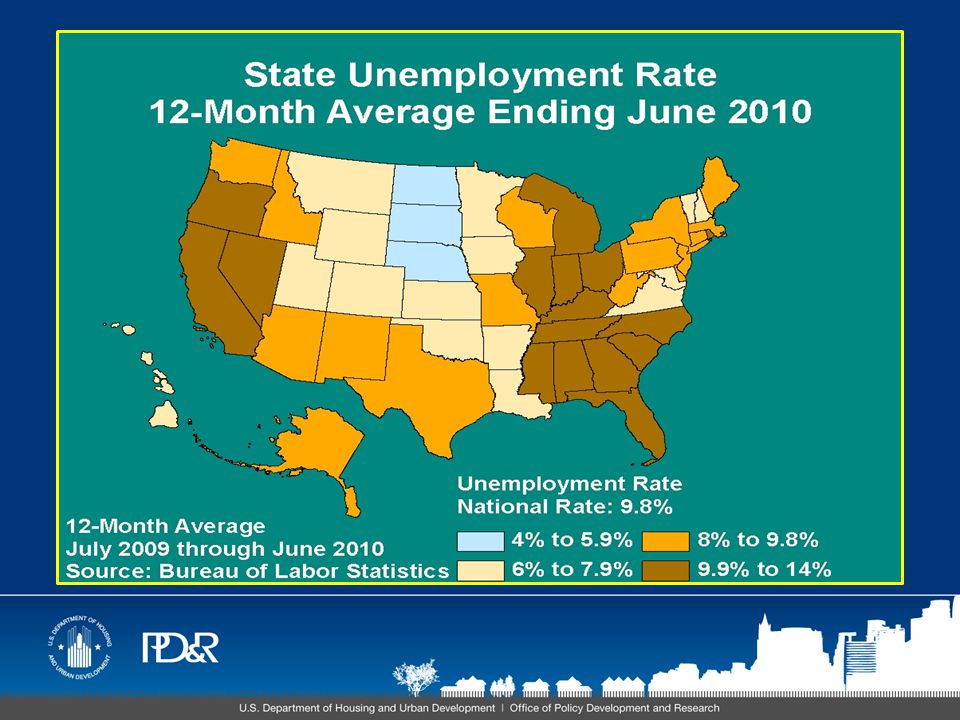
Nonfarm Payrolls 12-month Averages

3
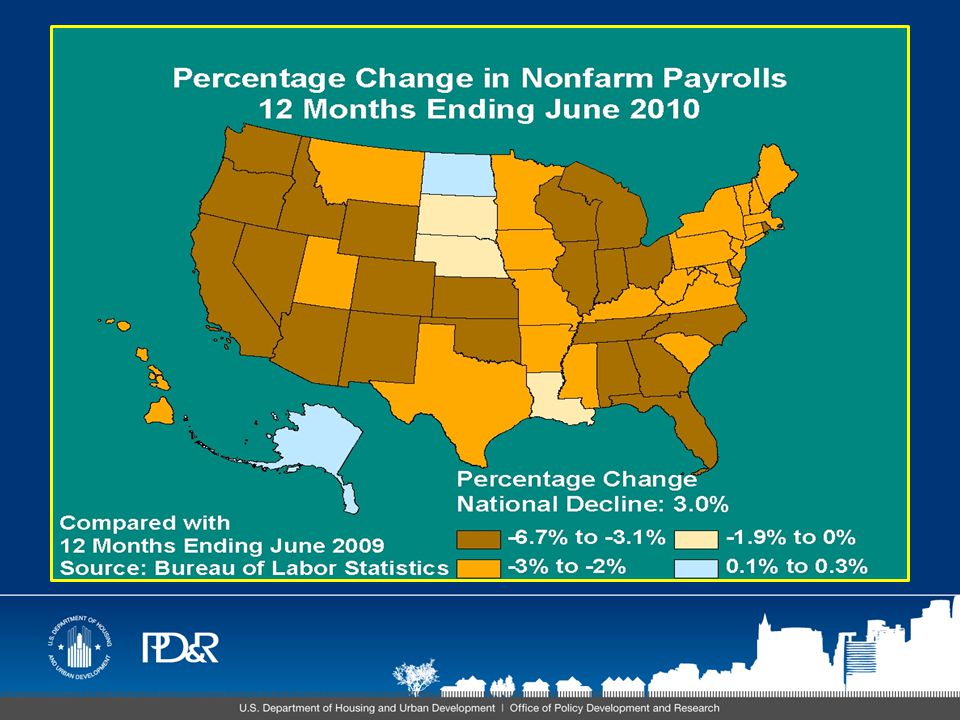
Nonfarm Payrolls Annual Percentage Change (12-month avg.)
")
4
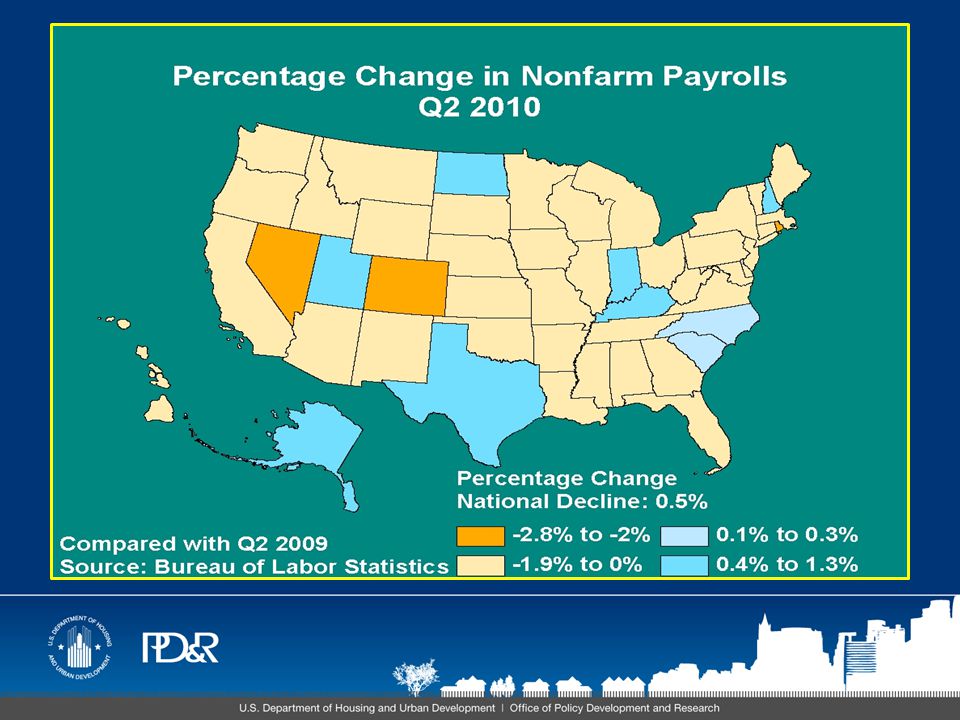
Regional Nonfarm Payrolls Percentage Change 12 months ending June 2010

7
Nonfarm Change by Sector Percentage Change 12 months ending June 2010

10
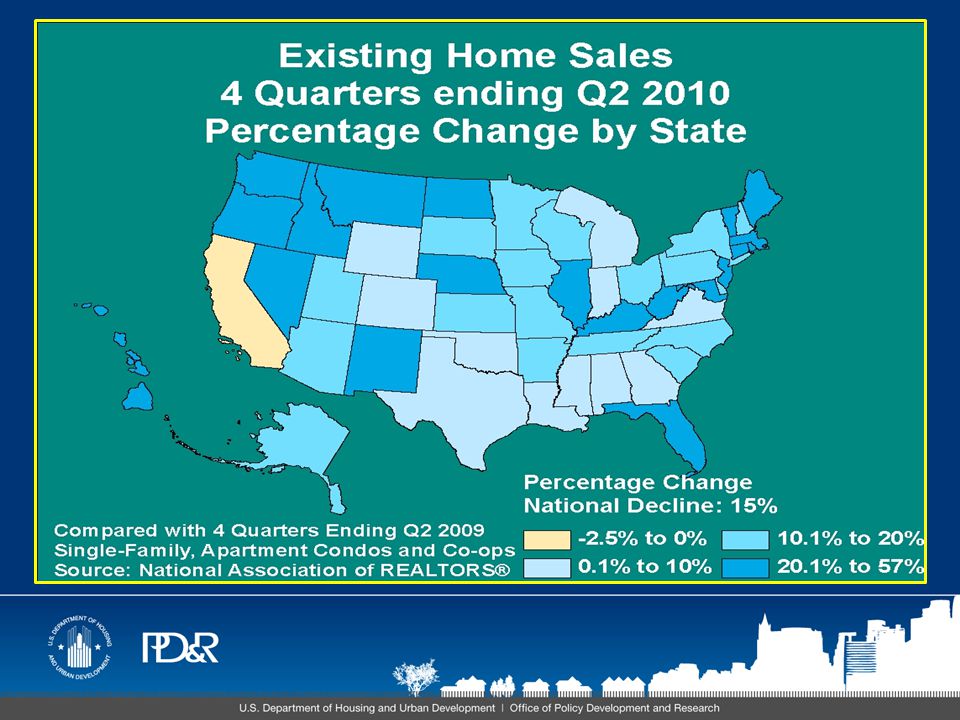
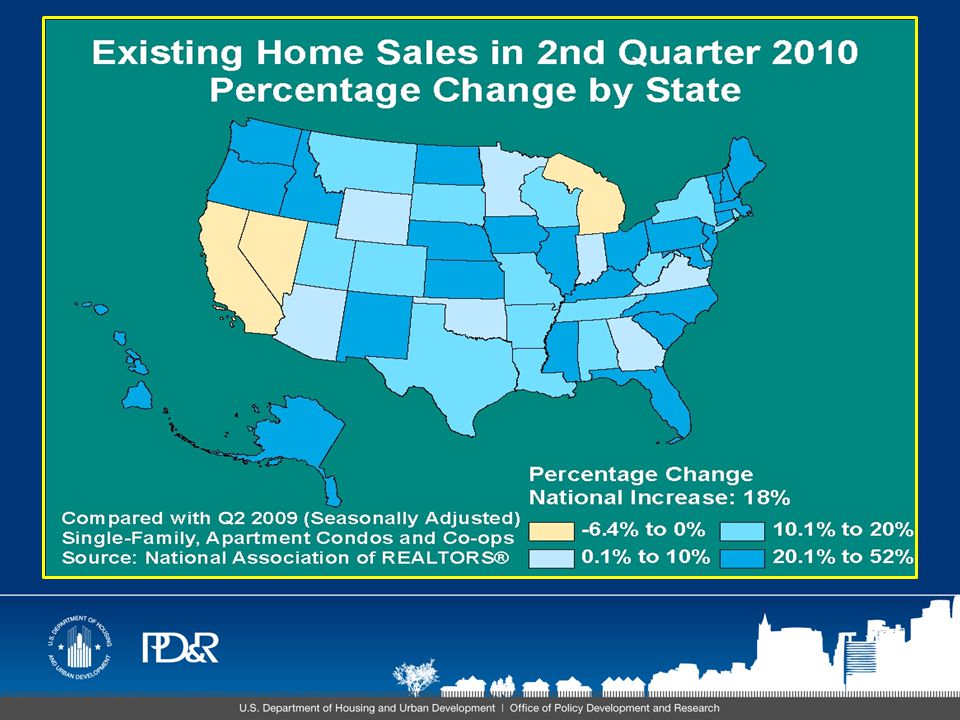
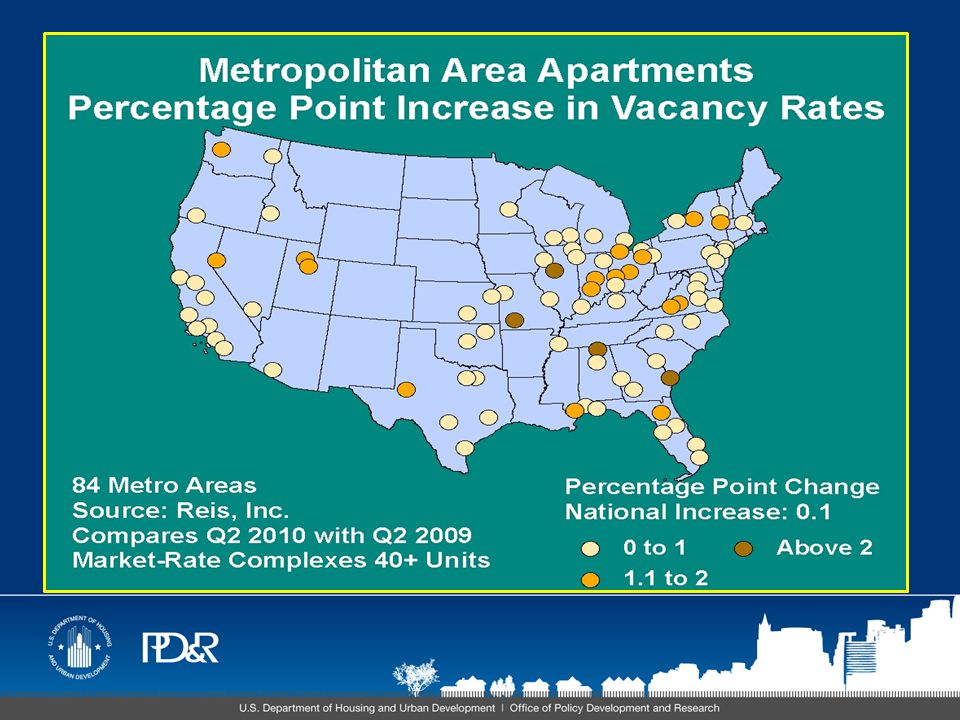
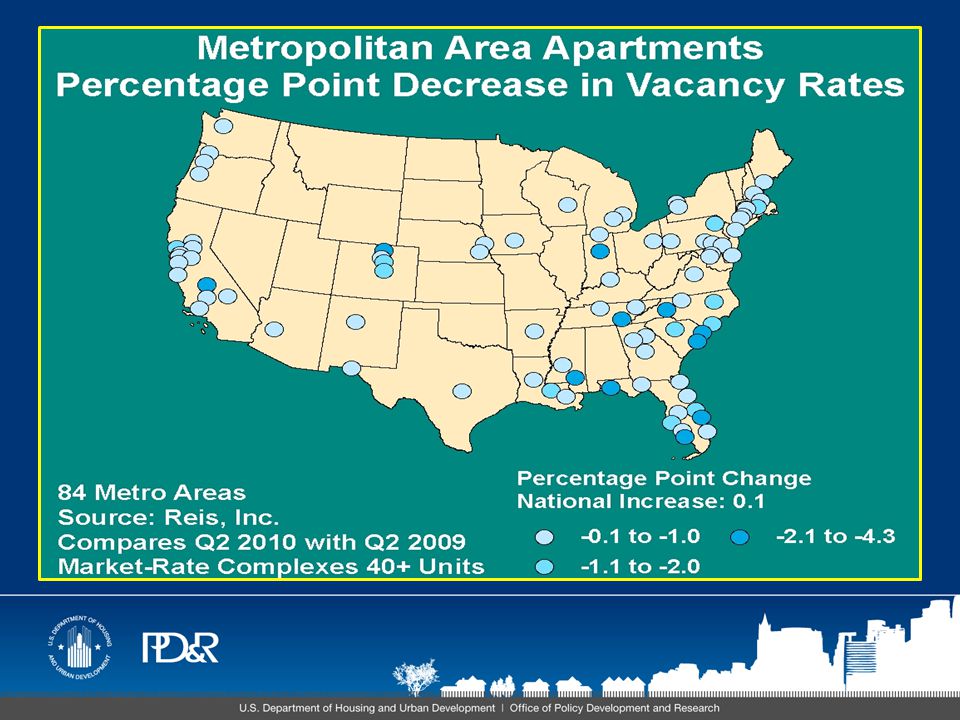
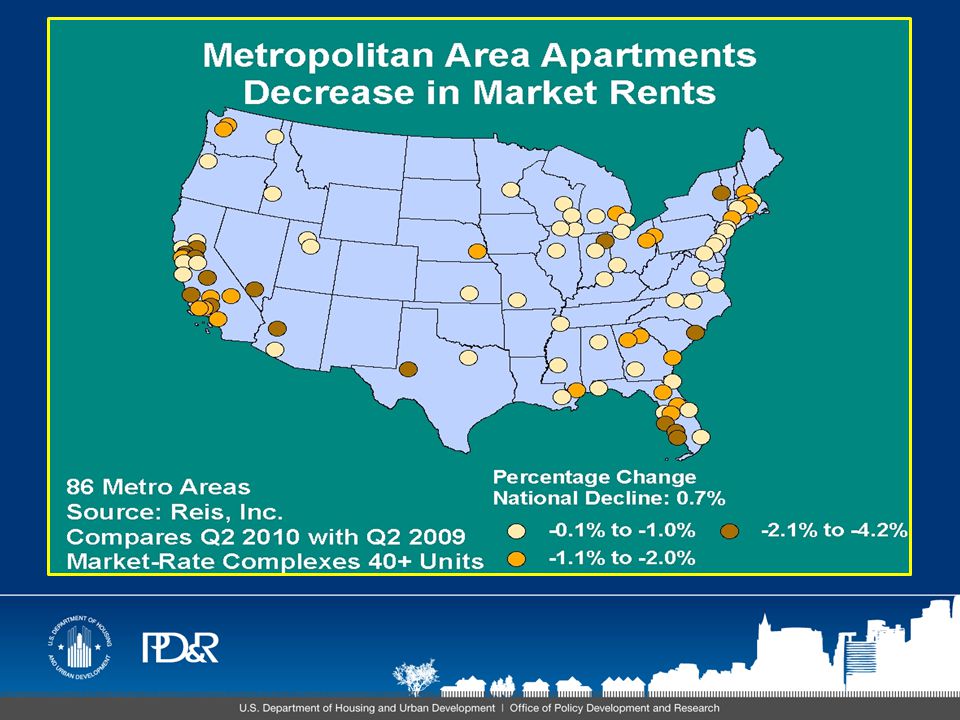
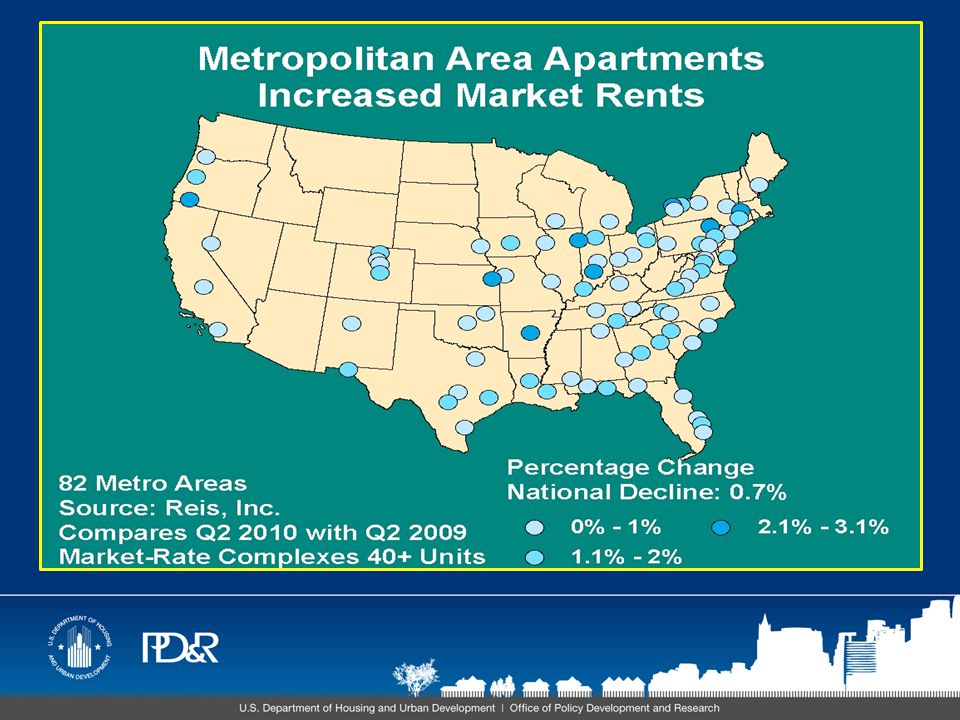
U.S. Housing Market Conditions: 2Q 2010 Sales market conditions remain soft in much of the country Sales market conditions remain soft in much of the country but continue to improve in many areas but continue to improve in many areas Data on home sales prices indicate improvementData on home sales prices indicate improvement Home sales are up (homebuyer tax credit)Home sales are up (homebuyer tax credit) Inventories of new and existing homes for sale are downInventories of new and existing homes for sale are down from a year ago and coming closer to balance from a year ago and coming closer to balance Rental market conditions are mixed throughout the countryRental market conditions are mixed throughout the country Significant declines in multifamily permits have continuedSignificant declines in multifamily permits have continued
Home sales are up (homebuyer tax credit) Inventories of new and existing homes for sale are downInventories of new and existing homes for sale are down from a year ago and coming closer to balance from a year ago and coming closer to balance Rental market conditions are mixed throughout the countryRental market conditions are mixed throughout the country Significant declines in multifamily permits have continuedSignificant declines in multifamily permits have continued.")
11
Regional Conditions 2Q 2010 Sales MarketsRental Markets Region I (New England)Balanced Region II (NY/NJ)Slightly SoftBalanced (NYC Tight) Region III (Mid-AtlanticSlightly SoftMixed Region IV (Southeast- Caribbean)Soft Region V (MidwestSoftMixed (soft/balanced) Region VI (Southwest)Slightly SoftSoft Region VII (Great Plains)Balanced (Soft in MO)Soft Region VIII (Rocky Mountains)SoftMixed Region IX (Pacific)SoftMixed Region X (Northwest)SoftBalanced
Balanced Region II (NY/NJ)Slightly SoftBalanced (NYC Tight) Region III (Mid-AtlanticSlightly SoftMixed Region IV (Southeast- Caribbean)Soft Region V (MidwestSoftMixed (soft/balanced) Region VI (Southwest)Slightly SoftSoft Region VII (Great Plains)Balanced (Soft in MO)Soft Region VIII (Rocky Mountains)SoftMixed Region IX (Pacific)SoftMixed Region X (Northwest)SoftBalanced")
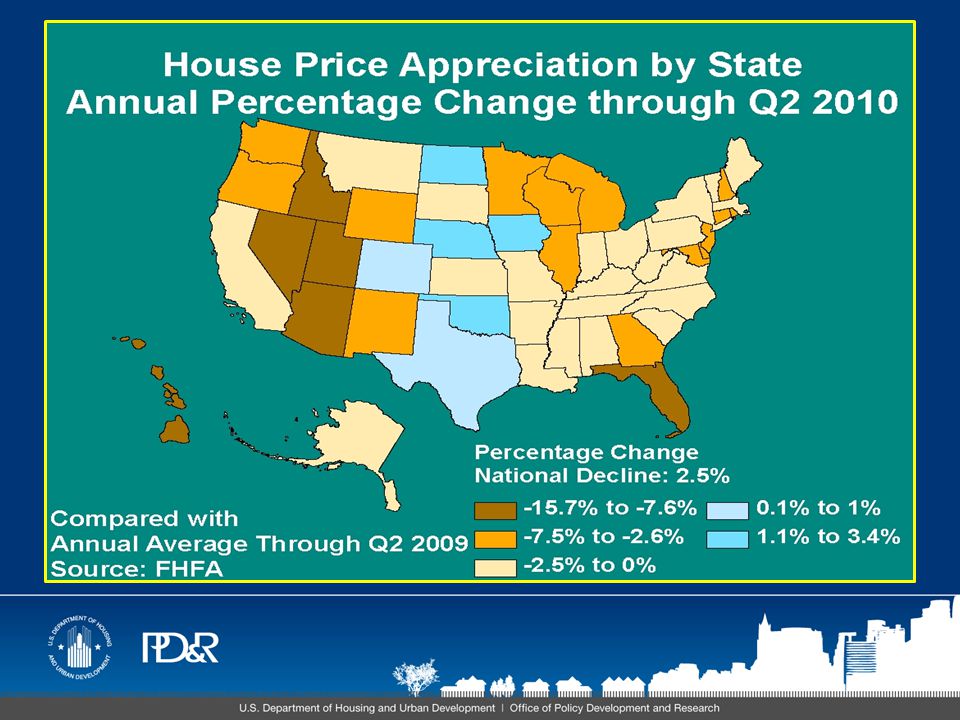
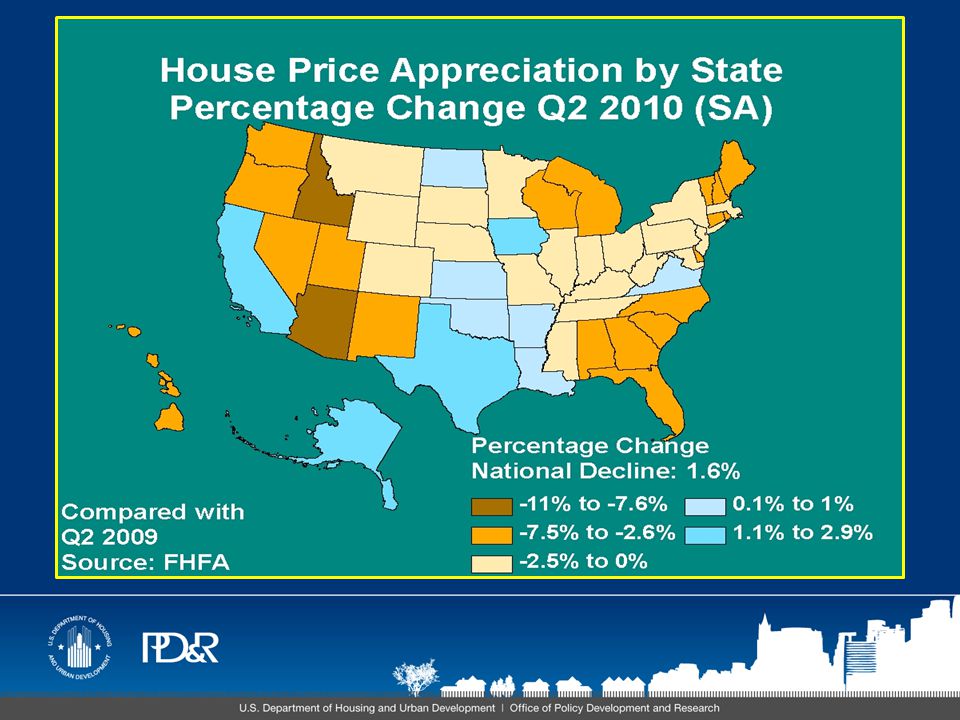
12
National Home Price Indices Based on Qtr. To Same Qtr. Previous Year

19
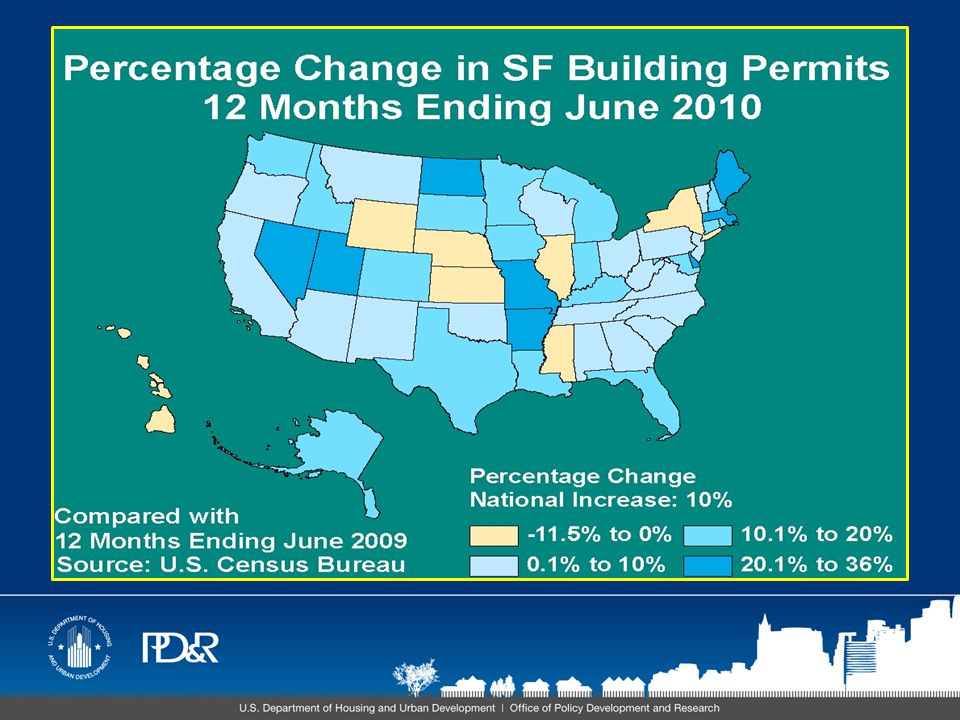
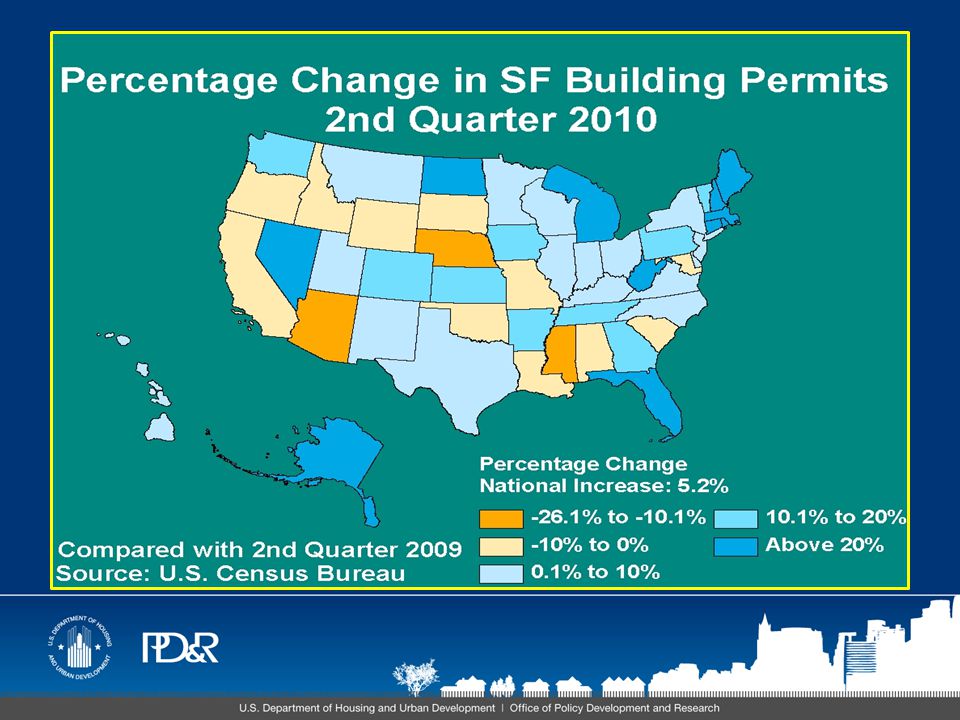
SF Permit Activity During 12 Months Ending

20
Percentage Change in SF Activity 12 Months Ending 6/09 to 6/10

27
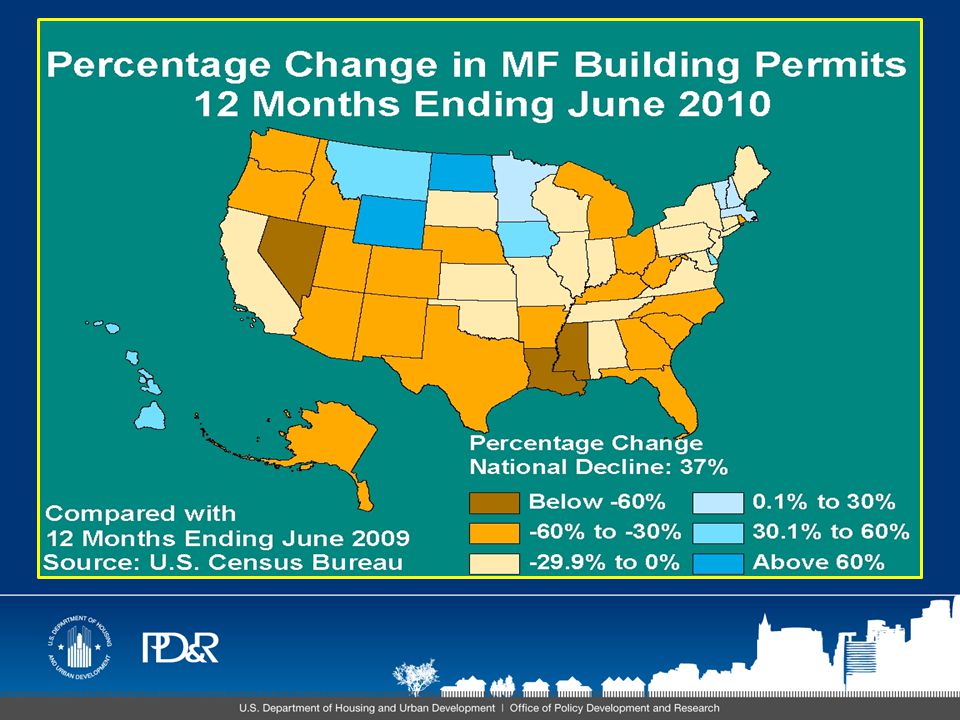
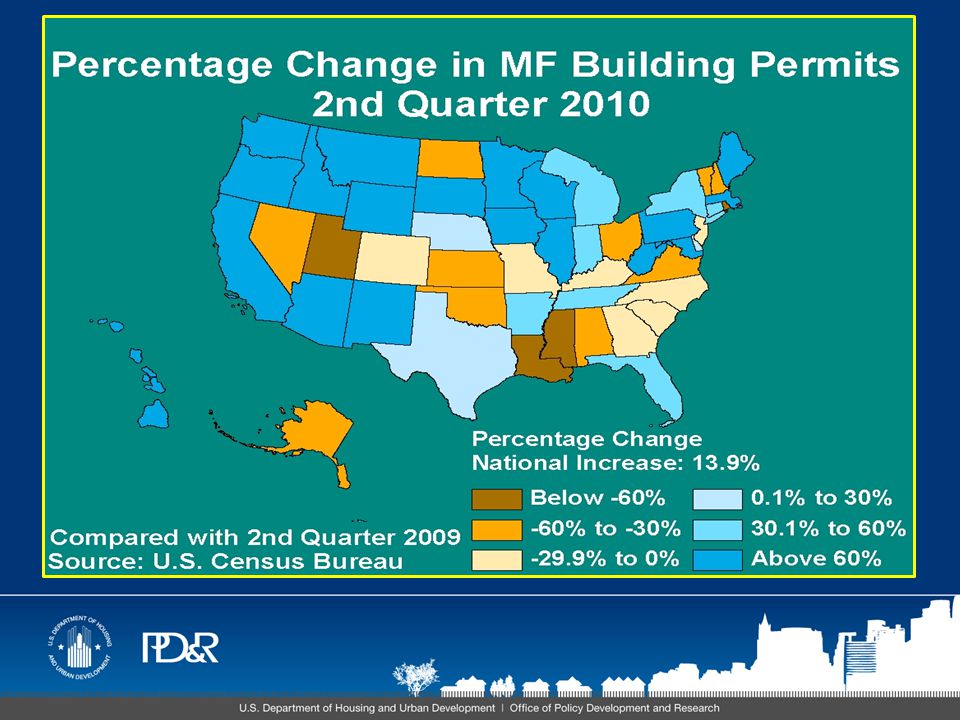
MF Permit Activity During 12 Months Ending

28
Percentage Change in MF Activity 12 Months Ending 6/09 to 6/10

31
For additional information: U.S. Housing Market Conditions Report 2Q 2010 available at www.huduser.org Contact your local Regional or Field Economist Contact me at kevin.p.kane@hud.gov

Similar presentations


 Mapping Project - 2005.>")


