Download presentation
Presentation is loading. Please wait.

1
AOSC 200 Lesson 12

2
Past and present climates weather - short time fluctuations climate – long-term behavior - location - time - average and extremes climate controls - latitude - elevation - topography - proximity to large bodies of water - atmospheric circulation

3
THE CHANGING CLIMATE Climate involves more than just the atmosphere. Climate may be broadly defined as the long-term behavior of global environmental system “To understand fully and to predict changes in the atmospheric component of the climate system. one must first understand the sun, oceans, ice sheets, solid earth, and all forms of life" Thus we talk about a climate system consisting of the atmosphere, hydrosphere, solid earth, biosphere and cryosphere. Climate system involves the exchange of energy and moisture among these components

4
Fig. 14-3, p. 414

5
Climate Zones In the three cell model discussed before the intersections were shown at 30 and 60 degrees latitude. However these intersections move over the year. In the winter they move South. In the summer they move North. This is because the axis of rotation of the earth is tilted with respect to the sun-earth plane. Seasons. This gives a variation in the climate at any latitude. A variation can also be induced by other effects.

6
Effect of the Olympic Mountains on average annual rainfall. Rain Shadow effect

7
Annual precipitation for three cities across the US

8
CLIMATE ZONES VLADIMAR KOPPEN ZONES TROPICAL MOIST – A DRY – B MOIST WITH MILD WINTERS – C MOIST WITH SEVERE WINTERS – D POLAR – E HIGHLAND – H

9
Fig. 14-2, p. 413 World map of the Kopper climate classification scheme

10
Tropical Humid Climates - A High mean monthly temperature, at least 18.3 C. Rage of temperature is small, less than 10 degrees. Divided into three sub-types Tropical wet climates (Af) Tropical wet and dry climates (Aw) Tropical monsoon climates (Am)
 Tropical wet and dry climates (Aw) Tropical monsoon climates (Am).")
11
Fig. 14.4 Tropical Humid Climates Iquitos, Peru (Af), Pirenopolis, Brazil, Aw, Rochambeau French Guiana, Am
, Pirenopolis, Brazil, Aw, Rochambeau French Guiana, Am.")
12
Tropical rain forest near Iquitos, Peru, (Af)
")
13
Baobob and Acacia trees in grassland savanna (Aw)
")
14
Dry Climates Evaporation plus transpiration exceeds precipitation. Descending branch of the Hadley cell. Mainly over land, diurnal variation larger than annual variation. Two subtypes Steppe or semi-arid (BS) Arid or desert (BW) BSh and BWh are warm dry climates BSk and BWk are cold dry climates
 Arid or desert (BW) BSh and BWh are warm dry climates BSk and BWk are cold dry climates.")
15
Fig. 14.5 Dry Subtropical Climates Dakar, Senegal BSh, Cairo, Egypt BWh

16
Fig. 14.6 Warm Dry Climates San Diego, Calif.BSk, Santa Cruz, Argentina, BWk

17
Rain streamers are common in warm dry climates. Rain evaporates before it reaches the ground.

18
Creosote bushes and cactus in the arid southwestern deserts (BWh)
")
19
Steppe grasslands of western North America (BS)
")
20
Moist Subtropical and Midlatitude Climates Characterized by humid and mild winters. Lie between the tropics and mid-latitudes Three major subgroups Marine West Coast Cfb and Cfc Humid Subtropical Cfa and Cwa Mediterranean Csa or Csb

21
Fig. 14.7 Marine West Coast Cfb, Cfc Bergen, Norway Cfb, Reykjavik, Iceland Cfc

22
Fig. 14.8 Humid Subtropical Cfa, Cwa New Orleans, Louisiana, Cfa, Hong Kong China, Cwa

23
Fig. 14.9 Mediterranean, Csa, Csb Lisbon, Portugal, Csa, Santiago, Chile, Csb

24
Mediterranean-type climate of North America. Chaparral : foothill pine, chamise and manzanita.

25
Severe Midlatitude Climates, D Tend to be located in the eastern regions of continents. Temperature range is generally greater than seen in the western climates (C) To be classified as D the average cold temperature must be less than -3 C, and the average summer temperature must exceed +10 C. Two basic types Humid Continental (Dfa/b and Dwa/b) Subarctic (Dfc/d and Dwc/d) a,b,c, - hot summers, d - severe winter and cold summer
 To be classified as D the average cold temperature must be less than -3 C, and the average summer temperature must exceed +10 C. Two basic types Humid Continental (Dfa/b and Dwa/b) Subarctic (Dfc/d and Dwc/d) a,b,c, - hot summers, d - severe winter and cold summer.")
26
Fig. 14.10 Humid Continental Vladosvostok, Russia Dwb, Fargo, North Dakota, Dfb

27
Adirondack Park - humid continental climate (Dfa)
")
28
Fig. 14.11 Subarctic Fairbanks, Alaska, Dfc, Verkhoyansk, Siberia, Dfd

29
Coniferous forests occur where winter temperatures are low and precipitation is abundant (Dfc)
")
30
Polar Climates, E Occur poleward of the Arctic and Antarctic circles Mean temperatures are less than 10 C for all months. Annual precipitation is less than 10 inches. Two polar climate types are identified Tundra (ET) and Ice Caps (EF) EF have essentially no vegetation
 and Ice Caps (EF) EF have essentially no vegetation.")
31
Fig. 14.12 Polar Climates, E Barrow, Alaska, ET, Eismitte, Greenland, EF

32
Tundra vegetation in Alaska – sedges and dwarfed wildflowers (ET)
")
33
Highland climate (H)
")
34
DETECTING CLIMATE CHANGE DIFFICULT TO DETECT CLIMATE CHANGE EXCEPT OVER LONG PERIODS OF TIME. INSTRUMENTAL RECORDS GO BACK ONLY A COUPLE OF CENTURIES. THE FURTHER BACK, THE LESS RELIABLE ARE THE DATA. SCIENTISTS MUST DECIPHER CHANGES FROM INDIRECT EVIDENCE HISTORICAL DOCUMENTS TREE RINGS POLLEN RECORDS GLACIAL ICE – AIR BUBBLES AND DUST SEA-FLOOR, MATINE SEDIMENTS. OXYGEN ISOTOPE RATIOS IN FOSSIL SHELLS FOSSIL RECORDS

35
CLIMATE CLUES

36
Fig. 14-14, p. 422 Cave drawing from the Sahara Desert

37
TREE RINGS In regions with distinct growing seasons, trees growth appears as distinct rings. Typically one ring per year. Dendrochronology Width of the ring is a function of available water, temperature, and solar radiation. Tree species have different responses to these three factors – hence the factors can be separated by looking at different species

38
TREE RINGS

39
Fig. 14-16, p. 423 Plot of annual precipitation in Iowa derived from the analysis of tree rings

40
POLLEN RECORDS Pollen degrades slowly and each species can be identified by the shape of its pollen Radioactive carbon dating gives the age of the pollen. As the climate changes, different types of species become dominant Hence the pollen record can be used to identify the type of climate that existed

41
POLLEN RECORDS

42
ICE SHEETS Each year snow falls on the ice sheets and glaciers. As it accumulates it compresses and traps air bubbles. These bubbles of air trapped in ice can be analyzed to determine atmospheric composition. Glaciers that exist today can hold bubbles that are tens or hundreds of thousand of years old. Dust in the ice sheets can be caused by climate- changing volcanoes, or dry windy conditions that lead to soil erosion. Find that the colder periods of the Earth history (20000, 60,000 and 100,000 years ago) are usually much dustier
 are usually much dustier.")
43
Fig. 14-18, p. 426 Concentration of Carbon Dioxide and Methane determined from air bubbles in ice cores.

44
MARINE SEDIMENTS/FOSSIL RECORDS Foraminifera are micro-organisms that live in the sea and have a calcium carbonate shell. CaCO 3 As the foraminifera die they sink to the ocean floor to form chalk deposits. Among these chalk deposits one also find fossil shells. Oxygen has two isotopes which have an atomic mass of 16 and 18 The ratio of these two isotopes in the shells and foraminifera is a function of the sea temperature Fossils reveal ancient animal and plant life that can be used to infer climate characteristics of the past

45
Fig. 14-20, p. 428 Variation in average temperature determined from O 18 /O 16 ratio in fossil shells

46
ICE SHEETS Each year snow falls on the ice sheets and glaciers. As it accumulates it compresses and traps air bubbles. These bubbles of air trapped in ice can be analyzed to determine atmospheric composition. Glaciers that exist today can hold bubbles that are tens or hundreds of thousand of years old. Dust in the ice sheets can be caused by climate- changing volcanoes, or dry windy conditions that lead to soil erosion. Find that the colder periods of the Earth history (20000, 60,000 and 100,000 years ago) are usually much dustier
 are usually much dustier.")
47
Fig. 14-18, p. 426 Concentration of Carbon Dioxide and Methane determined from air bubbles in ice cores.

48
MARINE SEDIMENTS/FOSSIL RECORDS Foraminifera are micro-organisms that live in the sea and have a calcium carbonate shell. CaCO 3 As the foraminifera die they sink to the ocean floor to form chalk deposits. Among these chalk deposits one also find fossil shells. Oxygen has two isotopes which have an atomic mass of 16 and 18 The ratio of these two isotopes in the shells and foraminifera is a function of the sea temperature Fossils reveal ancient animal and plant life that can be used to infer climate characteristics of the past

49
Fig. 14-20, p. 428 Variation in average temperature determined from O 18 /O 16 ratio in fossil shells

50
NATURAL CAUSES OF CLIMATE CHANGE UNRELATED TO HUMAN ACTIVITY. VOLCANIC ACTIVITY ASTEROID IMPACTS SOLAR VARIABILITY VARIATIONS IN THE EARTH'S ORBIT PLATE TECTONICS CHANGES IN THE OCEAN CIRCULATION PATTERNS

51
Fig. 14-21, p. 430 Annual acidity of layers of an ice core in Greenland

52
VOLCANIC ACTIVITY MOST VOLCANOES EJECT DUST ETC. INTO THE TROPOPSHERE WHERE IT IS QUICKLY RAINED OUT. HOWEVER LARGE VOLCANOES CAN EJECT GASES, ESPECIALLY SULFUR DIOXIDE, INTO THE STRATOSPHERE. IN THE STRATOSPHERE THE SULFUR DIOXIDE TRANSFORMS INTO AEROSOLS, WHICH REMAIN IN THE STRATOSPHERE FOR ONE TO TWO YEARS. THIS WILL TEND TO COOL THE TROPOSPHERE - SCATTERS SOLAR RADIATION BACK TO SPACE. ERUPTION OF MOUNT TAMBORA IN INDONESIA LED TO 'YEAR WITHOUT A SUMMER' MOUNT PINATUBO, 1991, LOWERED TEMPERATURE BY 0.5 C

56
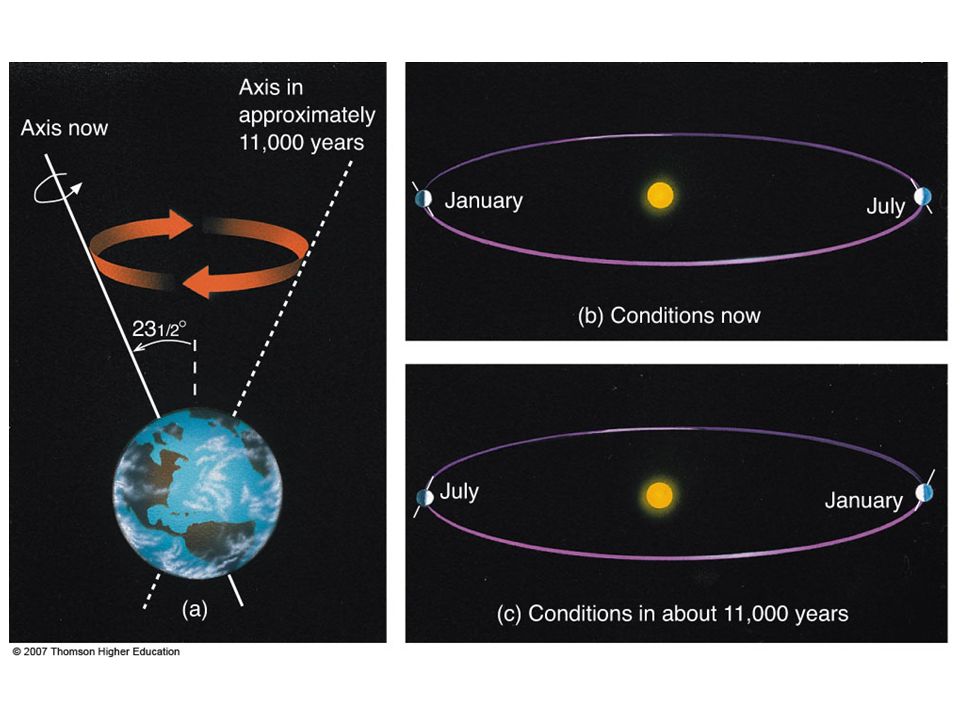
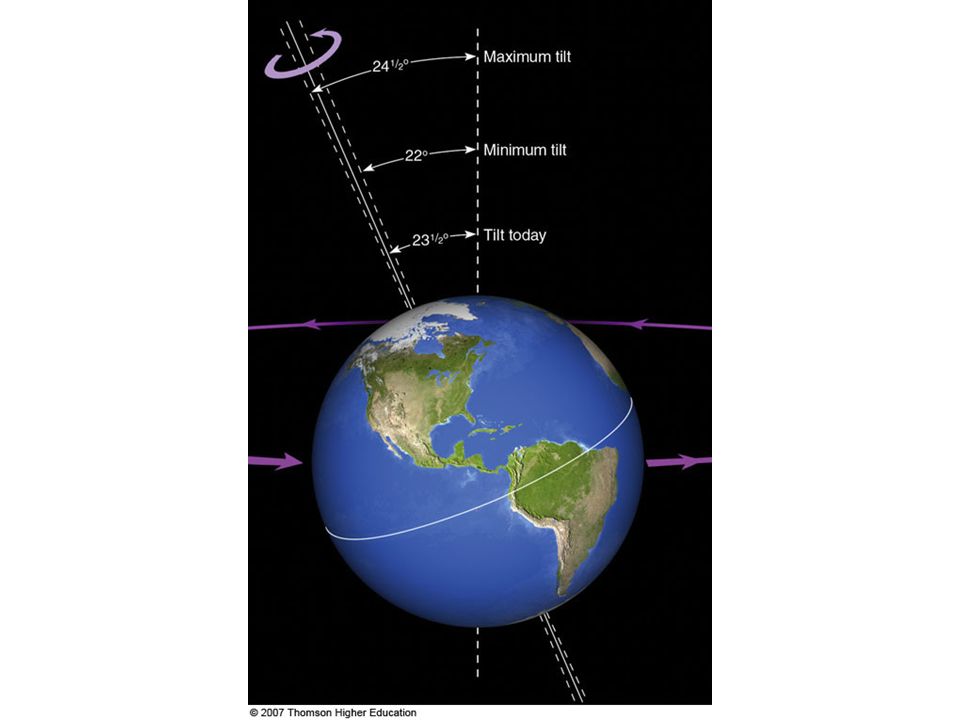
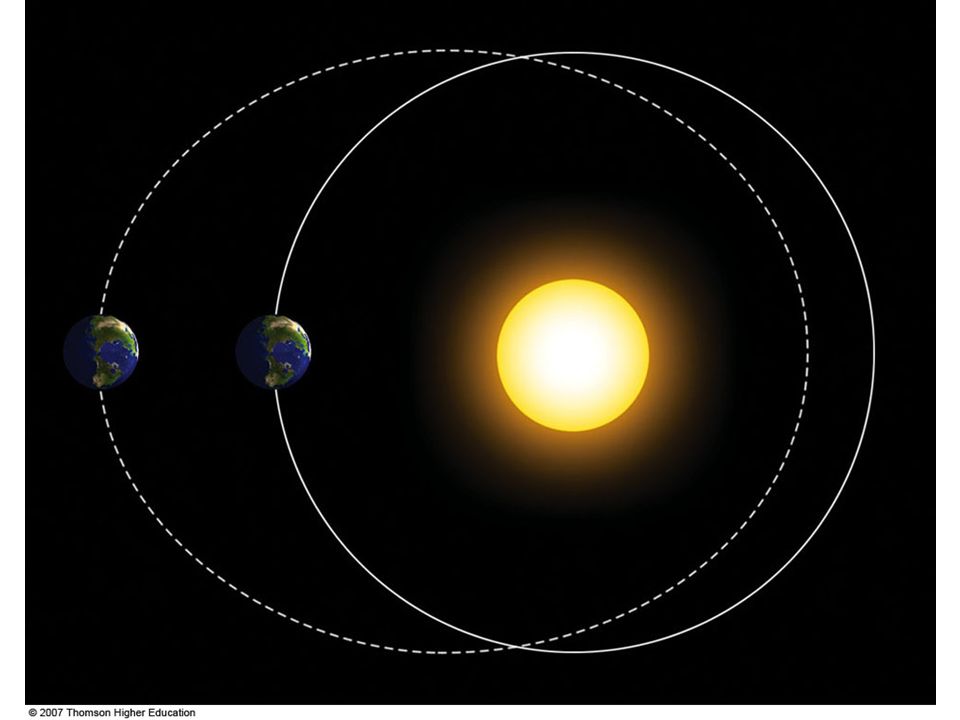
Variations in the Earth’s orbit Over long time periods the shape of the earth’s orbit around the sun, and the tilt of its axis are not constant. We can identify three ways in which these factors change Precession – the Earth wobbles on its axis similar to a spinning top. (27,000 years) Obliquity – its inclination to the solar plane changes (41,000 years) Eccentricity – the elliptical shape of the orbit changes (100,000 years)
 Obliquity – its inclination to the solar plane changes (41,000 years) Eccentricity – the elliptical shape of the orbit changes (100,000 years).")
57
SUNSPOT NUMBERS 1600-2000

58
SUNSPOT NUMBERS The output of energy from the Sun has an eleven year cycle – which also follows the number of dark spots on the Sun – sunspots. People have been observing sunspots since the invention of the telescope, 1600 In the period 1645 and 1715 the number of sunspots was dramatically lower – Maunder minimum. Coincided with the little ice age (1400-1850)
.")
59
Fig. 14-26, p. 436 Continental Drift

60
The Appalachians are a major source of coal. Among the coal can be found fossil remains of ferns. The coal came from the decay of ferns. This requires a moist warm climate such as at the equator in order to grow at a rate to produce enough vegetative matter to produce coal. So the Appalachians had to be much close to the equator when coal was deposited Continental drift.

61
North Atlantic ocean conveyor belt keeps Northern Europe warm. Any disruption will mean colder climate.

62
Fig. 14.27

63
Changes in the Ocean Circulation Patterns The ocean circulation tends to keep the northern latitudes warmer. However if the overall flow patterns are changed then the northern latitudes can get colder, and ice sheets can expand southward.

Similar presentations
>")


 Climate types of the present.>")


