Download presentation
Presentation is loading. Please wait.

1
Importance of Soil Testing
Precision nutrient management has been around for some times, because varying the rates of crop inputs to meet site-specific needs makes economic and environmental sense. I am going to spend a few minutes to talk about grid sampling based nutrient management strategy. Hailin Zhang Department of Plant and Soil Sciences

2
Precision Nutrient Management Strategies
Grid soil sampling Apparent Electrical Conductivity Yield monitor/mapping Sensing techniques As far as I know, these are the main strategies researched and applied. The first 2 are soil based and the other 2 are crop based.

3
Purposes of Soil Sampling
Measure the nutrient content or availability of the soil Identify nutrient deficiencies Predict crop response to added nutrients Build a nutrient management plan Those are the main purposes of soil tset

4
Soil Testing History 1842 - Liebig stated his “law of the minimum”.
Rothamsted Experimental Station established. Magruder Plots established in Stillwater, OK. E.A. Mitscherlich related plant growth to nutrients. 1920’s - Bray, Hester, Morgan, Spurway, and Troug developed the concept of labile versus total analysis. 1940’s & 50’s - Use of fertilizers spur interest in soil testing as a management tool. 1960’s - Evolution of soil testing continues as technological advances allow for improvements in analysis, correlation, and interpretation.

5
Milestones in Soil and Plant Analysis
pH Electrode 1932 Flame Photometer 1940 Bray 1945 Olsen 1954 P - Ascorbic Acid Determination 1962 Atomic Absorption 1960 ICP 1970s DTPA 1978 PC Computer 1980 Mehlich

6
Soil and plant tests Water Animal Waste Feed and forage
Main services provided

7
Directly Serving All Counties, in Oklahoma; Also serve state, tribal and federal agencies, consultants, researchers and students. We have direct service to all county extension offices in the state SWFAL

8
Number of Samples Analyzed Since 1986

9
Soil Test Results of Oklahoma Cropland
pH <5.5 >7.5 % 25% 48% 19% 8% Nitrate-N <10 10-20 20-40 >40 43% 29% 18% 10% STP <65 65-120 >300 71% 16% 9% 4% STK <120 >350 36% 20% 37%

10
Soil Samples from One Producer
Lab ID Sample pH NO3-N (lbs/A) P (lbs/A) K (lbs/A) 512408 6 6.9 40 52 1010 512410 7 30 36 882 512411 8 5.2 18 162 726 512412 9 4.8 32 173 654
 P (lbs/A) K (lbs/A)")
11
Variety Response to Soil pH
Limed Not Limed Custer, Ok101, Jagalene, Jagger, , AP502Cl, Ok102, 2137

12
Ok 101

13
The state-of-the-art equipments;
dedicated and well trained technicians; technical support; develop and validate methods; research to ensure accurate recommendations

14
QC/ QA Program in place Use: Internal & External Check Samples

15
Soil Sample Flow Chart Producer County Extension USPS Mail
OSU Mailing Services SWFAL Login Room Reports Online

16
Here is a winter wheat field at the Research Station in Perkins
Here is a winter wheat field at the Research Station in Perkins. Again tremendous differences in wheat growth. The forage yields ranged from practically zero to over 2,500 lbs/A. What we found the problem was low soil pH and high Al level. The forage yields were highly correlated to the Al saturation percentage.

17
Scooping samples for extraction
One acre to 6 inch deep contains about 2 million lbs of soil

18
The greatest potential for error in soil testing is in taking the sample
The farmer, or the person taking the soil sample, must provide the laboratory with a uniform, representative sample ... a critical component for the laboratory in providing accurate soil test results and fertilizer recommendations. Each sample, weighing only a pound or less, can represent millions of pounds of soil in the field. The greatest potential for error in soil testing is in taking the sample.

19
Considerations for Soil sampling Strategies
Locate variability responsive to fertilizer and lime Obtain a sample that accurately represents the area sampled Balance cost of sampling with the value of information

20
Recognize Field Nutrient Variability
Nitrate - Nitrogen lbs/acre 0-30 31-40 41-50 51-60 61-80 >80 This graph shows the variability of nitrate-nitrogen in a 75’x75’ area of a field. Each small plot is a 5’x5’ square. Nitrate-N ranged from 25 lbs/acre to 102 lbs/acre over the area. Each sample submitted for analysis should be representative of the the entire sampling area. Avoid taking sample from any unusual spots, such as, manure piles, cracks, etc, to avoid any misrepresentation. Data gathered from OSU Agronomy Research Farm (Nitrate-N within a 75’ x 75’ plot)
")
21
20 cores are needed to make a representative
composite sample in order to get reliable soil test results By taking enough soil cores randomly in a field to make a composite sample, one can hit the average nutrient status repeatedly.

23
Soil Sampling Strategies
Whole field composites: Composite sample representing the average nutrient status of the field * * * * * * * * * * * * * *

24
P Changes with Depth (no-till)
P (ppm) 0” 120 2” 55 6” 35 12” Soil test P changes with depth. N,K, pH, and many other soil properties also change, especially when the field is not cultivated. Soil phosphorus on fields receiving top dressed poultry litter tends to accumulate near the soil surface. A 0-6 inch sample is recommended for consistent and reliable soil test results. 31 24”
 Soil test P changes with depth. N,K, pH, and many other soil properties also change, especially when the field is not cultivated. Soil phosphorus on fields receiving top dressed poultry litter tends to accumulate near the soil surface. A 0-6 inch sample is recommended for consistent and reliable soil test results")
25
The key components of a good sampling technique.

26
Soil Sampling Strategies
2. Zone composites: Break field based on known or expected source of variability As far as I know, these are the main strategies researched and applied. The first 2 are soil based and the other 2 are crop based.

27
Soil Sampling Strategies
3. Grid Sampling: Break field based on ordered pattern Grid cell method: similar to whole field Grid center method Point sampling * * * * As far as I know, these are the main strategies researched and applied. The first 2 are soil based and the other 2 are crop based. * * * * * * * * * * * * * * *

28
1. Random sampling of the entire field ,
Field Soil Sampling, Soil Testing, and Making Fertilizer Recommendations Exercise 1. Random sampling of the entire field , 25 cores of soil from a 0-6” depth filling two soil sample bags from the composite mixture 2. Grid-cell sampling 15 cores of soil from a 0-6” depth 3. High resolution Have been realized the existence of field spatial variability, people have tried to account for them through management. This excise is to validate the existence of field variability using 3 different sampling schemes.

29
Whole field 1 acre grid Sub-grid Center area Point * * * * * * * * X X
A grid soil sampling exercise was conducted in this 27 acre field for the last two years. The dept. of animal science manages this field and they will use it to receive manure from the new swine facility they are building. X X X X X X * * * * * * * *

30
Whole field sample pH: Team 1: 6.0, 6.1 Team 2: 6.4, 6.4
Soil pH raged from 4.5 to 7.5. You will know where lime should be applied.

32
Comparison of Whole Field Sample between 2000, 2001 and 2002

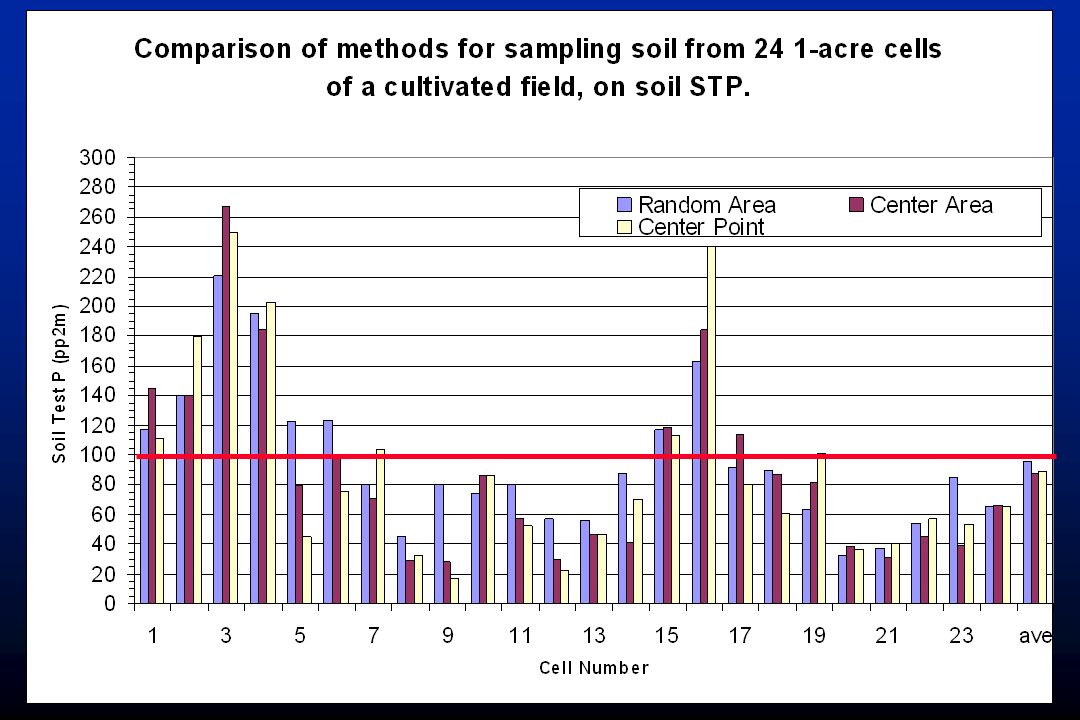
33
Comparison of Area of Sampling for 2002

34
Why Account for Spatial Variability of Soil Properties
Improve performance of ag. practices Either costs go down and/or returns go up Avoid over application that might be environmentally harmful Have been realized the existence of field spatial variability, people have tried to account for them through management. Because:

35
Analysis Costs of Various Sampling Intensities
Grid Spacing Area/sample Costs* Feet Acres $/acre 66 0.1 100 104 0.25 40 148 0.5 20 209 1 10 330 2.5 4 467 5 2 660 Conventional *at $10/sample

36
Choosing a Soil Sampling Strategy
Level of management and the resources to account for variability Whole field sampling most appropriate when fertility is high and variability is low Zoning/sub-field sampling may be most appropriate when Location of variation known Sampling areas are large Limited resource Grid sampling maybe appropriate if location of variation is unknown and variable rate applicator is available

37
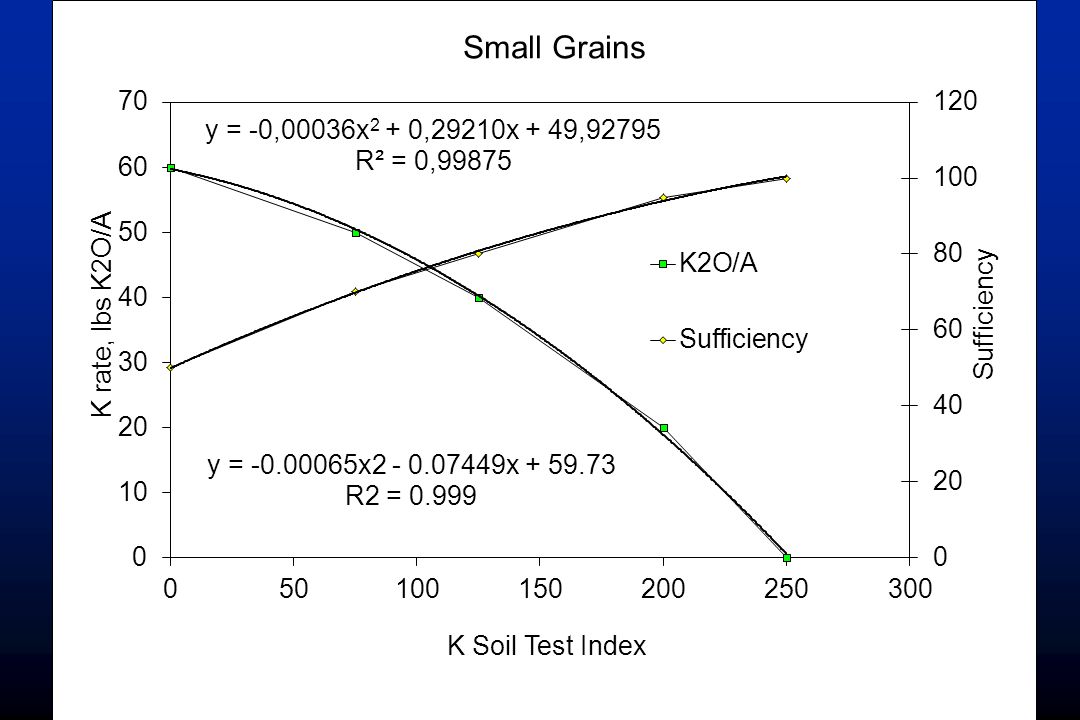
How to use soil test information?
As far as I know, these are the main strategies researched and applied. The first 2 are soil based and the other 2 are crop based.

38
pH value defines relative acidity or basicity
Ammonia cleaner Make lime recommendation 9.0 Strong pH value defines relative acidity or basicity 8.0 Basic Medium Slight 7.0 Pure water Slight Most productive soils Moderate 6.0 Medium Acid It covers a scale ranging from zero to 14.0, with 7.0 being neutral… neither acidic or basic. Most productive soils have pH values in the 5.0 to 8.0 range; however, acid or basic soils can be made more productive when properly managed. The relative degrees of acidity and basicity are shown here. 5.0 Strong Very strong 4.0 Vinegar Lemon juice

40
Plant Nutrient Recommendation
C H O N Ca 16 Essential Elements P Mg K S Sixteen chemical elements have been shown to be essential for plant growth. That means the plant cannot complete its normal life cycle if just one of these nutrients is limiting. They are divided into two main groups, non-mineral and mineral. B Cl Cu Fe Mn Mo Zn

42
As soil P increases, so does crop yield and the potential for p loss in surface runoff
Sharpley et al., 1998

44
Remediate Contaminated Soil
EC (mmhos/cm) 4 8 12 16 Normal Saline ESP % Increased salt hazard 15 Sodic Saline-Sodic 30
 Normal. Saline. ESP. % Increased salt hazard. 15. Sodic. Saline-Sodic. 30.")
45
Soil, Water and Forage Analytical Laboratory

Similar presentations