Download presentation
Presentation is loading. Please wait.

2
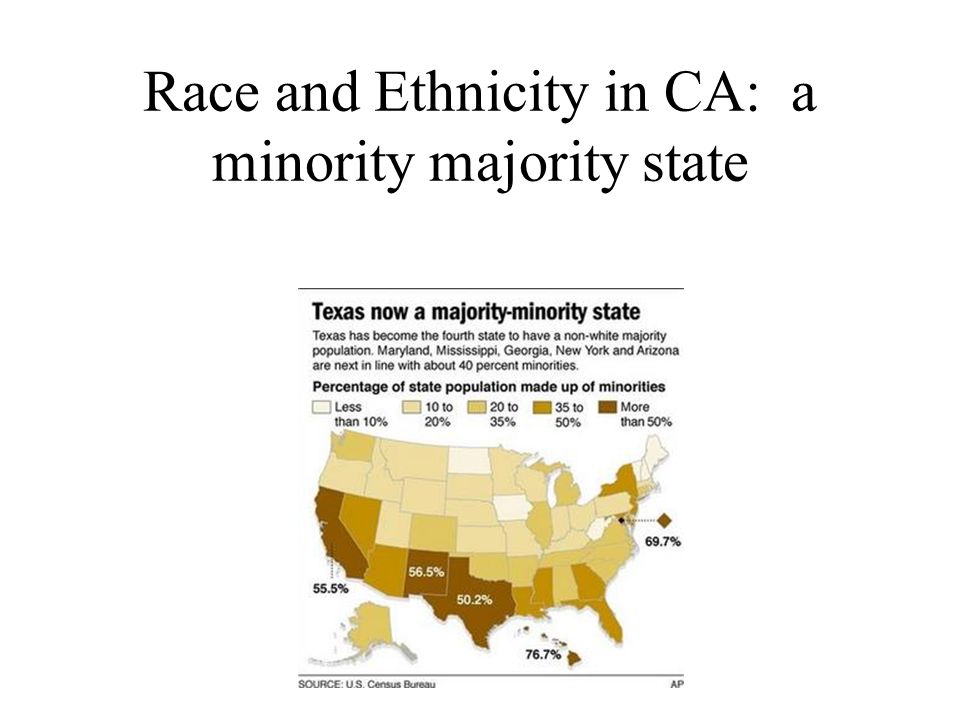
Race and Ethnicity in CA: a minority majority state

3
Native Americans 1770-1870 CA native population fell by 90%, almost totally disposessed 1850-1863 “slavery” legalized for CA native Americans 1879 CA granted them the right to vote, although they were not given US citizenship until 1924

4
Native Americans Cont’d 1969 Alcatraz--native radicalism Today about 1% of CA is Native American, mostly urban, mostly from out-of-state Who is an Indian? What is a tribe?

5
Casinos 1980s Indians began running Casinos on reservations 2000 CA passed Proposition 1A enshrining right to establish casinos in CA constitution CA negotiates terms Today tribes take in over $5 billion annually--unequally among tribes tribes are biggest single political donors in CA

6
Hispanics 1849 Constitution officially bilingual, recognizing large percentage of Californios bilingualism dropped in Constitution of 1879, as CA continues to “Europeanize” 1960s Growing Mexican immigration 1980s Central American immigration Today about 1/3 CA, after 2010, larger percentage than whites

7
Hispanic political power socially conservative, fiscally liberal traditionally politically weak some not citizens, young, low registration 1986 IRCA--one time amnesty and path to citizenship increase in citizenship 1994 Pete Wilson helps pass Prop 187-- limiting services for illegals % of hispanic registered voters more than doubles since 1990 Hispanic erosion towards Republicans reverses L.A. Mayor, Lt. Governor, Assembly Speaker, etc.

8
English Only--Prop 227 In 1986 CA voters made English “official language” Between 1987 and 1997, number of CA students with limited English tripled Bilingual ed better? majority of Hispanic parents opposed bi-ed Prop 227 passed in 1998, bilingual ed largely disappeared

9
.

10
African Americans Some black slaves prior to constitutional abolition in 1849 Great migration during and after WWII Riots of 1965 and 1992 Visibly represented in CA politics-- although now less so stallwart Democrats a stable 7% of population

12
Asian Americans--the internment issue 1913 Alien Land Law 1943-45 Japanese internment Korematsu vindicated in 1982 CA and US give reparations

13
Asian Americans 1965 Immigration Act ended national quota system, allowed family sponsorship Cold War tensions and partnerships lead to immigration from Korea, Vietnam, Cambodia, etc.

14
Asian Americans CA about 10% Asian/ PI Economically various: Indian-Americans on average wealthier than Caucasians, Laotians, Hmong, Khmer poorer. Politically: -growing in political strength--% reg voter doubled in 15 ys -Asians in CA mostly Dem, voted for Gore and Kerry, but often more conservative than other minorities/neighboring whites -differences between nationalities/ethnicities

15
Whites (Euro-Americans) Aging Declining as a percentage of the population (46%) Still a majority of registered voters (67%), but declining
 Aging Declining as a percentage of the population (46%) Still a majority of registered voters (67%), but declining")
16
Mixed race 1948 CA first state to abandon ban on mixed race marriages 2000 Census the first to allow choosing multiple racial categories Only Hawaii & Alaska have higher %, CA nearly 5%, 2x nat’l avg, and growing by 3rd generation, most Asians and Latinos marry outside ethnicity

18
Segregation 1874 Ward v Flood CASC ruled that segregated schools do not violate the 14th Amendment--later cited in U.S. favoring “separate but equal” conditions Until 1920s segregation frequently paracticed in CA for Blacks, Asians, Mexicans

19
End of Legal Segregation 1946 CASC throws out segregated schools for Mexican students 1947 Governor Earl Warren signs law abolishing segregated schools 1954 USSC Chief Justice Earl Warren writes Brown v Board Ed--ending US legal segregation

20
CA desegregation post-Brown In CA, most segregation was not de jure but de facto--what to do? Especially in LA, forced busing led to white flight to suburbs and private schools 1979 Prop 1 passes--no mandatory busing for de facto segregation

21
Desegregation in SF SF 1983 Consent decree: no more than 45% of any race at any school 1999 Ct struck down decree today: “race neutral” diversity index resegregation: top schools White/Asian, bottom Hispanic/Black

22
Affirmative Action Beginning in 1960s -preferences for minorities and women for govt hiring, contracts, and govt funded education -voluntary preferences in private sector Bakke v Regents of UC (1978) -no quotas, but as a factor OK California’s Prop 209 (1996) -race-blind admissions, but not quite sweeping the country
 -no quotas, but as a factor OK California’s Prop 209 (1996) -race-blind admissions, but not quite sweeping the country")
Similar presentations


 Forbids any state to “deny to any person within its jurisdiction the equal protection of the laws.”>")


