Download presentation
Presentation is loading. Please wait.

1
Steel – Two Years Later Thomas A. Danjczek, President Steel Manufacturers Association August 24, 2006 National Fluid Power Association Economic Outlook Conference

2
Steel – Two Years Later I.SMA II.Review 2004 Presentation Highlights/Conclusions III.Review 2005 Presentation Highlights/Conclusions IV.2006 World Steel Production/Operating Rate China (Growth, Questions, Concerns, Challenges) Oil Costs & Pricing 2006 U.S. Market Outlook Consolidations V.Conclusion NFPA – Economic Outlook Conference

3
The Steel Manufacturers Association (SMA) –38 North American companies: 32 U.S., 3 Canadian, and 3 Mexican –115 Associate members: Suppliers of goods and services to the steel industry SMA member companies –Operate 120 Steel plants in North America –Employ about 40,000 people –Mini-mill Electric Arc Furnace (EAF) producers
 –38 North American companies: 32 U.S., 3 Canadian, and 3 Mexican –115 Associate members: Suppliers of goods and services to the steel industry SMA member companies –Operate 120 Steel plants in North America –Employ about 40,000 people –Mini-mill Electric Arc Furnace (EAF) producers")
4
NFPA – Economic Outlook Conference Production capability –SMA represents approximately 70% of U.S. steel production Recycling –SMA members are the largest recyclers in the U.S. –Last year, the U.S. recycled over 70 million tons of ferrous scrap Growth of SMA members –Efficiency and quality due to low cost –Flexible organizations –EAF growth surpassed 53% in 2004, 56% in 2005, and anticipated to be 58% in 2006

5
Year 2004 Current Drivers Impacting Steel Competitiveness NFPA – Economic Outlook Conference August 17, 2004 I. Trade 201 Real World Impact World Steel Production (up 7.1%) China, China, China… (up 21.1%) (Its Impact) II. Steel Production Costs Key Issues (Scrap $100 to $285) Asset Values Exchange Rates Steel Imports – Value of U.S. $ Bankruptcy/Restarts III. Other Costs Restrictive Scrap Exports Freights Coke Energy IV. Market Overview Public Works Construction V. Conclusion Uncertainty Optimistic
 China, China, China… (up 21.1%) (Its Impact) II. Steel Production Costs Key Issues (Scrap $100 to $285) Asset Values Exchange Rates Steel Imports – Value of U.S. $ Bankruptcy/Restarts III. Other Costs Restrictive Scrap Exports Freights Coke Energy IV. Market Overview Public Works Construction V. Conclusion Uncertainty Optimistic.")
6
2004 Conclusions Uncertainty – Cycle has Changed (Shorter Term & Greater Peaks & Valleys) Revenue vs. Costs – Not the Same Business Model Bankruptcy Laws Unfair to Competitors Investments – Earn Cost of Capital Minimills Must Compete in the World, as it is, and We Can! Meaningful Optimism with Good Long Term Consumption, Relative Value, and Excellent Recyclability for Steel NFPA – Economic Outlook Conference

7
Year 2005 NFPA – Economic Outlook Conference August 16, 2005 Steel – A Year Later I. Trade Some things are the same (China exchange rate, high scrap prices) Some things are worse (China trade imbalance, escalating energy prices, interest rates, and steel imports) II. Steel World production up 6.5% Operating rate down slightly III. Costs/Prices Down slightly from peak Pressure in metallics, energy, & transportation IV. Other Consolidations continue Inventories decline modestly V. Conclusion Positive outlook Healthy demand
 Some things are worse (China trade imbalance, escalating energy prices, interest rates, and steel imports) II. Steel World production up 6.5% Operating rate down slightly III. Costs/Prices Down slightly from peak Pressure in metallics, energy, & transportation IV. Other Consolidations continue Inventories decline modestly V. Conclusion Positive outlook Healthy demand.")
8
NFPA – Economic Outlook Conference 2005 Conclusions Hell, it’s still a cyclical business Fundamental shift in both demand and supply due to China and its appetite for raw materials – China is still the “wild card” Consolidations have had an impact to reduce volatility Role of inventories affecting pricing and production Unknowns (Oil, Interest rate, Auto sector, Energy, China, China, China) Still reasons for meaningful optimism
 Still reasons for meaningful optimism")
9
2006

10
WORLD STEEL PRODUCTION China accounted for 32.4% of world output and over 93% of the y-t-d worldwide net gain. Steel Production: March 2006 Percent Change, Year Ago Month: 7.0% Year-to-Date: 5.4% Steel Production: March 2006 Percent Change, Year Ago Month: 7.0% Year-to-Date: 5.4% World Excluding China World Excluding China World Total In the five years from 1998 to 2003, China and the former-USSR states increased production by a cumulative 140 MT, equal to 70% of the combined total output in 2003 of both the U.S. or Japan. Courtesy of Chris Plummer, Metal Strategies

11
WORLD STEEL PRODUCTION SHARES BY REGION The Asian share of world crude steel production has increased from 14% in 1960 to a projected 62% by 2020. Shares for every other region have been roughly cut in half except for the “All Other” developing country category. “ Asia” includes Oceania (Australia, New Zealand etc.) “West Europe” = EU 15, Turkey, Norway, Switzerland. “All Other” = Canada, Mexico, South and Central America, Africa, and the Middle East Courtesy of Chris Plummer, Metal Strategies
 West Europe = EU 15, Turkey, Norway, Switzerland. All Other = Canada, Mexico, South and Central America, Africa, and the Middle East Courtesy of Chris Plummer, Metal Strategies.")
12
NFPA – Economic Outlook Conference China’s Impact After 5 Trips in the Past Two Years… Key Questions: - When will Chinese steel production significantly exceed its own domestic consumption – I.e. 50/60 MMT? - Will the Chinese government shut down inefficient, excess capacity? (Has not done so with polluting facilities despite strong policy) - How can North American Steel Industry compete against Chinese government - - IT CAN’T!
 - How can North American Steel Industry compete against Chinese government - - IT CAN’T!.")
13
CONCERNS WITH CHINA Steel ItemComment North American steel industry CANNOTCurrency, banks, land, environment, compete against Chinese steel companiesconsolidations, policies financed and controlled by their government In 2005, compared to 2004, China steelTrend worsens in 2006 with new imports are projected to drop, whilecapacity on line, and China’s while exports are projected to increase slowdown significantly North American steel industry loss of aGovernment de facto subsidies significant increment of its customer(industrial parks, infrastructure, base to relocation to Chinesefactory space, loans) production sites
 production sites")
14
CHINA’S CHALLENGES Area Comment EnvironmentTrade policy and laws are not enforced regarding emissions and effluents; Province versus Beijing; employment rules, not environment ConsolidationsState-owned facilities; only non-controlling foreign ownership allowed; antiquated facilities; policy is 20 large producers, push small producers out Technology/QualityQuality in flat rolled will affect export capabilities. Switch from long to flat not easy InventoriesRun full out. Not always market-oriented CapitalWill not always be free; could lose state credit PersonnelSome “unrest” expressed toward elite class. Internet is politically uncontrollable

15
RAW MATERIALS I n the four years from Q1-2002 to Q1-2006, raw material and energy input costs for U.S. steelmakers have increased dramatically. January 2002 = 100 Courtesy of Chris Plummer, Metal Strategies

16
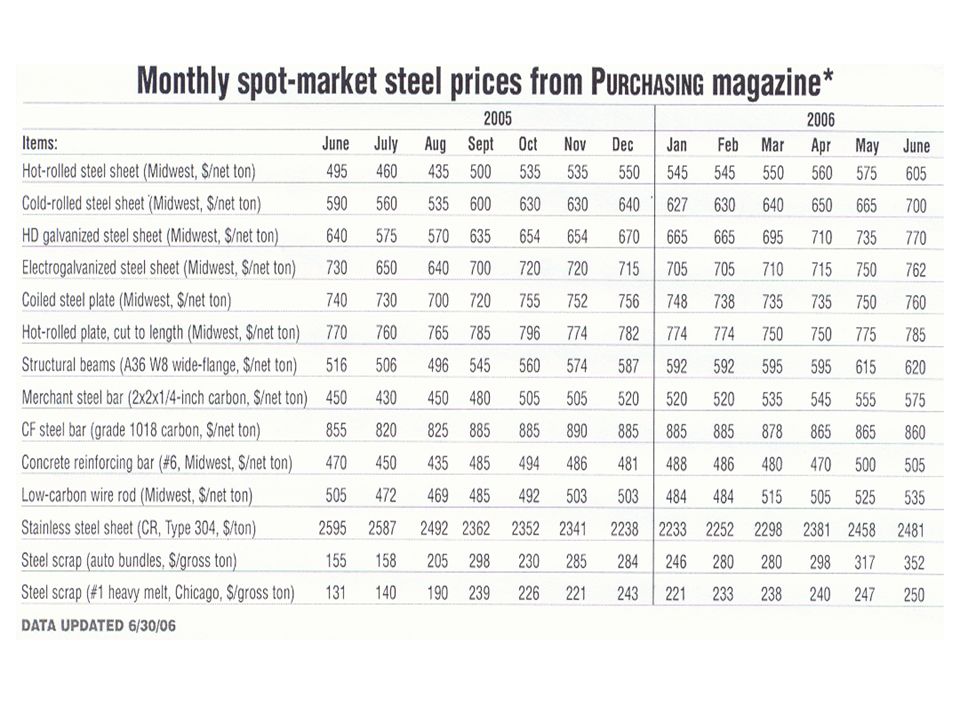
2006 PricesNFPA – Economic Outlook Conference

18
2006 U.S. MARKET OUTLOOK We project apparent consumption growth in the 7-10% range for 2006, driven by the energy, construction and industrial capital equipment sectors. Courtesy of Chris Plummer, Metal Strategies

19
Individual Domestic Demand Sectors - Automotive is high, but dipping slightly - Residential construction is falling, but still high - Industrial machinery production rising - Non-residential growing, but not back to 2000 level - Heavy machinery is strong - Energy is the best sector Plate, pipe, and specialty Courtesy of Global Insight, Inc.

21
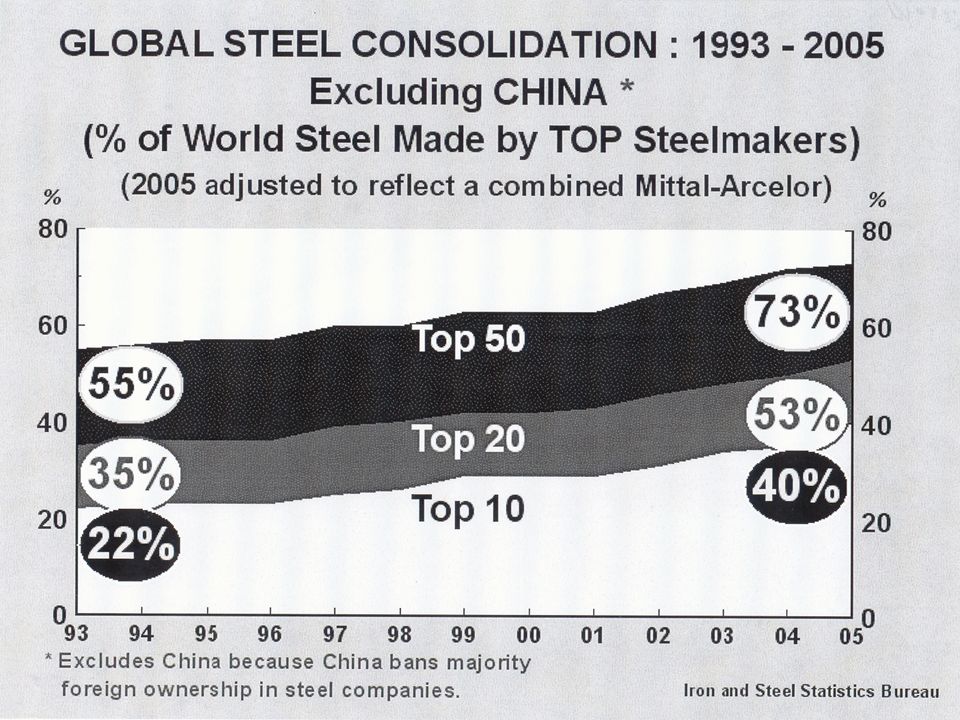
TOP-THREE MARKET SHARES 2000 compared to 2005 Flat Rolled Weighted Average 2005:65% 2000:47% Long Products Weighted Average 2005:68% 2000:51% Courtesy of Chris Plummer, Metal Strategies

22
NFPA – Economic Outlook Conference Conclusions - 2006 Hell, it’s still a cyclical business, but enjoy today! Fundamental shift in both demand and supply due to China & its appetite for raw materials – China is still the “wild card”. Risk near term is auto’s; long term is China – “China is the story, the rest is embellishment” Consolidations and discipline have had an impact to reduce volatility Role of inventories affecting pricing and production Demand still healthy and growing Unknowns (Oil, interest rates, auto sector, energy, freight rates, federal spending, China, China, China) Significant changes ahead in trade, metallics, energy, and consolidation Still reasons for meaningful optimism; positive outlook, despite China, energy costs, and interest rates
 Significant changes ahead in trade, metallics, energy, and consolidation Still reasons for meaningful optimism; positive outlook, despite China, energy costs, and interest rates.")
Similar presentations


 Muthanna Investment Company (MIC)>")


 719-9800 Fax: (610) 719-9810>")


