Download presentation
Presentation is loading. Please wait.

1
Foundations of Finance 2009
Lecture 5 Alcino Azevedo Investment Appraisal

2
Learning Objectives Discuss the difficulty of finding profitable projects in competitive markets and the importance of search. Determine whether a new project should be accepted or rejected using the payback period, net present value, the profitability index, and the internal rate of return. Explain how the capital-budgeting decision process changes when a limit is placed on the dollar size of the capital budget. Discuss the problems encountered in project ranking. Explain the importance of ethical considerations in capital-budgeting decisions. Discuss the trends in the use of different capital-budgeting criteria. Explain how foreign markets provide opportunities for finding new projects.

3
Capital-Budgeting The process of decision making with respect to investments in fixed assets – that is, should a proposed project be accepted or rejected. All of techniques attempt to compare the costs and benefits of a project. The rule of capital budgeting is to accept all projects for which the cost is less than, or equal to, the benefit: Accept if: Cost £ Benefit; Reject if: Cost > Benefit

4
Source of Ideas for projects
Within the Firm: Typically, a firm has a research & development (R&D) department that searches for ways of improving existing products or finding new projects. Other sources: Competition, Suppliers, Customers
 department that searches for ways of improving existing products or finding new projects. Other sources: Competition, Suppliers, Customers.")
5
Capital-Budgeting Decision Criteria
Payback Period Accounting Rate of Return Net Present Value Profitability Index Internal Rate of Return Capital Rationing

6
Payback Period Number of years needed to recover the initial cash outlay of a capital-budgeting project Decision Rule: Project feasible or desirable if the payback period is less than or equal to the firm’s maximum desired payback period.

7
Payback Period Example
Example: Project with an initial cash outlay of $20,000 with following free cash flows for 5 years. YEAR CASH FLOW BALANCE 1 $ 8,000 ($ 12,000) 2 4,000 ( 8,000) 3 3,000 ( 5,000) 4 5,000 5 10,000 12,000 Payback is 4 years
 2. 4,000. ( 8,000) 3. 3,000. ( 5,000) 4. 5, , ,000. Payback is 4 years.")
8
Trade-offs: Payback Period
Benefits: Uses cash flows rather than accounting profits Easy to compute and understand Useful for firms that have capital constraints Drawbacks: Ignores the time value of money and Does not consider cash flows beyond the payback period.

9
Discounted Payback Period
DPP is exactly the same as the regular payback period, except that we use the present values of the cash flows in the calculation Example: Should we buy the following machine using DPP, given the cash flows as below and the required return of 12% 1 2 3 4 5 2000 2500 3000 3500 4000 -10,000 Basic PP is = 3 + [2500/3500] = 3.71 years How about DPP?

10
Discounted Payback Period
The discounted cash flow with 12% discount rate: 1 2 3 4 5 -10,000 DPP =4+ ( / ) =4.83 years ALWAYS: DPP > Basic PP
 =4.83 years. ALWAYS: DPP > Basic PP.")
11
What’s wrong with DPP? The discounted payback period solves the time value problem, but it still ignores the cash flows beyond the payback period Therefore, you may reject projects that have large cash flows in the outlying years that make it very profitable In other words, any measure of payback can lead to a focus on short-run profits at the expense of larger long-term profits

12
Accounting rate of return (ARR):
ARR is a measurement of return on investment in %. It compares average annual profit increase with the initial investment capital. An investment is acceptable if the ARR exceeds an arbitrarily determined required rate of return for the business. ARR ignores time value of money ARR = Average annual profit*100% Average investment Average Investment = (Investment cost + Disposal value) / 2
 / 2.")
13
Cash flow schedule of the purchase of a machine is as follows:
ARR-example Cash flow schedule of the purchase of a machine is as follows: Average profit before depreciation = (£20,000 + £40,000 + £60,000 + £60,000 + £20,000) / 5 = £40,000 Straight Line depreciation per annum = (Cost £100,000 – Disposal value £20,000) / 5 = £16,000 Average profit after depreciation = £40,000 – £16,000 = £24,000 Average Investment = (Investment cost + Disposal value) / 2 Average Investment = (£100,000 + £20,000) / 2 = £60,000 ARR = (£24,000 / £60,000) X 100% = 40%
 / 5 = £40,000. Straight Line depreciation per annum. = (Cost £100,000 – Disposal value £20,000) / 5 = £16,000. Average profit after depreciation = £40,000 – £16,000 = £24,000. Average Investment = (Investment cost + Disposal value) / 2. Average Investment = (£100,000 + £20,000) / 2 = £60,000. ARR = (£24,000 / £60,000) X 100% = 40%")
14
Net Present Value or NPV
NPV is equal to the present value of all future free cash flows less the investment’s initial outlay. It measures the net value of a project in today’s dollars. NPV = FCF - Initial outlay (1+k)n Decision Rule: If NPV > 0, accept If NPV < 0, reject
n. Decision Rule: If NPV > 0, accept. If NPV < 0, reject.")
15
NPV Example Example: Project with an initial cash outlay of $60,000 with following free cash flows for 5 years. Yr FCF Yr FCF Initial outlay -60, ,000 , ,000 , ,000 The firm has a 15% required rate of return.

16
NPV Example (cont.) NPV = FCF - Initial outlay (1+k)n
PV of FCF = $60,764 Subtracting the initial cash outlay of $60,000 leaves an NPV of $764. Since NPV>0, project is feasible.

17
NPV Trade-offs Benefits Drawbacks
Considers cash flows, not profits Considers all cash flows Recognizes time value of money By accepting only positive NPV projects, increases value of the firm Drawbacks Requires detailed long-term forecast of cash flows NPV is considered to be the most theoretically correct criterion for evaluating capital-budgeting projects.

18
Profitability Index (PI)
PI is the ratio of the present value of the future free cash flows to the initial outlay. It yields the same accept/reject decision as NPV. PI = PV FCF/ Initial outlay Decision Rule: PI > 1 = accept PI < 1 = reject

19
PI Example A firm with a 10% required rate of return is considering investing in a new machine with an expected life of six years. The initial cash outlay is $50,000.

20
PI Example FCF PVF @ 10% PV Initial Outlay -$50,000 1.000 Year 1
15,000 0.909 13,636 Year 2 8,000 0.826 6,612 Year 3 10,000 0.751 7,513 Year 4 12,000 0.683 8,196 Year 5 14,000 0.621 8,693 Year 6 16,000 0.564 9,032

21
PI Example PI = ($13,636 + $6,612+$7,513 + $8,196 + $8,693+ $9,032) / $50,000 =$53,682/$50,000= Project PI > 1, accept.

22
NPV and PI When the present value of a project’s free cash inflows are greater than the initial cash outlay, the project NPV will be positive. PI will also be greater than 1. NPV and PI will always yield the same decision.

23
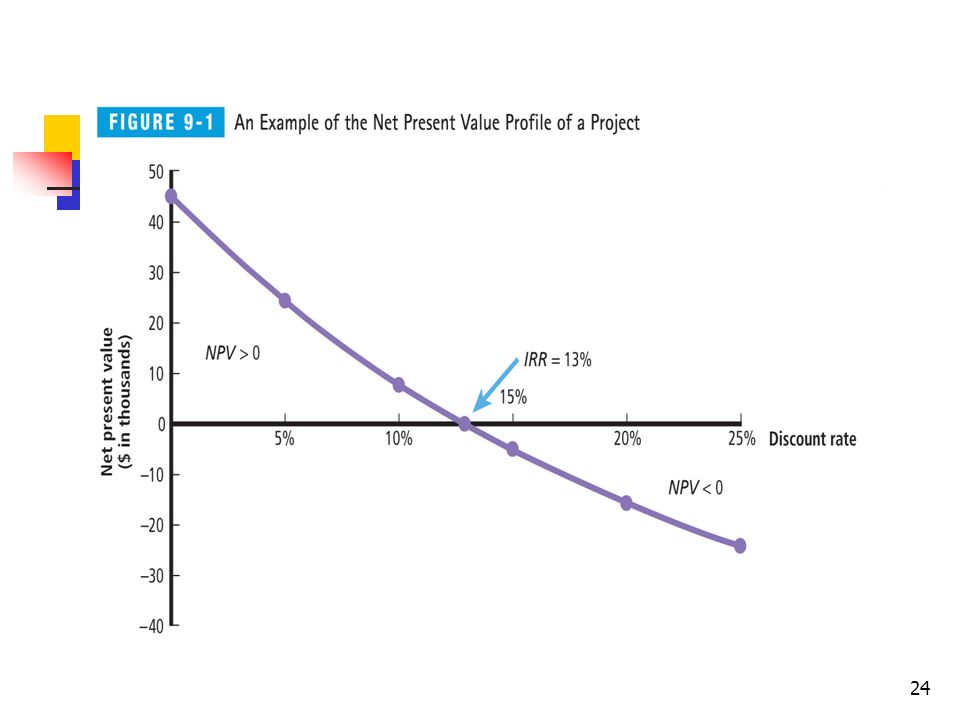
Internal Rate of Return or IRR
IRR is the discount rate that equates the present value of a project’s future net cash flows with the project’s initial cash outlay Decision Rule: If IRR > Required rate of return, accept If IRR < Required rate of return, reject

25
IRR and NPV If NPV is positive, IRR will be greater than the required rate of return If NPV is negative, IRR will be less than required rate of return If NPV = 0, IRR is the required rate of return.

26
IRR Example Initial Outlay: $3,817 Cash flows:
Yr.1=$1,000, Yr. 2=$2,000, Yr. 3=$3,000 Discount rate NPV 15% $4,356 20% $3,958 22% $3,817 IRR is 22% because the NPV equals the initial cash outlay.

27
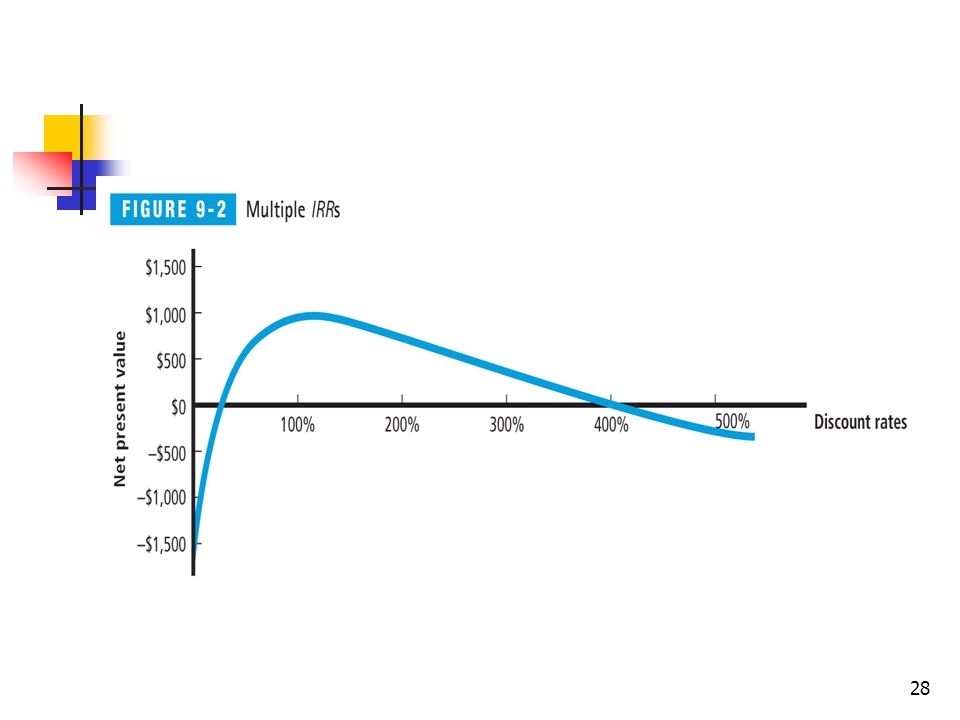
Multiple IRRs A normal cash flow pattern for a project is negative initial outlay followed by positive cash flows (-, +, +, + …); However, if the cash flow pattern is not normal (such as -, +, -) there can be more than one IRRs; Figure 9-2 is based on cash flows of: -1,600; +10,000; -10,000 in years 0,1,2
 there can be more than one IRRs; Figure 9-2 is based on cash flows of: -1,600; +10,000; -10,000 in years 0,1,2.")
29
Modified IRR Primary drawback of the IRR relative to the net present value is the reinvestment rate assumption made by the internal rate of return Modified IRR allows the decision maker to directly specify the appropriate reinvestment rate MIRR> required rate of return, accept MIRR< required rate of return, reject

30
MIRR Example Project having a 3yr. Life and a required rate of return of 10% with the following cash flows: FCF’s Initial Outlay -$6,000 Year 2 $3,000 Year 1 $2,000 Year 3 $4,000

31
MIRR Example Step 1: Determine the PV of the project’s cash outflows. $6,000 is already at present. Step 2: Determine the terminal value of the project’s free cash flows. To do this use the project’s required rate of return to calculate the FV of the project’s three cash flows of the project’s cash outflows. They turn out to be $2,420 +$3,300 + $4,000 = $9,720 for the terminal value

32
MIRR Example Step 3: Determine the discount rate that equates to the PV of the terminal value and the PV of the project’s cash outflows. MIRR= %. It is > required rate of return: Accept

33
Capital Rationing Capital rationing occurs when a limit is placed on the dollar size of the capital budget. How to select: Select a set of projects with the highest NPVs – subject to the capital constraint. Using NPV may preclude accepting the highest ranked project in terms of PI or IRR.

34
Ranking Problems Size Disparity Time Disparity Unequal Life

35
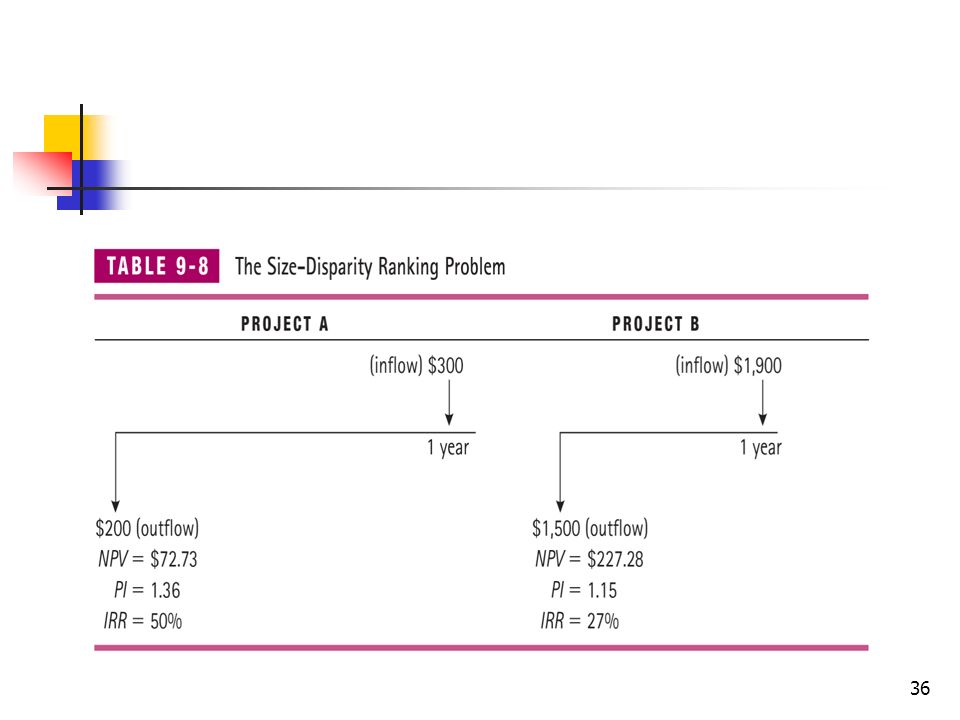
Size Disparity This occurs when we examine mutually exclusive projects of unequal size. Example: Consider the following cash flows for one-year Project A and B, with required rates of return of 10%. Initial Outlay: A = $200 B = $1,500 Inflow: A = $300 B = $1,900

37
Size Disparity Ranking Conflict: Project A Project B NPV 72.73 227.28
PI IRR 50% 27% Ranking Conflict: Using NPV, Project B is better; Using PI and IRR, Project A is better.

38
Size Disparity Which technique to use to select the better project?
Use NPV whenever there is size disparity. If there is no capital rationing, project with the largest NPV will be selected. When capital rationing exists, select set of projects with the largest NPV.

39
Time Disparity Problem
Time Disparity problems arise because of differing reinvestment assumptions made by the NPV and IRR decision criteria. Cash flows reinvested at: According to NPV: Required rate of return According to IRR: IRR

40
Time Disparity Problem
Example: Consider two projects, A and B, with initial outlay of $1,000, cost of capital of 10%, and following cash flows in years 1, 2, and 3: A: $100 $200 $2,000 B: $650 $650 $650

42
Time Disparity Problem
Project A Project B NPV PI IRR % % Ranking Conflict: Using NPV, A is better Using IRR, B is better Which technique to use to select the superior project? Use NPV

43
Unequal Lives Problem This occurs when we are comparing two mutually exclusive projects with different life spans. To compare projects, we compute the Equivalent Annual Annuity (EAA)
")
44
Unequal Lives Problem Example: If you have two projects, A and B, with equal investment of $1,000, required rate of return of 10%, and following cash flows in years 1-3 (for project A) and 1-6 (for project B) Project A = $500 each in years 1-3 Project B = $300 each in years 1-6
 and 1-6 (for project B) Project A = $500 each in years 1-3. Project B = $300 each in years 1-6.")
45
Computing EAA Calculate project’s NPV:
A = $ and B = $306.58 Calculate EAA = NPV/annual annuity factor A = $97.89 B = $70.39 Project A is better

46
Ethics in Capital-Budgeting
Ethics do play a role in capital-budgeting. Any actions that violate ethical standards can have a negative impact on the image of the firm and consequently, future cash flows.

47
Popularity of Capital-Budgeting Techniques: US
Percent of Firms Using Each Method used Primary Secondary Total Method Method IRR 88% % 99% NPV 63% 22% 85% Payback 24% 59% 83% PI 15% 18% 33%

48
Popularity of Capital-Budgeting Techniques: UK
What percentage of UK firms are using; IRR : 81% NPV: 80% PP : 70% ARR: 56% Question: Why is IRR so fashionable despite its shortcomings?

49
OTHER ISSUES IN INVESTMENT APPRAISAL Learning Objectives
Identify guidelines by which we measure cash flows. Explain how a project’s benefits and costs – that is, its free cash flows – are calculated. Explain the importance of options or flexibility in capital budgeting. Explain what the appropriate measure of risk is for capital-budgeting purposes. Determine the acceptability of a new project using the risk-adjusted discount method of adjusting for risk. Explain the use of simulation for imitating the performance of a project under evaluation.

50
Incremental Cash Flows
Decision makers must consider what new cash flows the company as a whole will receive if the company takes on a given project. Only incremental after-tax cash flows matter.

51
Ten Guidelines for Capital Budgeting
Use free cash flows, not accounting profits. Think incrementally. Beware of cash flows diverted from existing products. Look for incidental or synergistic effects. Work in working-capital requirements. Consider incremental expenses. Sunk costs are not incremental cash flows Account for opportunity costs. Decide if overhead costs are truly incremental cash flows. Ignore interest payments and financing flows.

52
Use free cash flows Free cash flow accurately reflects the timing of benefits and costs – when money is received, when it can be reinvested, and when it must be paid out. Accounting profits do not reflect actual money in hand.

53
Incremental cash flows
Further, after-tax free cash flows must be measured incrementally. Determining incremental free cash flow involves determining the cash flows with and without the project. Incremental is the “additional cash flows” (inflows or outflows) that occur due to the project.
 that occur due to the project.")
54
Beware of diverted cash flows
Not all incremental free cash flow is relevant. Thus new product sales achieved at the cost of losing sales from existing product line are not considered a benefit. However, if the new product captures sales from competitors or prevents loss of sales to new competing products, it would be a relevant incremental free cash flow.

55
Incidental or Synergistic Effects
Although some projects may take sales away from a firm’s current projects, in other cases new products may add sales to the existing line. This is called a synergistic effect and is a relevant cash flow.

56
Working capital requirement
New projects require infusion of working capital (such as inventory to stock the shelves), which would be an outflow. Generally, when the project terminates, working capital is recovered and there is an inflow of working capital.
, which would be an outflow. Generally, when the project terminates, working capital is recovered and there is an inflow of working capital.")
57
Sunk Costs Sunk costs are cash flows that have already occurred (such as marketing research) and cannot be undone. Sunk costs are considered irrelevant to decision making. Managers need to ask two basic questions: Will this cash flow occur if the project is accepted? Will this cash flow occur if the project is rejected? If the answer is “Yes” to #1 and “No” to #2, it will be an incremental cash flow.
 and cannot be undone. Sunk costs are considered irrelevant to decision making. Managers need to ask two basic questions: Will this cash flow occur if the project is accepted Will this cash flow occur if the project is rejected If the answer is Yes to #1 and No to #2, it will be an incremental cash flow.")
58
Opportunity Costs Opportunity cost refers to cash flows that are lost because of accepting the current project. For example, using the building space for the project will mean loss of potential rental revenue.

59
Overhead Costs Incremental overhead costs or costs that were incurred as a result of the project and relevant to capital budgeting must be included. Note, not all overhead costs may be relevant (for example, the utilities bill may have been the same with or without the project).
.")
60
Interest Payments and Financing Costs
Interest payments and other financing cash flows that might result from raising funds to finance a project are not relevant cash flows. Reason: Required rate of return implicitly accounts for the cost of raising funds to finance a new project.

61
Free Cash Flow Calculations
Three components of free cash flows: Initial outlay Annual free cash flows over the project’s life Terminal cash flow

62
Initial Cash Outlay The immediate cash outflow necessary to purchase the asset and put it in operating order. May include: Purchase cost, Set-up cost, Installation, Shipping/Freight, increased working-capital requirements, tax implications (if the project replaces an existing project/asset)
")
63
Sale and Taxes If Sale = Book Value ==> No tax effect
If sale >BV (but less than cost) ==> recaptured depreciation, taxed as ordinary income If sale > BV (greater than cost) ==> anything above cost, taxed as capital gain, rest taxed as recaptured depreciation If sale < BV ==> capital loss ==> tax savings
 ==> recaptured depreciation, taxed as ordinary income. If sale > BV (greater than cost) ==> anything above cost, taxed as capital gain, rest taxed as recaptured depreciation. If sale < BV. ==> capital loss ==> tax savings.")
64
Annual Free Cash Flows Annual free cash flow is the incremental after-tax cash flow resulting from the project being considered. Free Cash flow considers the following: Cash flow from operations Cash flows from working capital requirements Cash flows from capital spending

65
Calculating Operating Cash Flows
Step 1: Measure the project’s change in operating cash flows: Operating cash flows = Changes in EBIT- Changes in taxes Change in depreciation Note, depreciation is a non-cash expense but influences the cash flows through impact on taxes (see next two slides).
.")
66
Calculating Operating Cash Flows: Depreciation & Cash Flow
Earnings before Tax and Dep. 40,000 Depreciation 25,000 Earnings before tax (EBT) 15,000 If the corporation is taxed at 30%, taxes = 0.3*15000 = $4,500 If the depreciation was $0, EBT = $40,000 and taxes = 0.3*40000 = $12,000
 15,000. If the corporation is taxed at 30%, taxes = 0.3*15000 = $4,500. If the depreciation was $0, EBT = $40,000 and taxes = 0.3*40000 = $12,000.")
67
Calculating Operating Cash Flows: Depreciation & Cash Flow
==> Depreciation is a “non-cash expense” BUT affects Cash Flow through its impact on “taxes”; Depreciation ==> in Expense ==> in taxes ==> CF

68
Calculating Operating Cash Flows: Change in Net Working Capital
Step 2: Calculate the cash flows from the change in net working capital This refers to additional investment in current assets minus any additional short-term liabilities that were generated.

69
Calculating Operating Cash Flows
Step 3: Determine the cash flows from the change in capital spending This refers to any capital spending requirements during the life of the project.

70
Calculating Operating Cash Flows: Putting it all together
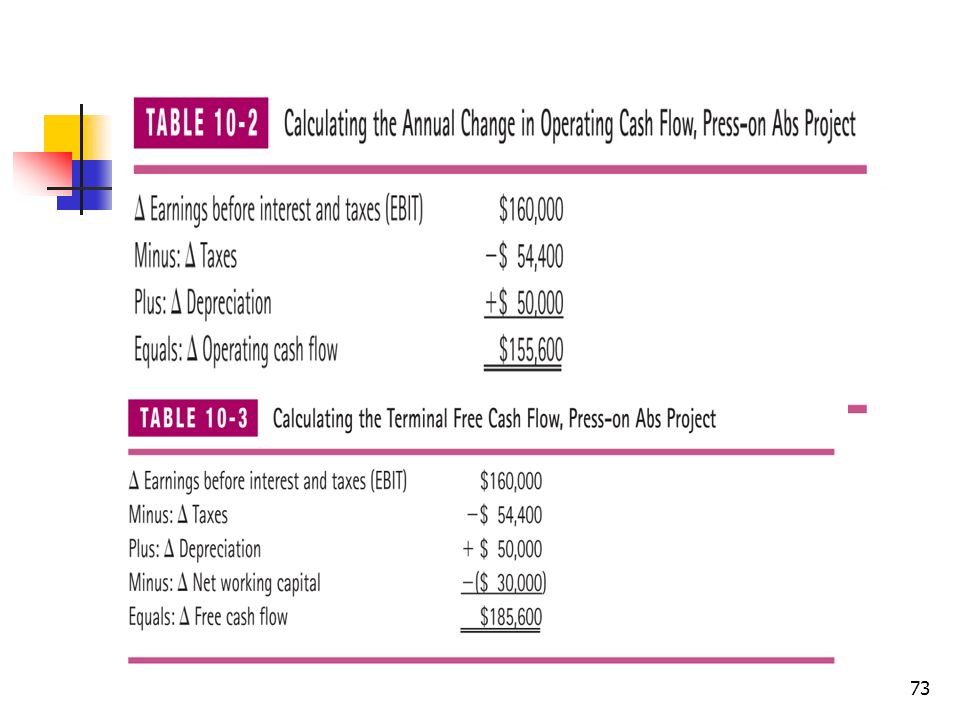
Step 4: Project free cash flows = change in EBIT - changes in taxes + change in depreciation - change in net working capital - change in capital spending

71
Terminal Cash Flow Terminal cash flows are flows associated with the project at termination. It may include: Salvage value of the project. Any taxable gains or losses associated with the sale of any asset.

72
Example

74
Options in Capital Budgeting
Options add value to capital budgeting projects. Some common options are: Option to delay a project Option to expand a project Option to abandon a project

75
Option to Delay Almost every project has a mutually exclusive alternative – waiting and pursuing at a later time. It is conceivable that a project with a negative NPV now may have a positive NPV if undertaken later on. This could be due to various reasons such as favorable changes in fashion, technology, economy, or borrowing costs.

76
Option to Expand Even if a project is currently unprofitable, it may be useful to determine whether the profitability of the project will change if the company is able to expand in the future. Example: Firms investing in negative NPV projects to gain access to new markets.

77
Option to Abandon It may be necessary to abandon the project before its estimated life due to inaccurate project analysis models or cash flow forecasts or due to changes in market conditions. When comparing two projects with similar NPVs, the project that is easier to abandon may be more desirable (example, temporary versus permanent workers, lease versus buy).
.")
78
Risk and Capital Budgeting Decisions
Two main issues: What is risk and how should it be measured? How should risk be incorporated into a capital budgeting analysis?

79
Three perspectives on risk
Project standing alone risk Contribution-to-firm risk Systematic risk

80
Project Standing Alone Risk
A project’s risk, ignoring the possibility that much of the risk will be diversified away as the project is combined with other projects and assets.

81
Contribution-to-Firm Risk
This is the amount of risk that the project contributes to the firm as a whole. This measures the project’s risk considering the diversification away of risk, but ignores the effects of diversification on the firm’s shareholders.

82
Systematic Risk Risk of the project from the viewpoint of a well-diversified shareholder. This measure takes into account that some of the risk will be diversified away as the project is combined with the firm’s other projects and in addition, some of the remaining risk will be diversified away by the shareholders as they combine this stock with other stocks in their portfolios.

83
Relevant risk Theoretically, the only risk of concern to shareholders is systematic risk. Since the project’s contribution-to-firm risk affects the probability of bankruptcy for the firm, it is a relevant risk measure. Thus we need to consider both the project’s contribution-to-firm risk and the project’s systematic risk.

84
Incorporating Risk into Capital Budgeting
We know that investors demand higher returns for riskier projects. As the risk of a project increases, the required rate of return is adjusted upward to compensate for the added risk. This risk adjusted discount rate is then used for discounting free cash flows (in NPV model) or as the benchmark required rate of return (in IRR model).
 or as the benchmark required rate of return (in IRR model).")
85
Measurement of Systematic Risk
Estimating the risk of a project can be difficult. Historical stock return data relates to an entire firm, rather than a specific project or division. Risk must be estimated. Options to estimate risk include: Accounting Beta Pure Play Method Simulation Scenario Analysis Sensitivity Analysis

86
A CRITIQUE OF INVESTMENT APPRAISAL METHODS
NPV is better than both PP and ARR because: NPV considers the time value of money or timing of cash flows by using discount factors. Discounted cash flow implies taking opportunity cost of capital into account. NPV treats each cash flow of a specific year differently using different discounting factors. All cash flows are interdependent in affecting NPV and are taken into consideration. NPV is in line with the objective of the business: NPV>0 increases shareholder wealth All relevant and measurable financial information related to decision is exploited in calculating NPV. The main problem of IRR: it does not emphasise wealth maximisation IRR does not consider the scale of the investment. IRR’s focus is only the rate comparison. NPV is more reliable than IRR.

87
INVESTMENT APPRAISAL: CONCLUDING REMARKS
Each appraisal method has shortcomings: The problem with NPV: it is assumed that expected future cash inflows will be realised. Many companies use more than one method and compare the outcome of each method. Companies have the tendency to use methods which consider time value of cash flows, i.e., IRR and NPV Human behaviour is also an important factor in affecting investment decisions.

Similar presentations


 Capital Budgeting: An Overview Estimating Incremental Cash Flows Payback Period Net Present Value >")


