Download presentation
Presentation is loading. Please wait.

1
How they are constructed and how they are used in contract escalation
The U.S. Bureau of Labor Statistics: Consumer and Producer Price Indexes How they are constructed and how they are used in contract escalation Annual Meeting April , 2013 Orlando, Florida

2
U.S. Bureau of Labor Statistics: Consumer and Producer Price Indexes
How they are constructed and how they are used in contract escalation Michael W. Horrigan, Ph.D. Associate Commissioner Office of Prices and Living Conditions Annual Meeting April , 2013 Orlando, Florida

3
Outline Overview of the BLS
Consumer Price Index for All Urban Consumers (CPI-U) Producer Price Index Using Price Indexes to Escalate Contracts CPI-U, CPI-W and Social Security, and the CPI-E Chained CPI-U
 Producer Price Index. Using Price Indexes to Escalate Contracts. CPI-U, CPI-W and Social Security, and the CPI-E. Chained CPI-U.")
4
Overview of the BLS The U.S. Bureau of Labor Statistics (BLS) collects, analyzes, and publishes a vast array of data on our economy and our society. We provide critical information on inflation, employment, unemployment, and productivity that are used by government policy makers, the media, workers, business leaders, consumers, and job seekers.

5
Principal Federal Economic Indicators
BLS Programs Principal Federal Economic Indicators produced by the BLS: Producer Price Indexes Productivity and Costs Real Earnings U.S. Import and Export Price Indexes Consumer Price Index Employment Cost Index The Employment Situation Civilian Unemployment Rate Nonagricultural Payroll Employment

6
Overview of the Consumer Price Index (CPI) Program
Goal of the CPI Scope / Coverage Classification System Weighting Sampling Data Collection Estimation Publication (Slight updates and edits, Steve Reed 1/19/2011) The intent of this module is to follow the entire process from conceptual foundation to data collection to publication. Rather than as a dry listing of topics, this slide may be used to emphasize how large and complex a task producing and disseminating the CPI is.
 The intent of this module is to follow the entire process from conceptual foundation to data collection to publication. Rather than as a dry listing of topics, this slide may be used to emphasize how large and complex a task producing and disseminating the CPI is.")
7
Goal and Scope of the CPI
The goal of the CPI is to approximate a cost of living index. Cost of living is a theoretical concept. The CPI seeks to measure the change in the cost of living by measuring the change in prices that consumers pay for a market basket of goods and services. The CPI reflects prices paid by consumers in urban areas of the U.S. for a market basket of goods and services. Any item purchased for consumption, goods or services, is potentially eligible for pricing. -It is the explicit goal of the U.S. CPI to approximate a cost of living index. This conceptual goal was endorsed by the Boskin Commission in 1996 and affirmed in the CNSTAT report in This goal guides important decisions about the CPI. Here is the statement from the BLS Handbook of Methods: As it pertains to the CPI, the COLI for the current month is based on the answer to the following question: “What is the cost, at this month’s market prices, of achieving the standard of living actually attained in the base period?” This cost is a hypothetical expenditure—the lowest expenditure level necessary at this month’s prices to achieve the base-period’s living standard. The ratio of this hypothetical cost to the actual cost of the base-period consumption basket in the base period is the COLI. Unfortunately, because the cost of achieving a living standard cannot be observed directly, in operational terms a COLI can only be approximated. Although the CPI cannot be said to equal a cost-of-living index, the concept of the COLI provides the CPI’s measurement objective and the standard by which we define any bias in the CPI. BLS long has said that it operates within a cost-of-living framework in producing the CPI. That framework has guided, and will continue to guide, operational decisions about the construction of the index. However, it is not universal for all consumer price indexes. In many countries, the CPI does not have cost of living as a conceptual goal, and Eurostat’s Harmonized Index of Consumer Prices (HICP) explicitly asserts that it is not a cost of living index. As background, this is the statement by Eurostat about the OECD: The HICP may thus be described as a Laspeyres-type ‘consumer inflation’ or ‘pure price’ index measuring average price change on the basis of the changed expenditure of maintaining the consumption pattern of households and the composition of the consumer population in the base or reference period. ‘Pure’ means that, strictly speaking, it is only the changes in prices that are reflected in the measure between the current and the base or reference period. The HICP is not a cost of living index. That is, it is not a measure of the change in the minimum cost for achieving the same ‘standard of living’ (i.e. constant utility) from two different consumption patterns realised in the two periods compared and where factors other than pure price changes may enter the index.
 explicitly asserts that it is not a cost of living index. As background, this is the statement by Eurostat about the OECD: The HICP may thus be described as a Laspeyres-type ‘consumer inflation’ or ‘pure price’ index measuring average price change on the basis of the changed expenditure of. maintaining the consumption pattern of households and the composition of the consumer. population in the base or reference period. ‘Pure’ means that, strictly speaking, it is only. the changes in prices that are reflected in the measure between the current and the base or. reference period. The HICP is not a cost of living index. That is, it is not a measure of the. change in the minimum cost for achieving the same ‘standard of living’ (i.e. constant. utility) from two different consumption patterns realised in the two periods compared and. where factors other than pure price changes may enter the index.")
8
Classification system
In the CPI, the consumer market basket is a categorization of goods and services with corresponding weights. In the U.S. there are 211 categories of items (goods and services) that are aggregated into eight major groups: Food And Beverages Housing Apparel Transportation Medical Care Recreation Education and Communication Other Goods and Services The classification system is unique and does not correspond to other economic classification systems such as NAICS or COICOP, or to the CPI of other countries. It is from the point of view of consumers; items are in the same group if they are seen as similar by consumers, not if they are produced by the same companies or using similar technology.
 that are aggregated into eight major groups: Food And Beverages. Housing. Apparel. Transportation. Medical Care. Recreation. Education and Communication. Other Goods and Services. The classification system is unique and does not correspond to other economic classification systems such as NAICS or COICOP, or to the CPI of other countries. It is from the point of view of consumers; items are in the same group if they are seen as similar by consumers, not if they are produced by the same companies or using similar technology.")
9
Weighting The Consumer Expenditure Survey (CE)—source of weighting for CPI--consists of two separate surveys: Quarterly interview survey—asks consumers about major purchases over 5 consecutive quarters Diary survey—asks consumers to keep diary of frequently purchased items over two weeks Used to create expenditure weights to construct the CPI market basket. Weights are updated every two years. Current CPI weights are based on consumer expenditures in The CPI weights used to be updated only with the major CPI revisions which occurred about once every ten years. The more frequent updates are an important improvement in terms of keeping the market basket up-to-date. This improvement addressed one of the issues raised in the 1996 Boskin Report. The report focused attention on three key possible sources of bias in the CPI: substitution, quality change, and new goods. More frequent weight updating and sample rotation may reduce new goods bias in the CPI.

10
Sampling / Geography The CPI reflects prices paid by consumers in urban areas of the U.S. Based on Census and OMB definitions, 87 geographic areas are selected to represent the urban population. Referred to as Primary Sampling Units (PSUs) Represent 38 distinct geographical units: large cities plus a combination of the remaining 56 smaller areas into 7 geographical units The definition of “urban” here is broad and encompasses over 80 percent of the population.
 Represent 38 distinct geographical units: 31 large cities plus a combination of the remaining 56 smaller areas into 7 geographical units. The definition of urban here is broad and encompasses over 80 percent of the population.")
11
For the purpose of selecting the 1998 CPI PSU sample, the entire United States was divided into PSUs. First, BLS used the U.S. Office of Management and Budget’s (OMB’s) definition of Metropolitan Areas (MAs) to divide the country into metropolitan and nonmetropolitan areas. Each PSU was first classified by its size. -All PSUs with populations larger than 1.5 million were declared to be self representing and given the size class of A. Anchorage and Honolulu are A PSUs with smaller populations. -The remaining non-self-representing PSUs, metropolitan and nonmetropolitan, are called B and C PSUs, respectively. -Prices collected in B PSUs are used to compute size class B/C CPIs -Prices collected in C PSUs are used to compute size class D CPIs - Note that there are entire states where no CPI data is collected. CPI data is not available by state or by county.

12
Data collection / Outlets
The geographic sample and market basket form the component cells that are used to build the CPI. Item categories x Geography Units = 211 item categories x 38 geography units = 8018 cells Indexes calculated for each cell The Telephone Point-of-Purchase Survey (TPOPS) of households is used to create the frame of outlets (stores, medical offices, web sites) for the collection of data in each of the 87 PSUs. Example of cells include “Milk in Atlanta” or “sporting goods in South size class BC”
 of households is used to create the frame of outlets (stores, medical offices, web sites) for the collection of data in each of the 87 PSUs. Example of cells include Milk in Atlanta or sporting goods in South size class BC")
13
Data Collection / Outlets
BLS Field Representatives visit outlets and use Computer Assisted Data Collection (CADC) to select and price items using probability sampling. Items are described completely in terms of price determining characteristics using the CPI Checklist. Sample rotation allows the sample of specific items in the CPI to stay up-to-date. Each outlet/item sample is replaced every four years, 1/8th of the sample every 6 months. An example is often useful here, and it should be emphasized that this process takes place individually for each quote, so that the sample as a whole contains many different varieties of a particular good or service. For example, consider collecting data on the price of flowers. A CPI representative might first ask a representative of a selected outlet what percentage of revenue is obtained from sales of roses, carnations, tulips, etc. Further iterations might narrow down the color and quantity of flower, perhaps resulting in a dozen red roses being priced. In another flower outlet, however, a different exact item will be chosen and the flower example as a whole will contain many types, colors, and varieties of flowers. The process is similar for other products.
 to select and price items using probability sampling. Items are described completely in terms of price determining characteristics using the CPI Checklist. Sample rotation allows the sample of specific items in the CPI to stay up-to-date. Each outlet/item sample is replaced every four years, 1/8th of the sample every 6 months. An example is often useful here, and it should be emphasized that this process takes place individually for each quote, so that the sample as a whole contains many different varieties of a particular good or service. For example, consider collecting data on the price of flowers. A CPI representative might first ask a representative of a selected outlet what percentage of revenue is obtained from sales of roses, carnations, tulips, etc. Further iterations might narrow down the color and quantity of flower, perhaps resulting in a dozen red roses being priced. In another flower outlet, however, a different exact item will be chosen and the flower example as a whole will contain many types, colors, and varieties of flowers. The process is similar for other products.")
14
Data Collection / Outlets
Based on the TPOPS survey, the commodity product or service line(s) (e.g., apples) to be priced in each outlet is known in advance of visiting the outlet. During the initiation interview at an outlet, a process known as disaggregation is performed to determine the exact items to be priced within these product or service lines. The exact items are chosen using statistical methods that give individual items a chance to be selected proportional to their sales for that particular product or service line at the selected outlet.
 (e.g., apples) to be priced in each outlet is known in advance of visiting the outlet. During the initiation interview at an outlet, a process known as disaggregation is performed to determine the exact items to be priced within these product or service lines. The exact items are chosen using statistical methods that give individual items a chance to be selected proportional to their sales for that particular product or service line at the selected outlet.")
15
Data Collection / Outlets
CPI price data are collected throughout the entire month. The month is divided into three pricing periods, with field representatives required to collect data during each period. The price sought in the CPI is the retail, transaction price paid by the consumer, including sales and excise taxes. Each month a field staff of about 350 part-time economic assistants and 100 full-time economists collects prices for over 83,000 individual items based on personal visits to more than 23,000 outlets in 87 cities. Again the emphasis is that the CPI is from the point of view of the consumer; we are concerned with what comes out of the consumer’s pocket, not what the seller receives. This contrasts with the PPI.

16
Data Collection / Housing
A survey of 32,000 housing rental units tracks the rate of inflation in housing services. Provides data for measuring changes in shelter costs for consumers who rent (about 32 percent of all consumers). Also provides data for measuring changes in shelter costs for consumers who own their own homes (about 68 percent of all consumers). This latter index is estimated based on the concept of rental equivalence or the market rent that would be charged for these owner occupied dwellings if they were rented.
. Also provides data for measuring changes in shelter costs for consumers who own their own homes (about 68 percent of all consumers). This latter index is estimated based on the concept of rental equivalence or the market rent that would be charged for these owner occupied dwellings if they were rented.")
17
Estimation The CPI-U is constructed in two stages.
In Stage 1 indexes for each item/area cell are constructed from a sample of prices. Types of steak in Chicago In Stage 2 those indexes are aggregated across item/areas. Steaks in Chicago, Hamburger in Chicago, Steaks in LA, etc. The CPI uses either a geometric mean or a Laspeyres formula for calculating inflation in stage 1 and a Laspeyres formula for indexes in stage 2. “Lower level” can be seen as substitution within cells in the matrix of basic indexes. “Upper level” is substitution across cells.

18
No substitution is assumed between hamburger and steak
Estimation Meats Steak Porterhouse Sirloin Ribeye Hamburger Regular Lean Extra Lean Consumers assumed to substitute among types of steak when prices change No substitution is assumed between hamburger and steak

19
Estimation The geometric mean formula implicitly assumes a degree of substitution among the items used in calculating a price index. The Laspeyres formula does not allow any such substitution and by construction is an upper bound to the change in the cost of maintaining a standard of living. Substitution among different types of steak in stage 1 Does not assume substitution of hamburger for steak in stage 2 Note: The Laspeyres formula is used in Stage 1 for certain items such as surgery (consumers do not substitute among different kinds of surgery) Background: The CPI uses a geometric means formula within cells (lower level) for items in which substitution is reasonable. Substitution between types of ice cream or window coverings, for example. A laspeyres formula is used when substitution seems impractical or unlikely, as in rent and most medical care indexes. Basic indexes are aggregated using a laspeyres formula—hence there is no substitution assumed between fruits and vegetables (or beef and chicken or gasoline and airfare). Assumptions about substitution are a frequent source of misunderstanding about the CPI.
 Background: The CPI uses a geometric means formula within cells (lower level) for items in which substitution is reasonable. Substitution between types of ice cream or window coverings, for example. A laspeyres formula is used when substitution seems impractical or unlikely, as in rent and most medical care indexes. Basic indexes are aggregated using a laspeyres formula—hence there is no substitution assumed between fruits and vegetables (or beef and chicken or gasoline and airfare). Assumptions about substitution are a frequent source of misunderstanding about the CPI.")
20
Estimation/Publication
Quality adjustment Direct comparison, Imputation, Hedonic regression Seasonal Adjustment Publication CPI-U All Items U.S. City Average CPI for urban consumers CPI breakdowns for food, energy, and all items less food and energy often receive attention. CPI-W, CPI-E, and Chained CPI-U Operationally the CPI deals with quality change in several different ways. For any given item being priced, the CPI economic assistant in the field must determine if the item has changed in any way, that is to say has been replaced with a new version. If the original and new versions are essentially the same, a commodity expert may deem them directly comparable and use the price comparison as if no quality change had occurred. If the versions are substantially different, then some sort of quality adjustment procedures must be used. These procedures can be categorized either as imputation or direct quality adjustment. Methods of adjustment: -Cell-relative imputation, sometimes called “linking,” imputes the price change for the noncomparable versions by the price change of all the other similar items in the same geographic area. Thus the price change for that quote is estimated as being the same percentage change as the price change for the cell for that item stratum and index area. -Class-mean imputation is used when price change is closely associated with introduction of new lines or models, such as in the New Vehicles category. With class-mean imputation the price change is estimated from the other observations going through replacement at the same time that were either quality adjusted directly or judged directly comparable. -Direct quality adjustment refers to the analyst making an estimate of the quantitative value of a quality change. This is done either based on manufacturer cost data or on estimates of the value to consumers of particular features of the good in question. Often these values are estimated using hedonic models and this technique is referred to as hedonics. Hedonics is widely considered the most promising technique for direct quality adjustment, and the CPI employs it for an increasing number of categories of goods. In practice, the hedonic approach gives BLS analysts another tool to consider when confronted with the problem of quality change. -The use of hedonic quality adjustment is another frequent source of misunderstanding about the CPI. BLS research shows that the implementation of hedonic quality adjustment methods has had very little impact on the change in the all items index compared to previous methods. -Improved quality adjustment procedures address the quality change bias issues raised in the Boskin Report.

21
Publication Tools for Dissemination of CPI Data
CPI news release available to public at 8:30 a.m. on release day Press Release Detailed Report: Electronically Available Telephone Available ( requests: Dissemination. Data are released monthly; usually released mid-month for the prior month’s data (i.e., June 13 for May data). Release dates are announced one year in advance. Data for a given month is embargoed from the general public until 8:30am. Lock-Up for press on Release Day from 8:00 to 8:30am. Press Release. Main publication tool (show example) developed for use of media and general public. Detailed Report. is now published on line. Telephone. Users can call for index information and assistance. Available online 21
. Release dates are announced one year in advance. Data for a given month is embargoed from the general public until 8:30am. Lock-Up for press on Release Day from 8:00 to 8:30am. Press Release. Main publication tool (show example) developed for use of media and general public. Detailed Report. is now published on line. Telephone. Users can call for index information and assistance. Available online. 21.")
22
Outline Overview of the BLS
Consumer Price Index for All Urban Consumers (CPI-U) Producer Price Index Using Price Indexes to Escalate Contracts CPI-U, CPI-W and Social Security, and the CPI-E Chained CPI-U
 Producer Price Index. Using Price Indexes to Escalate Contracts. CPI-U, CPI-W and Social Security, and the CPI-E. Chained CPI-U.")
23
Goal of the PPI The goal of the PPI is to measure the change in revenue received by a producer for the output produced using a fixed stock of labor, capital, and technology.

24
What does the PPI measure?
PPI measures changes in net revenues received by producers of goods or services for a specific item. Price-determining variables could include: Kind of buyer Product or service Transaction terms Time of purchase Sales promotion techniques such as rebates or financing plans are reflected, as they affect the net proceeds of the producer. Changes in excise taxes are not reflected.

25
PPI Coverage PPI data include the output of all industries in the goods-producing sectors of the U.S. economy such as mining, manufacturing, agriculture, and construction, as well as goods competitive with those made in the producing sectors, such as waste and scrap materials. PPI is continually expanding coverage of service industries. The program covers a majority of the service sector's output, publishing data for selected industries in various industry sectors including: wholesale and retail trade transportation and warehousing information finance and insurance real estate brokering rental, and leasing professional, scientific, and technical services administrative, support, and waste management services health care and social assistance accommodation

26
PPI Coverage Actual coverage of in-scope marketed output of the U.S. economy by PPI: Sector ’07 GDP Share PPI Coverage (FY2012) Goods Services Total 27.3 % % 72.7 % % 100.0 % %

27
PPI publication structures
Three main PPI publication structures: Industry-based (NAICS) Over 600 industry price indexes and over 4,900 specific product line and product category sub-indexes Commodity-based (PPI) Over 4,700 commodity price indexes organized by type of product and end use Stage-of-processing based Aggregate price indexes organized by commodity-based processing stage—Crude Materials for Further Processing; Intermediate Materials, Supplies, and Components; and Finished Goods
 Over 600 industry price indexes and over 4,900 specific product line and product category sub-indexes. Commodity-based (PPI) Over 4,700 commodity price indexes organized by type of product and end use. Stage-of-processing based. Aggregate price indexes organized by commodity-based processing stage—Crude Materials for Further Processing; Intermediate Materials, Supplies, and Components; and Finished Goods.")
28
PPI data revision Producer Price Indexes are subject to change after being published: After an index is first published, it is subject to recalculation to take into account late survey reports and corrections by respondents. Every index is recalculated on a systematic basis—four index months after being first published. Previously published seasonally adjusted indexes are also subject to change in January when new seasonal factors are calculated and applied to the most recent five years of data.

29
Publication Over 1,000 indexes for specific outputs of industries in the services sector and other sectors that do not produce physical products; Several major aggregate measures of price change organized by commodity-based, industry-based and stage of processing.

30
Publication Tools for Dissemination of PPI Data
PPI news release available to public at 8:30 a.m. on release day Press Release Detailed Report: Electronically Available Telephone (202) Available ( Dissemination. Data are released monthly; usually released mid-month for the prior month’s data (i.e., June 13 for May data). Release dates are announced one year in advance. Data for a given month is embargoed from the general public until 8:30am. Lock-Up for press on Release Day from 8:00 to 8:30am. Press Release. Main publication tool (show example) developed for use of media and general public. Detailed Report. is now published on line. Telephone. Users can call for index information and assistance. Available online 30
 Available ( Dissemination. Data are released monthly; usually released mid-month for the prior month’s data (i.e., June 13 for May data). Release dates are announced one year in advance. Data for a given month is embargoed from the general public until 8:30am. Lock-Up for press on Release Day from 8:00 to 8:30am. Press Release. Main publication tool (show example) developed for use of media and general public. Detailed Report. is now published on line. Telephone. Users can call for index information and assistance. Available online. 30.")
31
Using the Producer Price and Consumer Price Indexes for Contract Escalation
The Producer Price Index (PPI) measures the average change over time in the selling prices received by domestic producers of goods and services The Consumer Price Index (CPI) measures the average change over time in the prices paid by urban consumers for a defined market basket of consumer goods and services
 measures the average change over time in the selling prices received by domestic producers of goods and services The Consumer Price Index (CPI) measures the average change over time in the prices paid by urban consumers for a defined market basket of consumer goods and services")
32
PPI for escalation Hundreds of billions of dollars in contract values are tied to Producer Price Indexes (PPI) through price escalation clauses, which are common in both government and private sector contracts. These price escalation clauses are used to protect both the buyer and the seller from unanticipated surges or drops in prices.
 through price escalation clauses, which are common in both government and private sector contracts. These price escalation clauses are used to protect both the buyer and the seller from unanticipated surges or drops in prices.")
33
PPI for escalation Private firms use PPI data to compare changes in material costs they incur against changes in the PPI for the material in question. Private firms also compare changes in the prices they charge with changes in the PPI

34
PPI for escalation Generally, an index should be chosen that represents the costs for providing a particular product or service, rather than indexes for the products or services themselves. For example, if an apparel manufacturer is contracting for long-term purchases with a producer of finished fabrics, it would be more advisable to tie the escalation clause to a PPI for synthetic fibers rather than to a PPI for a type of finished fabric.

35
PPI for escalation While detailed indexes may target costs more specifically, such indexes are more likely to be discontinued by BLS, or to have occasional gaps in availability. Contracts should provide for these contingencies, and may minimize them if they cite only the higher-level categories. In addition, because of the unavailability of certain indexes, proxies must sometimes be chosen to estimate price movements for some series.

36
PPI guidelines for escalation
General guidelines (similar to those for CPI escalation): ESTABLISH the base selling price subject to escalation. SELECT an appropriate index or indexes. IDENTIFY clearly the selected index and cite appropriate source. SPECIFY that the selected index will not be seasonally adjusted.
: ESTABLISH the base selling price subject to escalation. SELECT an appropriate index or indexes. IDENTIFY clearly the selected index and cite appropriate source. SPECIFY that the selected index will not be seasonally adjusted.")
37
PPI guidelines for escalation
General guidelines (continued): STATE the frequency of price adjustment. PROVIDE for missing or discontinued data. SPECIFY that calculations of price adjustments shall always use the latest version of the PPI data published. AVOID locking indexes used for escalation into any particular reference base periods. DEFINE the mechanics of price adjustment.
: STATE the frequency of price adjustment. PROVIDE for missing or discontinued data. SPECIFY that calculations of price adjustments shall always use the latest version of the PPI data published. AVOID locking indexes used for escalation into any particular reference base periods. DEFINE the mechanics of price adjustment.")
38
Calculating a contract escalation using the PPI
Escalation agreements using the PPI usually involve changing the contract’s base payment by the percent change in the level of the PPI between the reference period and a subsequent time period. Again, this is calculated by first determining the index point change between the two periods and then the percent change. Let’s look at the percent change from January 2011 to 2012…

39
Escalation example: Calculating a percent change
Computation of percent change: PPI for Jan Less PPI for Jan Equals index point change 3.5 Divided by previous period PPI 3.5 / 121.7 Equals 0.029 Results multiplied by X 100 Equals percent change 2.9 * PPI for machinery manufacturing for January 2011 and 2012 In this example, first-published (preliminary) indexes are used
 indexes are used.")
40
Percent change formula
PPI for current − PPI for previous period period X 100 PPI for previous period

41
Escalation example: Applying a percent change
If a 1-year contract has a base price of $15,000 and begins December 2010: Base price 15,000 Dec percent change divided by / 100 Equals 0.029 Multiply base price by percent change 15,000 X .029 Equals 435 Results plus base price 15, Equals adjusted price 15,435 * PPI percent change for machinery manufacturing for December 2011 In this example, first-published (preliminary) indexes are used
 indexes are used.")
42
New PPI series retrieval tool
Go to PPI home page Look for ‘Guide to Retrieving PPI data’ Find the series code you want Click on ‘PPI Industry Data’ tab or ‘PPI Commodity Data’ tab Click on ‘text’ or ‘excel’ to get the list of available indexes Find your index (there are thousands!) Gulp / write it down! Under ‘Get PPI Data’ click on: ‘Click here for Series Report (opens in a new window)’ Enter your series ID Choose your options and get your data!
 Gulp / write it down! Under ‘Get PPI Data’ click on: ‘Click here for Series Report (opens in a new window)’ Enter your series ID. Choose your options and get your data!")
43
Using the CPI for Contract Escalation
Advice is similar to that of using PPI for contract escalation Use Not seasonally adjusted data Generally CPI-U for all items is used CPI-U for published item strata do not go in and out of publication

44
Outline Overview of the BLS
Consumer Price Index for All Urban Consumers (CPI-U) Producer Price Index Using Price Indexes to Escalate Contracts CPI-U, CPI-W and Social Security, and the CPI-E Chained CPI-U
 Producer Price Index. Using Price Indexes to Escalate Contracts. CPI-U, CPI-W and Social Security, and the CPI-E. Chained CPI-U.")
45
The CPI-U, CPI-W, and CPI-E
The CPI-U, CPI-W, and the CPI-E, which are defined precisely in the next few slides, all use the same price index formulas. Substitution allowed in stage 1 No substitution allowed in stage 2 The CPI-U, CPI-W, and the CPI-E differ in terms of consumer expenditure weights and the target population groups associated with these weights. U – all urban consumers W – urban consumers in wage and clerical households E – urban consumers in elderly households

46
CPI-U and the CPI-W The CPI for all urban consumers, CPI-U, represents the spending habits of about 88 percent of the population of the U.S. The CPI for Urban Wage Earners and Clerical Workers, CPI-W, represents the spending habits of about 28 percent of the population of the U.S. More than 50 percent of total income must come from earnings in wage or clerical occupations.

47
Social Security Social Security benefits are revised annually based on changes in the CPI-W. In 2013, about 58 million Americans received about $821 billion in Social Security payments. Why does the Social Security Administration use the CPI-W to adjust Social Security payments? At the time when Social Security payments were first indexed using the CPI in 1975, the CPI-U did not exist as an index.

48
Social Security When the CPI-U was introduced in 1978, it replaced the then current CPI with one based on a representation of all Urban Consumers instead of Urban Wage Earners and Clerical Workers. The CPI-W is essentially the index that is a continuation of the CPI prior to 1978, and given its use since 1975, the decision was made by the Social Security Administration to continue the use of the CPI-W as the basis for adjusting Social Security benefits.

49
Social Security Cost of Living Adjustments, 2008-2012
Year % change from previous peak Official COLA 2008 5.8% 2009 -2.1% 0.0% 2010 -0.6% 2011 3.6% 2012 1.7%

50
CPI-E The experimental CPI for the Elderly, CPI-E, representing Americans ages 62 and older, was developed in 1987 at the request of Congress. The series was reconstructed back to December 1982. For the experimental CPI-E, we calculate weights for a subset of households where the reference person or their spouse is age 62 or older. Coverage is about 16 percent of the population.

51
CPI Relative Importances, December 2012 CPI-U CPI-W CPI-E
All items 100.0 Food and beverages 15.3 15.9 13.1 Food at home 8.6 9.4 8.0 Food away from home 5.7 4.3 Alcoholic beverages 0.9 0.7 Housing 41.0 39.9 45.5 Shelter 31.7 30.6 35.2 Rent of primary residence 6.5 9.0 3.9 Owners' equivalent rent 24.0 20.9 30.1 Fuel oil 0.2 0.4 Apparel 3.6 2.4 Transportation 16.8 19.0 14.8 Motor Fuel 5.5 7.0 4.2 Medical Care 7.2 5.8 11.7 Medical Care Commodities 1.7 1.3 3.1 Medical Care Services 5.4 4.4 Recreation 6.0 Education and Communication 6.8 3.8 College Tuition and Fees 1.4 Other Goods and Services 3.4 3.5 3.3 Tobacco & smoking products 0.8 1.2 0.6 1123

52
Limitations of the CPI-E
Scope Includes spending by non-Social Security recipients. Does not include surviving spouses less than 62 or their minor children receiving Social Security. Does not include elderly living with families (e.g., their children) where the reference person and spouse are younger than 62. Geography Uses geographic sample for the CPI-U, not designed specifically to reflect where older Americans live.
 where the reference person and spouse are younger than 62. Geography. Uses geographic sample for the CPI-U, not designed specifically to reflect where older Americans live.")
53
Limitations of the CPI-E
Weighting CPI-U based on 76,000 interviews. CPI-W based on 22,500 interviews. CPI-E based on 19,400 interviews. Both the CPI-W and CPI-E have higher variances than the CPI-U. Retail Outlets Uses the retail outlet frame for the CPI-U; the sample is not designed to reflect where older Americans shop.

54
Limitations of the CPI-E
Collecting the right item and the right price Uses the prices collected for items selected to represent the purchasing patterns of the CPI-U. The items and prices may not be representative of the purchasing patterns of older urban consumers. For any item category (apples), the retail stores cannot reliably report the revenue they receive from sales of different apple types to older urban consumers. Senior citizen discount rates are far more prevalent for the older American population than the urban population as a whole.
, the retail stores cannot reliably report the revenue they receive from sales of different apple types to older urban consumers. Senior citizen discount rates are far more prevalent for the older American population than the urban population as a whole.")
55
What is the C-CPI-U? The Chained Consumer Price Index for All Urban Consumers (C-CPI-U). First produced in 2002, data back to January 2000 (December 1999=100). The final C-CPI-U is designed to be a closer approximation to a cost-of-living index in that it reflects changes in consumer spending patterns across CPI item categories every month. Differs from the CPI-U in both weighting and formula. It is released monthly with the CPI-U and CPI-W, but is subject to two annual revisions before becoming final. Do we want to mention, Tornqvist, superlative?
. The final C-CPI-U is designed to be a closer approximation to a cost-of-living index in that it reflects changes in consumer spending patterns across CPI item categories every month. Differs from the CPI-U in both weighting and formula. It is released monthly with the CPI-U and CPI-W, but is subject to two annual revisions before becoming final. Do we want to mention, Tornqvist, superlative")
56
The Chained Consumer Price Index (C-CPI-U)
Updated data from the Consumer Expenditure Survey are used to create weights that reflect consumer spending each month, allowing a chained index that has weights that reflect consumer spending in the current month and in the previous month. These final expenditure data are available only with a 1-2 year time lag, so the index must be estimated and subsequently revised.

57
Chaining in the C-CPI-U
Each monthly change in the C-CPI-U uses prices and spending weights from the current and previous month. In contrast, the CPI-U and CPI-W use spending weights for a base period, currently In those indexes, price levels in the current month are compared to the levels in the base period. That base period is only updated every two years.

58
Chaining in the C-CPI-U
The C-CPI-U is referred to as “chained” because BLS computes the aggregate final index by linking together month-to-month changes. For example, the percentage change in the C-CPI-U between January and March is the percentage change from January to February multiplied (chained) by the percentage change from February to March.
 by the percentage change from February to March.")
59
Substitution in the C-CPI-U
The C-CPI-U, CPI-U, and CPI-W each allow for substitution within most item categories. Example: when Gala apples go on sale, some consumers switch from Fuji apples to Gala within the Apples item category. The C-CPI-U also captures substitution across item categories. Example: when the relative price of apples increases, consumers shift some apple purchases to other categories of fruit or food.

60
How the C-CPI-U measures substitution
The amount of substitution reflected in the C-CPI-U depends on the observed changes in consumer purchasing patterns when relative prices change. The BLS does not specify which item categories are substitutes; all of the 211 item categories are treated as potential substitutes for one another. Historically, the key contributors to the difference between the CPI-U and C-CPI-U have been in energy and high-tech areas such as gasoline and televisions.

61
Preliminary C-CPI-U Estimates
How does BLS construct initial estimates of the C-CPI-U given that the expenditure weights are only available with a lag? A geometric mean formula is used to estimate the initial C-CPI-U. Revisions to initial C-CPI-U indexes have often been significant. Current research is focused on reducing the difference between the initial estimate and the final index.

62
The C-CPI-U: Publication
Published C-CPI-U values begin with January 2000 (December 1999=100). Final indexes are available through 2011; the 2012 indexes will become final in February 2014. Unlike the CPI-U and CPI-W, C-CPI-U series are not seasonally adjusted.
. Final indexes are available through 2011; the 2012 indexes will become final in February Unlike the CPI-U and CPI-W, C-CPI-U series are not seasonally adjusted.")
63
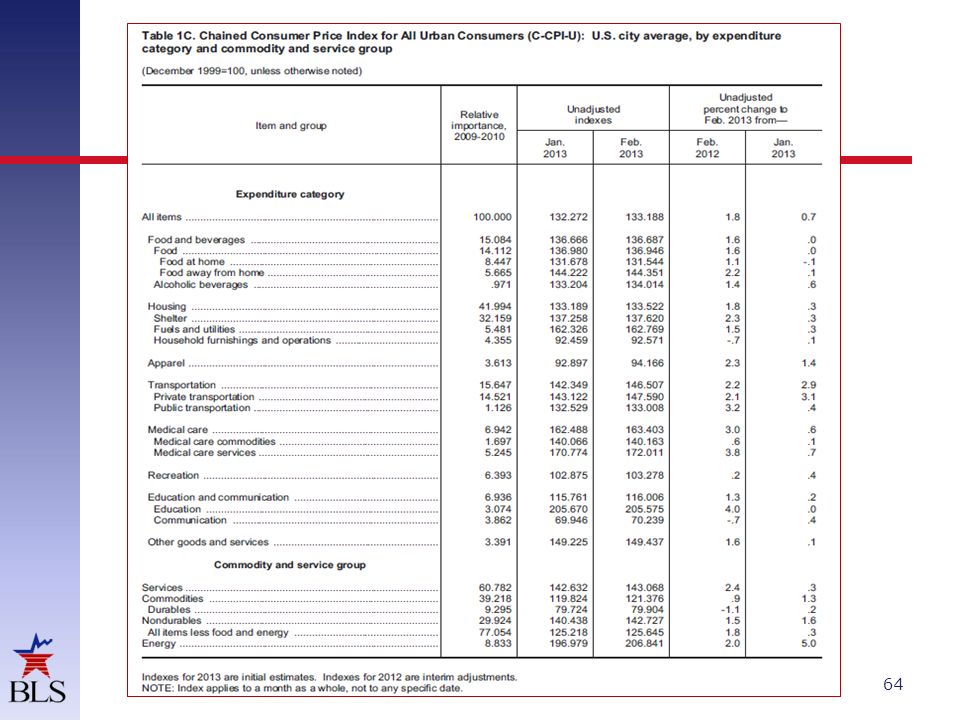
Components of the C-CPI-U
The C-CPI-U is constructed using the same set of items x 38 areas basic component indexes as the CPI-U and the CPI-W. BLS publishes fewer C-CPI-U indexes than for other two index series, however. 27 lower-level C-CPI-U series are published in addition to the All-items, U.S. City Average. Only U.S.-level C-CPI-U series is published. The set of published C-CPI-U series is shown on the next slide. Each index, the all-items and sub-component indexes, is independently constructed by aggregating up from the set of elementary indexes belonging to the aggregate or component. Long term change is then estimated by ‘chaining’ one-month relative together. So yes, component indexes are calculated and ‘chained’.

65
Percentage change Dec 1999 to Dec 2012 for CPI-E (38. 0%), CPI-W (36
Percentage change Dec 1999 to Dec 2012 for CPI-E (38.0%), CPI-W (36.8%), CPI-U (36.4%), and C-CPI-U (31.6%), December 1999=100
, CPI-W (36.8%), CPI-U (36.4%), and C-CPI-U (31.6%), December 1999=100.")
Similar presentations
 = $11,814.9B (5.5%) Q2: GDP = $2,914.38.>")
 Presented by: Maritza Canales Bryan Chua.>")
 is used to measure.>")
 measures the dollar value of all goods and services produced in the U.S. economy in.>")

 Program Presentation to the Council of Professional Associations on Federal.>")


>")


