Download presentation
Presentation is loading. Please wait.

1
COUNTYWIDE TRANSIT CORRIDORS FUNCTIONAL MASTER PLAN Coalition for Smarter Growth Presentation on Staff Recommendations for Bus Rapid Transit Silver Spring Civic Building February 13, 2013

2
Current Schedule February 21, 2013: Update to Planning Board March 18, 2013: Planning Board to approve advertising Public Hearing Draft May 2013: public hearing(s) May-June 2013: worksessions Late July 2013: transmit Planning Board Draft to Council
 May-June 2013: worksessions Late July 2013: transmit Planning Board Draft to Council")
3
Montgomery County Demographic and Travel Forecast Summary based on the 2012 CLRP 20132040Difference Percent Difference Population 997,8841,203,643205,75921% Employment 529,267737,364208,09739% VMT21,952,93226,795,1764,842,24422% Lane Miles*2,5922,7211295% Lane Miles of Congestion37663926370% Note: Modeled lane miles include freeways, arterials, and many collectors, but few local roads

4
Existing Daily Bus Ridership Based on data rec’d from ITDP

5
Transportation Modeling Median busways were treated in the model the same as Light Rail Transit to determine maximum desirable network. Curb bus lanes would be accomplished via lane-repurposing, converting either existing or planned travel lanes. Four scenarios were considered: no-build build as all median busway BRT (Build 1) build as mostly median busway BRT with some lane-repurposing (Build 2) smaller network with a mix of treatments (Build 2A)
 build as mostly median busway BRT with some lane-repurposing (Build 2) smaller network with a mix of treatments (Build 2A).")
6
2040 Forecast Weekday Ridership for Regional Transit Services by Scenario TypeNo BuildBuild 1ABuild 2Build 2A Mont Co BRT (incl. CCT) 39k283k276k184k All Other Bus Services 861k789k 809k WMATA Metrorail 1.576m1.553m1.554m1.562m MARC Commuter Rail (not incl. 3 rd track) 42k41k Purple Line 77k70k 72k Total 2.595m2.735m2.730m2.668m Growth140k134k73k % Growth 5.4%5.2%2.8%
 39k283k276k184k All Other Bus Services 861k789k 809k WMATA Metrorail 1.576m1.553m1.554m1.562m MARC Commuter Rail (not incl. 3 rd track) 42k41k Purple Line 77k70k 72k Total 2.595m2.735m2.730m2.668m Growth140k134k73k % Growth 5.4%5.2%2.8%.")
7
2040 Forecast Daily BRT Ridership #CorridorBuild 1Build 2Build 2A 10BMD 355 South49k46k44k 10AMD 355 North34k32k22k 3Veirs Mill Rd-University Blvd27k 18k 4Georgia Avenue24k 12k 11New Hampshire Avenue22k21k10k 19US 2918k16k 14Randolph Road16k 11k 5Rockville-LSC14k 7k 12BOld Georgetown Road South11k 12AOld Georgetown Road North8k 7Muddy Branch Road8k 8Connecticut Avenue6k7k 20ICC6k 15Norbeck Road6k5k 21North Bethesda Transitway4k 10k 24University Blvd-Grosvenor2k Total254k247k150k Note: Corridors without ridership results were not included in the Build 2A scenario

8
Determining BRT Treatment Standard thresholds per the Transit Capacity and Quality of Service Manual (TCQSM) Median Busway: 2,400 people in the peak hour in the peak direction (pphpd) Curb Bus Lanes: 1,200 pphpd MNCPPC-modified thresholds for Montgomery County Median Busway: 1,600 pphpd Curb Bus Lanes: 1,000 pphpd
 Median Busway: 2,400 people in the peak hour in the peak direction (pphpd) Curb Bus Lanes: 1,200 pphpd MNCPPC-modified thresholds for Montgomery County Median Busway: 1,600 pphpd Curb Bus Lanes: 1,000 pphpd")
9
Modified Treatment Thresholds Median busway warranted on MD355 and MD650.

10
Modified Treatment Thresholds Median busway warranted on MD355.

11
Modified Treatment Thresholds Median busway warranted on MD355.

12
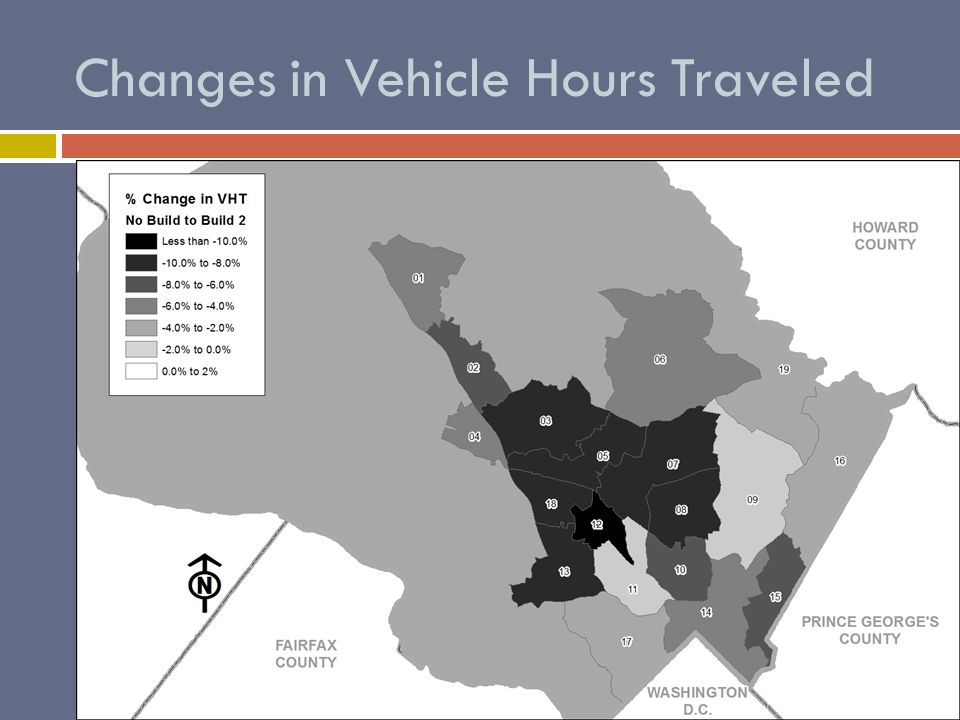
Changes in Vehicle Hours Traveled

15
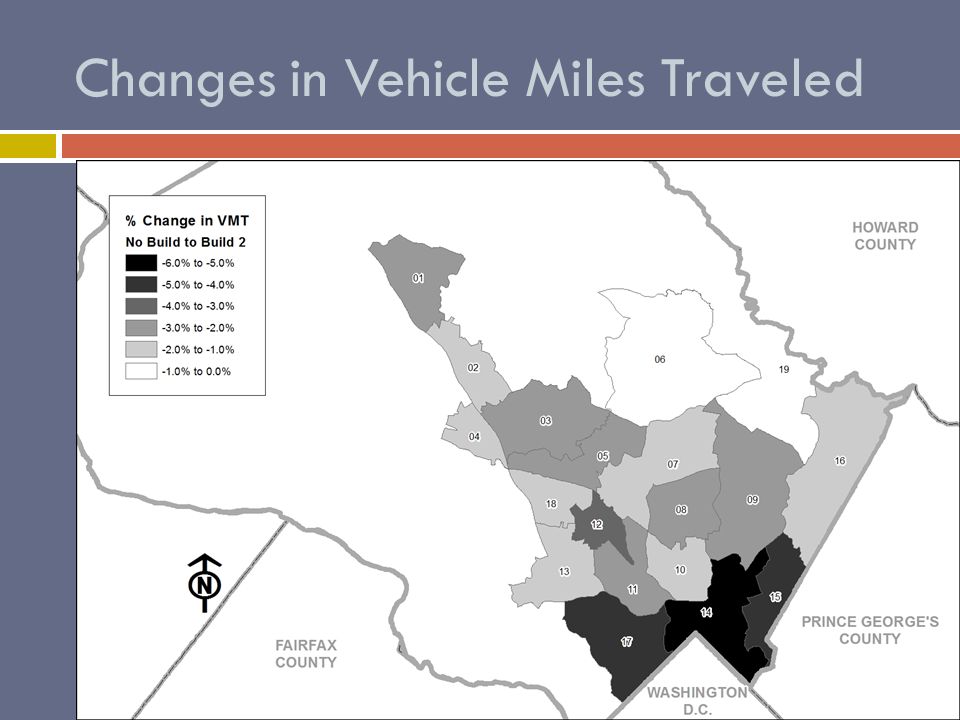
Changes in Vehicle Miles Traveled

18
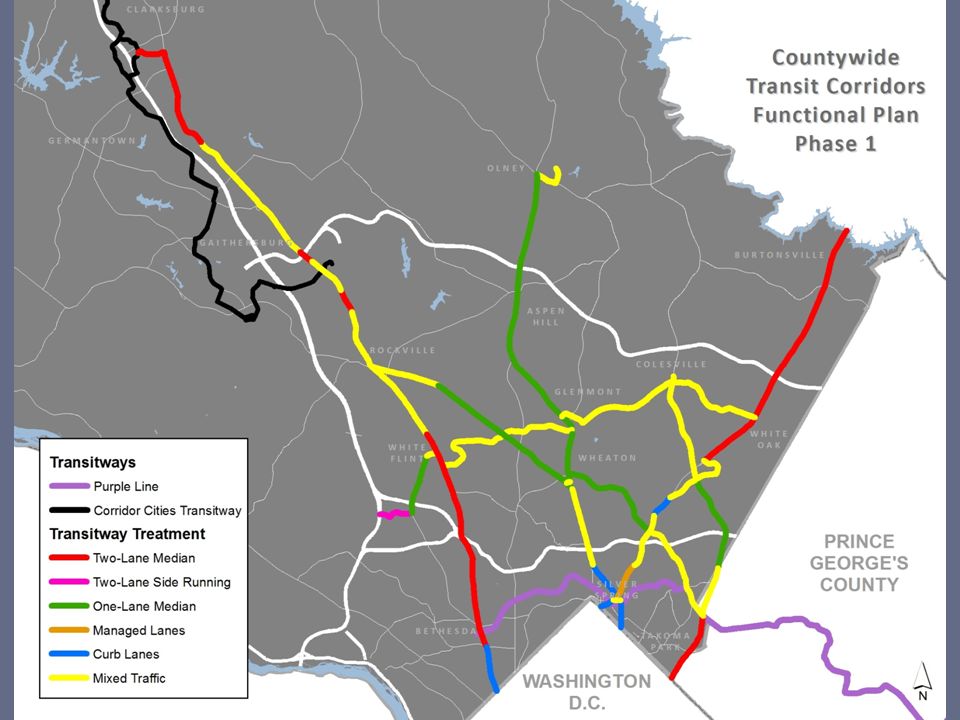
Recommended BRT Network (Phase 1) TreatmentBuild 1Build 2Build 2A Staff Draft Two Lane Median1521402919 Two Lane Side Busway1 One Lane Median20 Curb Lanes 12414 Managed Lanes1 Mixed Traffic 1734 Total152 8779
 TreatmentBuild 1Build 2Build 2A Staff Draft Two Lane Median Two Lane Side Busway1 One Lane Median20 Curb Lanes Managed Lanes1 Mixed Traffic 1734 Total")
21
Recommended BRT Network (Phase 2) TreatmentBuild 1Build 2Build 2ARecommended Two Lane Median1521402931 Two Lane Side Busway1 One Lane Median31 Curb Lanes 12415 Managed Lanes1 Mixed Traffic 1710 Total152 8779
 TreatmentBuild 1Build 2Build 2ARecommended Two Lane Median Two Lane Side Busway1 One Lane Median31 Curb Lanes Managed Lanes1 Mixed Traffic 1710 Total")
23
COUNTYWIDE TRANSIT CORRIDORS FUNCTIONAL MASTER PLAN Coalition for Smarter Growth Presentation on Staff Recommendations for Bus Rapid Transit Silver Spring Civic Building February 13, 2013

25
Bicycle Pedestrian Priority Areas Takoma-Langley Crossroads* Takoma Park Kensington Veirs Mill/Randolph NIH-Navy Forest Glen Metro Piney Branch/University Four Corners Aspen Hill Silver Spring CBD West *recommended in PB Sector Plan Draft Colesville Montgomery Mall

26
MARC Brunswick Line Expansion Our preliminary recommendation is that the segment between the Frederick County line and Metropolitan Grove be included in the Functional Plan.

27
Build 1 Traffic Impacts (AM)
")
28
Build 1 Traffic Impacts (PM)
")
29
Three scenarios were considered: no-build build as all median busway BRT build as mostly median busway BRT with some lane-repurposing Final model run will include the actual recommended treatment. Overview of Modeling Effort Districts created across Montgomery County and the region to summarize transportation impacts

30
No-Build High levels of congestion Lack of capacity to accommodate growth Build additional lanes for transit Capacity to accommodate growth Good improvement in traffic conditions High cost Repurpose existing travel lanes for transit Capacity to accommodate growth Some improvement in traffic conditions Lowest cost in dollars, environmental and community impacts Choices for our Transportation Future

31
VMT Change% Speed Change DistrictNB – B1NB – B2NB – B1NB – B2 1 -5,383-6,1903.04%2.64% 2 -4,665-4,1905.68%4.99% 3 -10,951-9,5857.43%6.91% 4 -7,001-5,7505.58%4.50% 5 -6,626-5,9687.70%6.62% 6 -5,402-3,6553.97%3.76% 7 -10,718-8,9189.36%8.65% 8 -5,814-5,4829.11%7.79% 9 -8,806-10,4628.37%10.56% 10 -8,344-7,9046.84%5.82% 11 -8,341-9,6297.60%9.58% 12 -6,524-6,4348.12%8.35% 13 -6,867-6,4317.08%7.13% 14 -12,544-45,2335.05%-0.46% 15 -5,812-17,1036.06%1.73% 16 -4,995-6,2262.08%2.73% 17 -9,804-24,0024.37%-1.49% 18 -6,261-5,7638.70%7.33% 19 -59,063-41,5793.16%1.85% Total -193,921-230,5045.20%3.77%

32
Accommodates growth Construction cost Alternative to congested roads Community impacts No-BuildNoNoneNoNone Construct new pavement YesHigherYesHigher Repurpose existing lanes YesLowerYesLower Choices for our Transportation Future

33
VMT Change% Speed Change DistrictNB – B1NB – B2NB – B1NB – B2 Total -193,921-230,5045.20%3.77%

Similar presentations


 Service Planning and System Integration Study Steering Committee Meeting Presented to Montgomery County Department.>")


