Download presentation
Presentation is loading. Please wait.

1
LIFESTYLE INTERVENTION You CAN’T change where you came from…….. You CAN change where you are going……

2
Normal Coronary Arteries

3
Mild Coronary Artery Disease

4
Severe Coronary Artery Disease

6
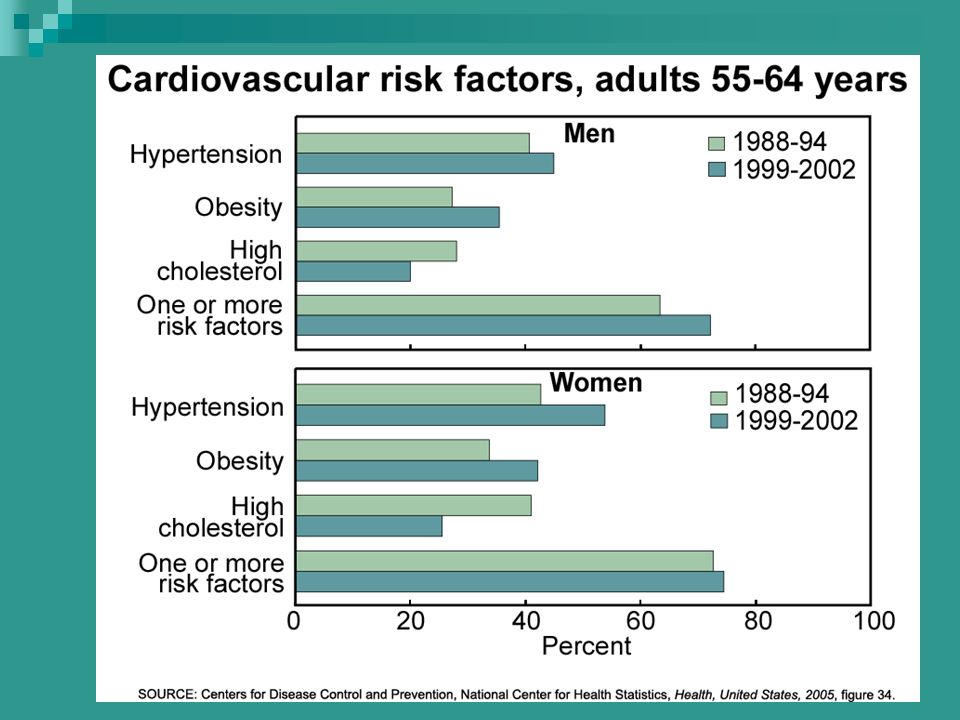
Traditional Risk Factors Smoking Lipids (Cholesterol levels) High Blood Pressure Stress Diabetes Age Sex Family history of premature coronary artery disease OVERWEIGHT SEDENTARY
 High Blood Pressure Stress Diabetes Age Sex Family history of premature coronary artery disease OVERWEIGHT SEDENTARY")
9
Obesity Trends* Among U.S. Adults BRFSS, 1991 No Data <10% 10%–14% 15%–19% (*BMI ≥30, or ~ 30 lbs overweight for 5’ 4” person)
.")
10
Obesity Trends* Among U.S. Adults BRFSS, 1993 No Data <10% 10%–14% 15 %–19 % (*BMI ≥30, or ~ 30 lbs overweight for 5’ 4” person)
.")
11
Obesity Trends* Among U.S. Adults BRFSS, 1994 No Data <10% 10%–14% 15%–19% (*BMI ≥30, or ~ 30 lbs overweight for 5’ 4” person)
.")
12
Obesity Trends* Among U.S. Adults BRFSS, 1995 No Data <10% 10%–14% 15%–19% (*BMI ≥30, or ~ 30 lbs overweight for 5’ 4” person)
.")
13
Obesity Trends* Among U.S. Adults BRFSS, 1996 No Data <10% 10%–14% 15%–19% (*BMI ≥30, or ~ 30 lbs overweight for 5’ 4” person)
.")
14
Obesity Trends* Among U.S. Adults BRFSS, 1997 No Data <10% 10%–14% 15%–19% ≥20 (*BMI ≥30, or ~ 30 lbs overweight for 5’ 4” person)
.")
15
Obesity Trends* Among U.S. Adults BRFSS, 1998 No Data <10% 10%–14% 15%–19% ≥20 (*BMI ≥30, or ~ 30 lbs overweight for 5’ 4” person)
.")
16
Obesity Trends* Among U.S. Adults BRFSS, 1999 No Data <10% 10%–14% 15%–19% ≥20 (*BMI ≥30, or ~ 30 lbs overweight for 5’ 4” person)
.")
17
Obesity Trends* Among U.S. Adults BRFSS, 2000 No Data <10% 10%–14% 15%–19 ≥20 (*BMI ≥30, or ~ 30 lbs overweight for 5’ 4” person)
.")
18
Obesity Trends* Among U.S. Adults BRFSS, 2001 No Data <10% 10%–14 15%–19% 20%–24% ≥25% (*BMI ≥30, or ~ 30 lbs overweight for 5’ 4” person)
.")
19
(*BMI 30, or ~ 30 lbs overweight for 5’4” person) No Data <10% 10%–14% 15%–19% 20%–24% ≥25% (*BMI ≥30, or ~ 30 lbs overweight for 5’ 4” person) Obesity Trends* Among U.S. Adults BRFSS, 2002

20
Obesity Trends* Among U.S. Adults BRFSS, 2003 (*BMI ≥30, or ~ 30 lbs overweight for 5’ 4” person) No Data <10% 10%–14% 15%–19% 20%–24% ≥25%
 No Data <10% 10%–14% 15%–19% 20%–24% ≥25%.")
21
Obesity Trends* Among U.S. Adults BRFSS, 2004 No Data <10% 10%–14% 15%–19% 20%–24% ≥25% (*BMI ≥30, or ~ 30 lbs overweight for 5’ 4” person)
.")
22
Obesity Trends* Among U.S. Adults BRFSS, 2005 (*BMI ≥30, or ~ 30 lbs overweight for 5’ 4” person) No Data <10% 10%–14% 15%–19% 20%–24% 25%–29% ≥30% ONLY 3 STATES NOW HAVE < 10% RATES
 No Data <10% 10%–14% 15%–19% 20%–24% 25%–29% ≥30% ONLY 3 STATES NOW HAVE < 10% RATES.")
26
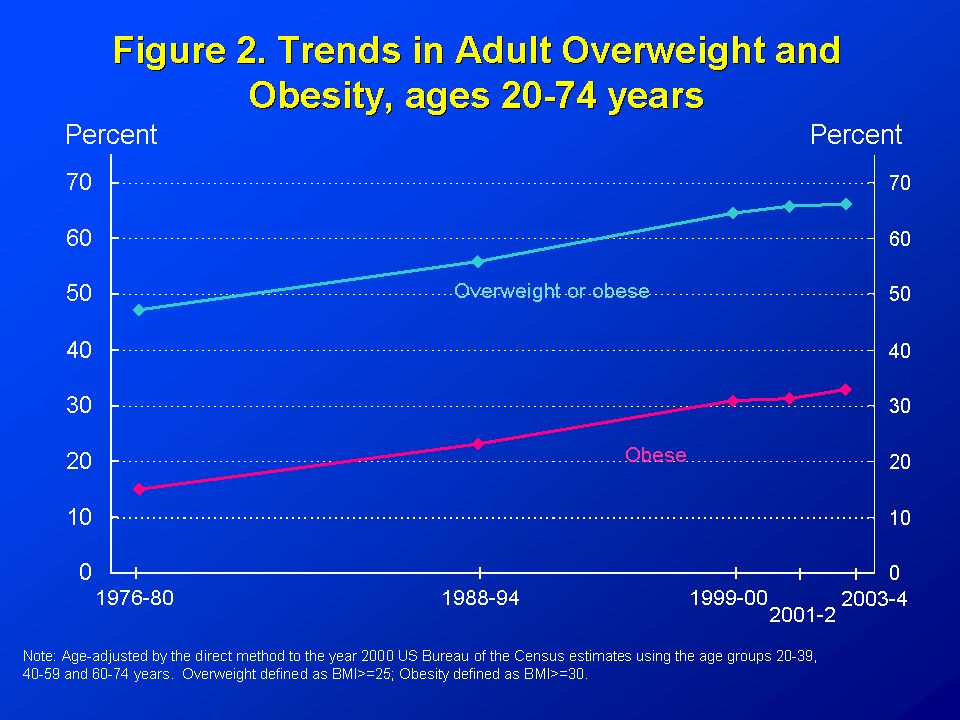
Facts re Obesity and Overweight 67% US adults are overweight 34% US adults are obese 17-19% US children are overweight These rates are continuing to increase Overweight is associated with multiple health problems ( diabetes, heart disease, high BP, some cancers) Obesity has become the second leading cause of preventable death in US >$100 BILLION spent annually for related health issues
 Obesity has become the second leading cause of preventable death in US >$100 BILLION spent annually for related health issues")
27
Environmental cost of this excess baggage…… 1960: average woman weighed 140 lbs 2006: average woman weighs 164 lbs Extra gallons CAR fuel per year due to weight gain since 1960 938 million gals. @ cost $ 2.2 billion Extra gallons AIRLINE fuel per year due to weight gain since 1990’s 350 million gals.@ cost $275 million CDC and University of Illinois

28
Central Obesity Excess belly fat is a risk factor independently of total fat, total weight, Due to excess calories, inactivity, alcohol, smoking, increased levels of the stress hormone, Cortisol Associated with significant increases in heart disease and diabetes Visceral (deep) more harmful than subcutaneous fat (pinch-able) RX: aerobic exercise, healthy diet, appropriate portion sizes
 more harmful than subcutaneous fat (pinch-able) RX: aerobic exercise, healthy diet, appropriate portion sizes")
29
Waist Circumference Measurement Simplest measurement of abdominal fat More accurate indicator of health risk than BMI Women *< 35 in Men < 40 in Measure at the top of the hip bone or 1cm below navel a waist circumference increase of 2” is significant for increased health risk even if weight doesn’t change *Variable by ethnicity; i.e Asian women > 31.5 in are at increased health risk

30
Determining Ideal Body Weight Weight at age 18-21 years old BMI < 25 Body fat percentage (ideal for women 16-25%, 10-20% for men) Women : 100 lbs for first 5 ft in height 5 lbs for each additional inch Men: 106 lbs for first 5 ft in height 6 lbs for each additional inch subtract 10% for small body frame add 10 % for large body frame
 Women : 100 lbs for first 5 ft in height 5 lbs for each additional inch Men: 106 lbs for first 5 ft in height 6 lbs for each additional inch subtract 10% for small body frame add 10 % for large body frame")
32
Weight Loss Guidelines Initial goal is 10% loss in 6 months Decrease calories by 300-500 per day Aim for 1-2 lb loss per week Do not eat anything after 7 pm !!!!! Exercise daily with goal to burn 300 calories ( i.e. 3 mile walk) Regular exercise is strongest predictor of successful weight maintenance
 Regular exercise is strongest predictor of successful weight maintenance.")
33
Calories.. they all count! Healthy foods have calories Essential to balance calorie intake with calorie expenditure 3500 calories = 1 lb body weight, (walking 1 mile burns 100 cals) 1200-1800 cals per day adequate for most women PORTION CONTROL
 cals per day adequate for most women PORTION CONTROL.")
34
The Food Pyramid

36
Risk Reduction r/t Weight Loss* Hypertension down 70-75% Type 2 diabetes down 40-60% Cardiovascular disease down 24-50% Gastrointestinal disease down 25% Sleep disorders down 25% * defined as obese adults losing 10% body weight each year for 3 years

37
Sedentary Lifestyles Well documented that physical activity decreases rates of illness and death Currently 23% deaths from major chronic illness are linked to sedentary lifestyles Only 30% adults are moderately active Only 14% get recommended vigorous activity $$$ Regular moderate physical activity among 88 million inactive Americans over the next 15 yrs would reduce annual direct medical expenses by $76 million CDC Healthy People 2000

40
Benefits of Regular Exercise Lowers risk of coronary artery disease by up to 35% Promotes weight loss/maintenance Improves cholesterol levels Improves glucose metabolism/insulin sensitivity Lowers blood pressure Decreases depression, anxiety, stress Helps prevent osteoporosis Reduces dementia

41
How Much? 30-60 minutes How Often ? 5-7 days/week How Hard? Moderate to vigorous ( a level that feels “somewhat hard to you” ) EXERCISE RX !!!
 EXERCISE RX !!!.")
42
Exercise Start gradually Do what you can comfortably manage and sustain Anything is better is nothing Get as close to the recommended daily dose as possible Include strengthening 3 x week

43
PEDOMETERS 10,000 STEPS A DAY

44
BENEFITS OF TREKKING POLES INCREASES EXERCISE INTENSITY AND CALORIE BURN BY 20-50% USES SEVERAL MORE UPPER BODY MUSCLES DECREASES IMPACT ON KNEES INCREASES STABILITY AND DECEASES INJURY

45
CHOOSE YOUR WEAPON !!!!! D and enjoy !!!

46
YOU DON’T HAVE TO EXERCISE EVERY DAY…….. ONLY ON THE DAYS YOU EAT……

47
The victory is not always to the swift, but to those who keep moving anonymous

Similar presentations