Download presentation
Presentation is loading. Please wait.

1
Socioeconomic Determinants of Body Mass Index of Adult Chinese in the 1990s Zhehui Luo, Ph.D. MS Department of Epidemiology Michigan State University

2
Outline Simple Model Simple Model Data and Econometric Issues Data and Econometric Issues Trends and Descriptives Trends and Descriptives Results of Reduced Form Demand Results of Reduced Form Demand Results of Dynamic Demand Results of Dynamic Demand Results of Production Function Results of Production Function

3
The Model s. t.

4
The Model

5
If total time available for leisure and work is not affected by health status If total time available for leisure and work is not affected by health status Labor is the same as the effective labor in Grossman’s sense Labor is the same as the effective labor in Grossman’s sense Equilibrium condition is: Equilibrium condition is:

6
Estimating Equations

7
The Data Chinese Health and Nutrition Survey (CHNS) 1989, 1991, 1993 and 1997 Chinese Health and Nutrition Survey (CHNS) 1989, 1991, 1993 and 1997 Carolina Population Center at the University of North Carolina, Institute of Nutrition and Food Hygiene, Chinese Academy of Preventive Medicine Carolina Population Center at the University of North Carolina, Institute of Nutrition and Food Hygiene, Chinese Academy of Preventive Medicine Sampling: multistage, random cluster process Sampling: multistage, random cluster process
 1989, 1991, 1993 and 1997 Chinese Health and Nutrition Survey (CHNS) 1989, 1991, 1993 and 1997 Carolina Population Center at the University of North Carolina, Institute of Nutrition and Food Hygiene, Chinese Academy of Preventive Medicine Carolina Population Center at the University of North Carolina, Institute of Nutrition and Food Hygiene, Chinese Academy of Preventive Medicine Sampling: multistage, random cluster process Sampling: multistage, random cluster process")
9
The Data Adults aged 20 and above Adults aged 20 and above Excluding pregnant women Excluding pregnant women Sample size: Sample size: 1989: 4550 persons, 2736 households 1991: 7356 persons, 3402 HH 1993: 6926 persons, 3164 HH 1997: 7580 persons, 3512 HH

10
Sample Selection Study Sample OutsideP-value Age40.935.90.000 % Male 48.352.00.000 Education6.57.00.000 % Urban 32.632.50.922 Real PCINC 121011930.437 Real Assets 534954670.562

11
The Data BMI: Weight (kg)/ height (m 2 ) BMI: Weight (kg)/ height (m 2 ) Classification BMI Range Health Risk Underweight<18.5Increased Normal18.5~<25Least Overweight25~<30Increased Obese Class I Class I Class II Class II Class III Class III30~<3535~<40>=40High Very High Highest
/ height (m 2 ) BMI: Weight (kg)/ height (m 2 ) Classification BMI Range Health Risk Underweight<18.5Increased Normal18.5~<25Least Overweight25~<30Increased Obese Class I Class I Class II Class II Class III Class III30~<3535~<40>=40High Very High Highest")
12
The Data Calorie, fat, protein intakes and percent of Calories from fat, protein and carbohydrates Calorie, fat, protein intakes and percent of Calories from fat, protein and carbohydrates The 1991 China Food Composition Table The 1991 China Food Composition Table 1 gram fat = 9 Kcal energy 1 gram fat = 9 Kcal energy 1 gram protein = 4 Kcal energy 1 gram carbohydrates=4 Kcal energy

13
Economic Development in 1989 ~ 1997 1989199119931997 Real PC Income 6776598231039 Prod Assets 243266425636 Years of Education 7.326.016.046.58 % Employed 96828077 % HH water factory 34414249 Mean BMI, Women 21.722.122.122.6 Mean BMI, Men 21.221.621.922.3

14
Trends in Food Availability Source: FAO 2002 Food Balance Sheet for China

15
Trends in overweight and obesity % Men and Women overweight (BMI 25) % Men and Women obese (BMI 30)
 % Men and Women obese (BMI 30)")
16
Trends in overweight % Men overweight by age groups % Women overweight by age groups

17
Trends in overweight % Men overweight by rural-urban residence % Women overweight by rural-urban residence

18
Trends in overweight % Men overweight by education levels % Women overweight by education levels

19
BMI Distribution: Men Russel Davidson and Jean-Yves Duclos (2000), performed with DAD 4.3
, performed with DAD 4.3")
20
BMI Distribution: Women Russel Davidson and Jean-Yves Duclos (2000), performed with DAD 4.3
, performed with DAD 4.3")
21
Estimating Equation The linear representation: Baltagi and Wu (1999)
")
22
Estimating Equation Econometric Issues Econometric Issues Measurement Errors Measurement Errors Functional form: nonlinearity of effects Functional form: nonlinearity of effects Age, cohort and period effects Age, cohort and period effects

23
Age, Period and Cohort Analysis To identify: To identify: Origin-related process – cohort effect dominant Origin-related process – cohort effect dominant Aging process Aging process Instantaneous process – function of time Instantaneous process – function of time Linear dependency: Linear dependency: Deaton (1997), Holford (1983) Deaton (1997), Holford (1983)
, Holford (1983) Deaton (1997), Holford (1983)")
24
Age, Period and Cohort Analysis Spacing of the data determines the number of extra constraints (n) needed Spacing of the data determines the number of extra constraints (n) needed CHNS 1989, 1991, 1993, 1997: n=2 CHNS 1989, 1991, 1993, 1997: n=2 If arbitrarily impose two constraints: If arbitrarily impose two constraints:
 needed Spacing of the data determines the number of extra constraints (n) needed CHNS 1989, 1991, 1993, 1997: n=2 CHNS 1989, 1991, 1993, 1997: n=2 If arbitrarily impose two constraints: If arbitrarily impose two constraints:")
25
Age, Period and Cohort Analysis Meaningful constraints: Meaningful constraints: Source: State Statistical Bureau (1992): 1990 Population Census of China.
: 1990 Population Census of China.")
26
Age, Period and Cohort Analysis Results from age dummies, five-year cohort dummies and year dummies: Results from age dummies, five-year cohort dummies and year dummies:

27
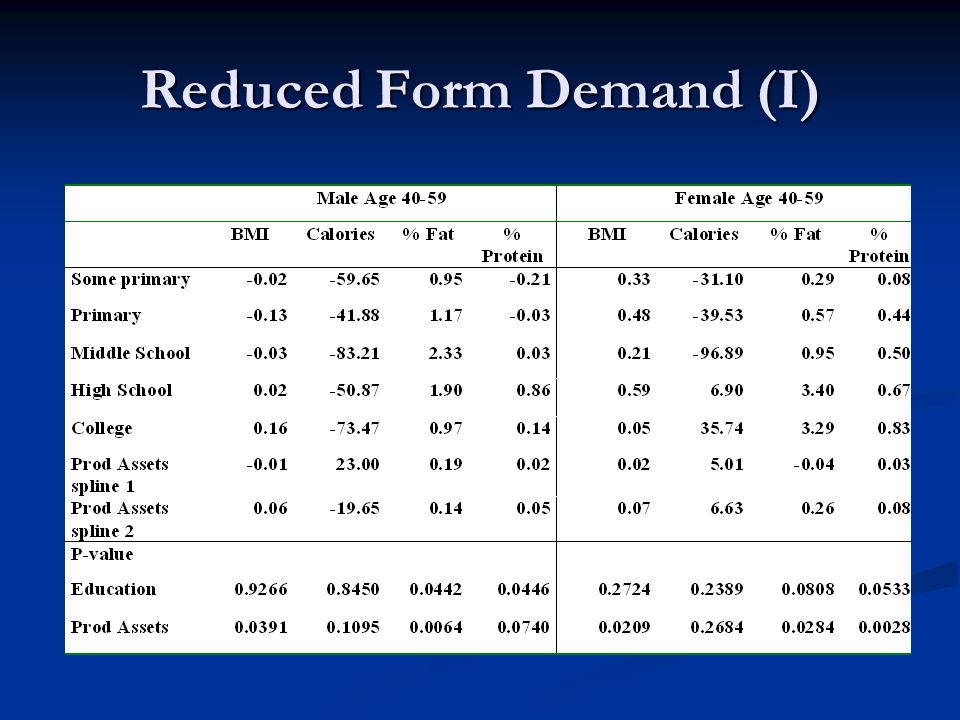
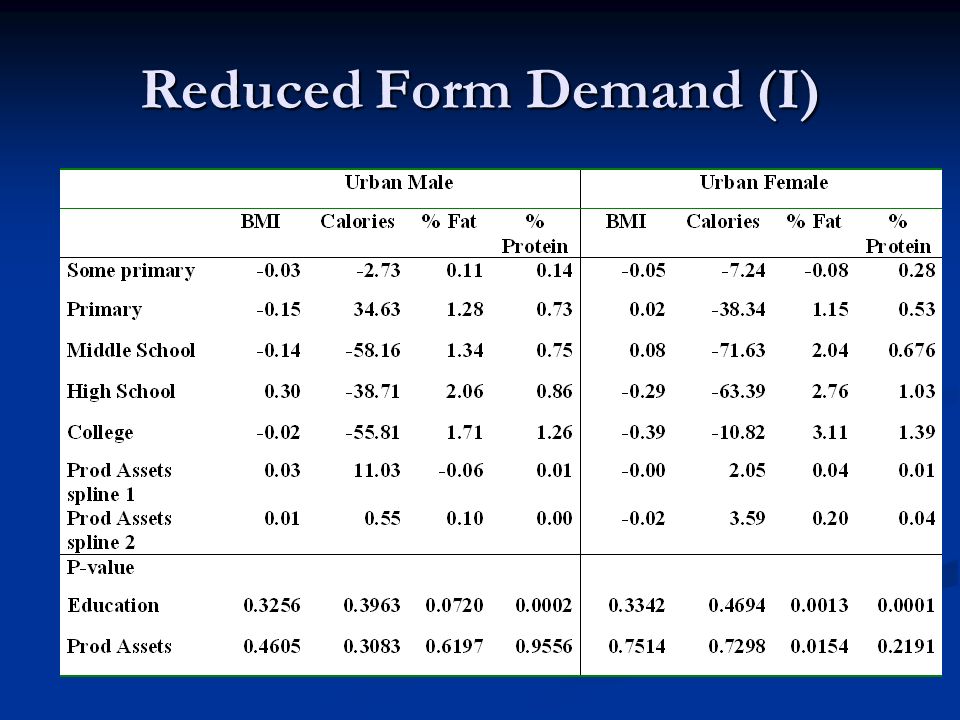
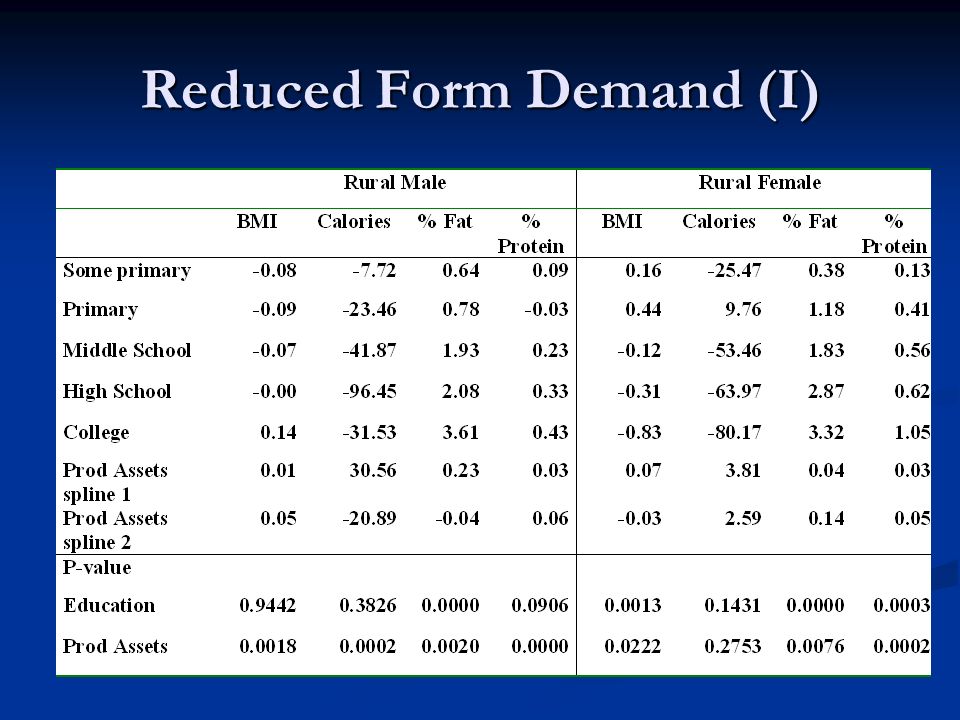
Reduced Form Demand (I)
")
33
Probability Model for Overweight

34
Reduced Form Demand (I) Results from the basic model: Results from the basic model: Education effect on female BMI inversely U-shaped Education effect on female BMI inversely U-shaped % Calories from fat and protein increase with education % Calories from fat and protein increase with education Male BMI increases with productive assets, female inversely U-shaped Male BMI increases with productive assets, female inversely U-shaped % Calories from fat and protein increase with assets, except for urban men – U-shaped % Calories from fat and protein increase with assets, except for urban men – U-shaped
 Results from the basic model: Results from the basic model: Education effect on female BMI inversely U-shaped Education effect on female BMI inversely U-shaped % Calories from fat and protein increase with education % Calories from fat and protein increase with education Male BMI increases with productive assets, female inversely U-shaped Male BMI increases with productive assets, female inversely U-shaped % Calories from fat and protein increase with assets, except for urban men – U-shaped % Calories from fat and protein increase with assets, except for urban men – U-shaped")
35
Reduced Form Demand (II)
")
36
Results from the augmented model: Results from the augmented model: Prices significant without controlling community dummies in BMI regressions Prices significant without controlling community dummies in BMI regressions Negative price elasticity of rice, eggs for calories, fat and protein; positive price elasticity of pork Negative price elasticity of rice, eggs for calories, fat and protein; positive price elasticity of pork Better water source – fat, protein intakes and male BMI: positive Better water source – fat, protein intakes and male BMI: positive More excreta – calories and protein: negative More excreta – calories and protein: negative

37
Dynamic BMI Demand Estimating Equation: Estimating Equation: Instruments: previous years HH resources, community characteristics Instruments: previous years HH resources, community characteristics Results: Results: In short terms lagged BMI is good summary measure of health status In short terms lagged BMI is good summary measure of health status Age effect for women still strong, aging factor Age effect for women still strong, aging factor

38
Dynamic BMI Demand

39
BMI Production Function Estimating equation: Estimating equation: Instruments: previous years HH resources, community characteristics Instruments: previous years HH resources, community characteristics Results: Results: In a short period, BMI – a random walk process In a short period, BMI – a random walk process Heavy physical activities negative in OLS and positive in IV Heavy physical activities negative in OLS and positive in IV Food intakes not significant Food intakes not significant

40
BMI Production Function

41
Limitations and Future research Measurement: productive assets, fat intake Measurement: productive assets, fat intake Uncertainty Uncertainty Attrition Attrition Health and Labor Market Participation Health and Labor Market Participation Intra-household allocation and Health Intra-household allocation and Health

Similar presentations


 and understand its scope and effects Share who some of the.>")
, or Quetelet index, is a measure for human body shape based on an individual's weight and height.>")


>")
 ◦ Amount of ____________ needed to __________ the temperature of 1 _________ of pure water by 1C ______ calories =>")


 624-5006 NEARLY HALF OF ALL MASSACHUSETTS RESIDENTS OVERWEIGHT.>")


