Download presentation
Presentation is loading. Please wait.

1
Exercise and Diet for Weight Control

4
Obesity Trends Among U.S. Adults between 1985 and 2006 Source of the data: Source of the data: The data shown in these maps were collected through CDC’s Behavioral Risk Factor Surveillance System (BRFSS). Each year, state health departments use standard procedures to collect data through a series of monthly telephone interviews with U.S. adults. The data shown in these maps were collected through CDC’s Behavioral Risk Factor Surveillance System (BRFSS). Each year, state health departments use standard procedures to collect data through a series of monthly telephone interviews with U.S. adults. Prevalence estimates generated for the maps may vary slightly from those generated for the states by BRFSS (http://aps.nccd.cdc.gov/brfss) as slightly different analytic methods are used. Prevalence estimates generated for the maps may vary slightly from those generated for the states by BRFSS (http://aps.nccd.cdc.gov/brfss) as slightly different analytic methods are used. Source of the data: Source of the data: The data shown in these maps were collected through CDC’s Behavioral Risk Factor Surveillance System (BRFSS). Each year, state health departments use standard procedures to collect data through a series of monthly telephone interviews with U.S. adults. The data shown in these maps were collected through CDC’s Behavioral Risk Factor Surveillance System (BRFSS). Each year, state health departments use standard procedures to collect data through a series of monthly telephone interviews with U.S. adults. Prevalence estimates generated for the maps may vary slightly from those generated for the states by BRFSS (http://aps.nccd.cdc.gov/brfss) as slightly different analytic methods are used. Prevalence estimates generated for the maps may vary slightly from those generated for the states by BRFSS (http://aps.nccd.cdc.gov/brfss) as slightly different analytic methods are used.
. Each year, state health departments use standard procedures to collect data through a series of monthly telephone interviews with U.S. adults. The data shown in these maps were collected through CDC’s Behavioral Risk Factor Surveillance System (BRFSS). Each year, state health departments use standard procedures to collect data through a series of monthly telephone interviews with U.S. adults. Prevalence estimates generated for the maps may vary slightly from those generated for the states by BRFSS ( as slightly different analytic methods are used. Prevalence estimates generated for the maps may vary slightly from those generated for the states by BRFSS ( as slightly different analytic methods are used. Source of the data: Source of the data: The data shown in these maps were collected through CDC’s Behavioral Risk Factor Surveillance System (BRFSS). Each year, state health departments use standard procedures to collect data through a series of monthly telephone interviews with U.S. adults. The data shown in these maps were collected through CDC’s Behavioral Risk Factor Surveillance System (BRFSS). Each year, state health departments use standard procedures to collect data through a series of monthly telephone interviews with U.S. adults. Prevalence estimates generated for the maps may vary slightly from those generated for the states by BRFSS ( as slightly different analytic methods are used. Prevalence estimates generated for the maps may vary slightly from those generated for the states by BRFSS ( as slightly different analytic methods are used..")
5
In 1990, among states participating in the Behavioral Risk Factor Surveillance System, 10 states had a prevalence of obesity less than 10% and no states had prevalence equal to or greater than 15%. In 1990, among states participating in the Behavioral Risk Factor Surveillance System, 10 states had a prevalence of obesity less than 10% and no states had prevalence equal to or greater than 15%. By 1998, no state had prevalence less than 10%, seven states had a prevalence of obesity between 20-24%, and no state had prevalence equal to or greater than 25%. By 1998, no state had prevalence less than 10%, seven states had a prevalence of obesity between 20-24%, and no state had prevalence equal to or greater than 25%. In 2006, only four states had a prevalence of obesity less than 20%. Twenty-two states had a prevalence equal or greater than 25%; Two of these states (Mississippi and West Virginia) had a prevalence of obesity equal to or greater than 30%. In 2006, only four states had a prevalence of obesity less than 20%. Twenty-two states had a prevalence equal or greater than 25%; Two of these states (Mississippi and West Virginia) had a prevalence of obesity equal to or greater than 30%. In 1990, among states participating in the Behavioral Risk Factor Surveillance System, 10 states had a prevalence of obesity less than 10% and no states had prevalence equal to or greater than 15%. In 1990, among states participating in the Behavioral Risk Factor Surveillance System, 10 states had a prevalence of obesity less than 10% and no states had prevalence equal to or greater than 15%. By 1998, no state had prevalence less than 10%, seven states had a prevalence of obesity between 20-24%, and no state had prevalence equal to or greater than 25%. By 1998, no state had prevalence less than 10%, seven states had a prevalence of obesity between 20-24%, and no state had prevalence equal to or greater than 25%. In 2006, only four states had a prevalence of obesity less than 20%. Twenty-two states had a prevalence equal or greater than 25%; Two of these states (Mississippi and West Virginia) had a prevalence of obesity equal to or greater than 30%. In 2006, only four states had a prevalence of obesity less than 20%. Twenty-two states had a prevalence equal or greater than 25%; Two of these states (Mississippi and West Virginia) had a prevalence of obesity equal to or greater than 30%.
 had a prevalence of obesity equal to or greater than 30%. In 2006, only four states had a prevalence of obesity less than 20%. Twenty-two states had a prevalence equal or greater than 25%; Two of these states (Mississippi and West Virginia) had a prevalence of obesity equal to or greater than 30%. In 1990, among states participating in the Behavioral Risk Factor Surveillance System, 10 states had a prevalence of obesity less than 10% and no states had prevalence equal to or greater than 15%. In 1990, among states participating in the Behavioral Risk Factor Surveillance System, 10 states had a prevalence of obesity less than 10% and no states had prevalence equal to or greater than 15%. By 1998, no state had prevalence less than 10%, seven states had a prevalence of obesity between 20-24%, and no state had prevalence equal to or greater than 25%. By 1998, no state had prevalence less than 10%, seven states had a prevalence of obesity between 20-24%, and no state had prevalence equal to or greater than 25%. In 2006, only four states had a prevalence of obesity less than 20%. Twenty-two states had a prevalence equal or greater than 25%; Two of these states (Mississippi and West Virginia) had a prevalence of obesity equal to or greater than 30%. In 2006, only four states had a prevalence of obesity less than 20%. Twenty-two states had a prevalence equal or greater than 25%; Two of these states (Mississippi and West Virginia) had a prevalence of obesity equal to or greater than 30%..")
6
Obesity Trends* Among U.S. Adults BRFSS, 1988 (*BMI ≥30, or ~ 30 lbs. overweight for 5’ 4” person) No Data <10% 10%–14%
 No Data <10% 10%–14%.")
7
Obesity Trends* Among U.S. Adults BRFSS, 1989 (*BMI ≥30, or ~ 30 lbs. overweight for 5’ 4” person) No Data <10% 10%–14%
 No Data <10% 10%–14%.")
8
Obesity Trends* Among U.S. Adults BRFSS, 1990 (*BMI ≥30, or ~ 30 lbs. overweight for 5’ 4” person) No Data <10% 10%–14%
 No Data <10% 10%–14%.")
9
Obesity Trends* Among U.S. Adults BRFSS, 1991 (*BMI ≥30, or ~ 30 lbs. overweight for 5’ 4” person) No Data <10% 10%–14% 15%–19%
 No Data <10% 10%–14% 15%–19%.")
10
Obesity Trends* Among U.S. Adults BRFSS, 1992 (*BMI ≥30, or ~ 30 lbs. overweight for 5’ 4” person) No Data <10% 10%–14% 15%–19%
 No Data <10% 10%–14% 15%–19%.")
11
Obesity Trends* Among U.S. Adults BRFSS, 1993 (*BMI ≥30, or ~ 30 lbs. overweight for 5’ 4” person) No Data <10% 10%–14% 15%–19%
 No Data <10% 10%–14% 15%–19%.")
12
Obesity Trends* Among U.S. Adults BRFSS, 1994 (*BMI ≥30, or ~ 30 lbs. overweight for 5’ 4” person) No Data <10% 10%–14% 15%–19%
 No Data <10% 10%–14% 15%–19%.")
13
Obesity Trends* Among U.S. Adults BRFSS, 1995 (*BMI ≥30, or ~ 30 lbs. overweight for 5’ 4” person) No Data <10% 10%–14% 15%–19%
 No Data <10% 10%–14% 15%–19%.")
14
Obesity Trends* Among U.S. Adults BRFSS, 1996 (*BMI ≥30, or ~ 30 lbs. overweight for 5’ 4” person) No Data <10% 10%–14% 15%–19%
 No Data <10% 10%–14% 15%–19%.")
15
Obesity Trends* Among U.S. Adults BRFSS, 1997 (*BMI ≥30, or ~ 30 lbs. overweight for 5’ 4” person) No Data <10% 10%–14% 15%–19% ≥20%
 No Data <10% 10%–14% 15%–19% ≥20%.")
16
Obesity Trends* Among U.S. Adults BRFSS, 1998 (*BMI ≥30, or ~ 30 lbs. overweight for 5’ 4” person) No Data <10% 10%–14% 15%–19% ≥20%
 No Data <10% 10%–14% 15%–19% ≥20%.")
17
Obesity Trends* Among U.S. Adults BRFSS, 1999 (*BMI ≥30, or ~ 30 lbs. overweight for 5’ 4” person) No Data <10% 10%–14% 15%–19% ≥20%
 No Data <10% 10%–14% 15%–19% ≥20%.")
18
Obesity Trends* Among U.S. Adults BRFSS, 2000 (*BMI ≥30, or ~ 30 lbs. overweight for 5’ 4” person) No Data <10% 10%–14% 15%–19% ≥20%
 No Data <10% 10%–14% 15%–19% ≥20%.")
19
Obesity Trends* Among U.S. Adults BRFSS, 2001 (*BMI ≥30, or ~ 30 lbs. overweight for 5’ 4” person) No Data <10% 10%–14% 15%–19% 20%–24% ≥25%
 No Data <10% 10%–14% 15%–19% 20%–24% ≥25%.")
20
(*BMI ≥30, or ~ 30 lbs. overweight for 5’ 4” person) Obesity Trends* Among U.S. Adults BRFSS, 2002 No Data <10% 10%–14% 15%–19% 20%–24% ≥25%

21
Obesity Trends* Among U.S. Adults BRFSS, 2003 (*BMI ≥30, or ~ 30 lbs. overweight for 5’ 4” person) No Data <10% 10%–14% 15%–19% 20%–24% ≥25%
 No Data <10% 10%–14% 15%–19% 20%–24% ≥25%.")
22
Obesity Trends* Among U.S. Adults BRFSS, 2004 (*BMI ≥30, or ~ 30 lbs. overweight for 5’ 4” person) No Data <10% 10%–14% 15%–19% 20%–24% ≥25%
 No Data <10% 10%–14% 15%–19% 20%–24% ≥25%.")
23
Obesity Trends* Among U.S. Adults BRFSS, 2005 (*BMI ≥30, or ~ 30 lbs. overweight for 5’ 4” person) No Data <10% 10%–14% 15%–19% 20%–24% 25%–29% ≥30%
 No Data <10% 10%–14% 15%–19% 20%–24% 25%–29% ≥30%.")
24
Obesity Trends* Among U.S. Adults BRFSS, 2006 (*BMI ≥30, or ~ 30 lbs. overweight for 5’ 4” person) No Data <10% 10%–14% 15%–19% 20%–24% 25%–29% ≥30%
 No Data <10% 10%–14% 15%–19% 20%–24% 25%–29% ≥30%.")
25
Percentage of obesity (>30 lbs overweight) %
 %")
28
1996 Cost of Overweight and Obesity in U.S.* Total cost: $99.2 billion Total cost: $99.2 billion Direct cost: $51.6 billion (5.7 percent of the U.S. health expenditure) Direct cost: $51.6 billion (5.7 percent of the U.S. health expenditure) Indirect cost: $47.6 billion (comparable to the economic costs of cigarette smoking) Indirect cost: $47.6 billion (comparable to the economic costs of cigarette smoking) NIH Publication No. 96-4158 July 1996 NIH Publication No. 96-4158 July 1996
 Direct cost: $51.6 billion (5.7 percent of the U.S. health expenditure) Indirect cost: $47.6 billion (comparable to the economic costs of cigarette smoking) Indirect cost: $47.6 billion (comparable to the economic costs of cigarette smoking) NIH Publication No July 1996 NIH Publication No July")
29
The Costs: 2000 Cost of obesity in U.S. : $117 Billion (>17% increase from 1996) Cost of obesity in U.S. : $117 Billion (>17% increase from 1996) 9.4 percent of the national health care expenditures in the United States are directly related to obesity and physical inactivity 9.4 percent of the national health care expenditures in the United States are directly related to obesity and physical inactivity
 Cost of obesity in U.S. : $117 Billion (>17% increase from 1996) 9.4 percent of the national health care expenditures in the United States are directly related to obesity and physical inactivity 9.4 percent of the national health care expenditures in the United States are directly related to obesity and physical inactivity.")
30
Annual Deaths Attributable to Obesity in the United States Allison, et al, JAMA 282: 1530-1538, 1999 Estimate of 418,154 deaths each year attributable to obesity Estimate of 418,154 deaths each year attributable to obesity “Aside from mortality rate, obesity substantially increases morbidity and impairs quality of life. In essence, the health impact of obesity far exceeds what we have presented herein.”

31
French Paradox?

32
Americans spend $33 billion annually on weight-loss products and services Americans spend $33 billion annually on weight-loss products and services The potential savings if all inactive American adults became physically active could be $76.6 billion in 2000 dollars The potential savings if all inactive American adults became physically active could be $76.6 billion in 2000 dollars

34
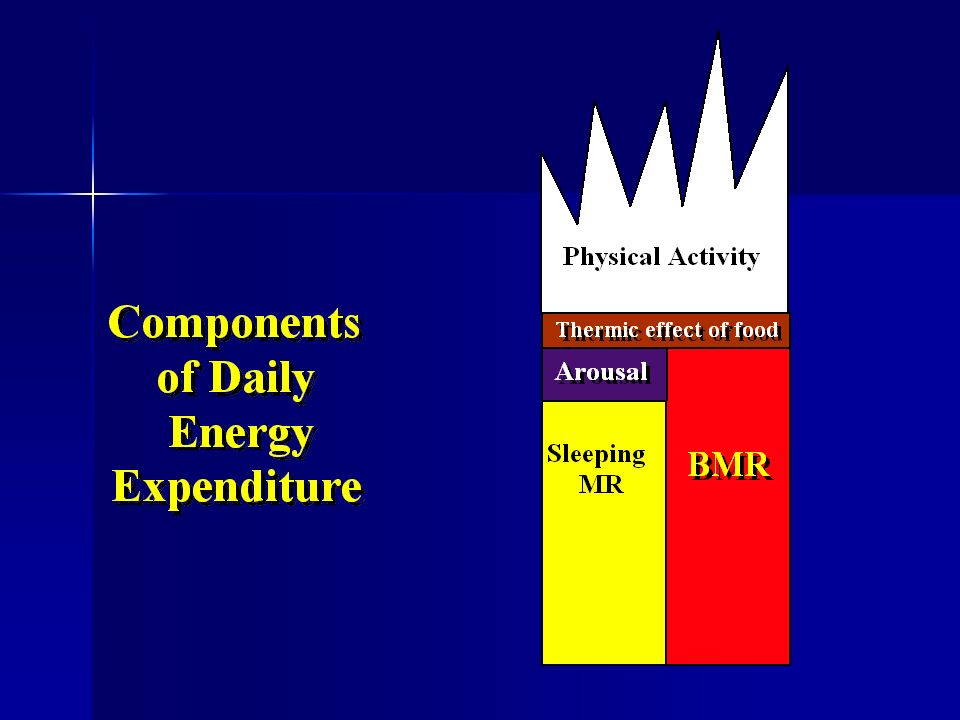
Components of Daily Energy Expenditure Resting Metabolic Rate Resting Metabolic Rate –Body Composition -- Fat Free Mass is the most important determinant –Energy balance -- Hypocaloric diet reduces metabolic rate Thermic Effect of Feeding Thermic Effect of Feeding –Fat is far less thermogenic than carbohydrate –Protein is more thermogenic than carbohydrate Physical Activity Physical Activity –Voluntary (walking, running, etc.) –Involuntary (fidgeting)
 –Involuntary (fidgeting)")
36
Thermic Effect of Food

37
Induced Obesity 5 times as many kcal to produce the same weight gain with mixed compared to a high fat diet 5 times as many kcal to produce the same weight gain with mixed compared to a high fat diet Cumulative Excess (kcal/M 2 ) 20,000 60,000 100,000 140,000 Weight Gain (kg) 5 10 15 FAT MIXED
 20,000 60, , ,000 Weight Gain (kg) FAT MIXED")
38
Lipogenesis from a large amount of sugar Consumption of 500 g (2,000 kcal) of glucose. Consumption of 500 g (2,000 kcal) of glucose. Only 5 g (45 kcal) of lipid made Only 5 g (45 kcal) of lipid made Metabolic fate: Metabolic fate: –Oxidation –Glycogen storage Acheson, et al. Am J Clin Nutr. 45: 78-85, 1987
 of glucose. Only 5 g (45 kcal) of lipid made Only 5 g (45 kcal) of lipid made Metabolic fate: Metabolic fate: –Oxidation –Glycogen storage Acheson, et al. Am J Clin Nutr. 45: 78-85,")
39
Dietary intake, oxidation and storage of macronutrients Lipid Storag e Eucaloric (no weight gain or loss) Hypercaloric Jequier, Regulation of body weight in humans, Phys. Rev. 79: 1999

40
De novo lipogenesis during controlled overfeeding with sucrose or glucose in lean and obese women McDevitt et al, Am. J. Clin. Nutr. 74, 737, 2001 De novo lipogenesis measure during 96 h of overfeeding by 50% with sucrose or glucose De novo lipogenesis measure during 96 h of overfeeding by 50% with sucrose or glucose Subjects -- 13 women Subjects -- 13 women –5 obese -- 81 ± 4.5 kg, 31 ± 4 BMI, 44.8 ± 4.6% fat –8 lean -- 65.6 ± 6 kg, 25.1 ± 1 BMI, 35.1 ± 5.6% fat Diet Diet –Control -- Eucaloric providing 48% CHO, 40% fat, 8% protein –Overfeeding -- 50% more energy than requirement 27.3% CHO (sugar) and 22.7% fat
 and 22.7% fat.")
41
Energy, Fat, Carbohydrate, and Protein Balance with Overfeeding Contribution of lipogenesis to fat balance

42
Quantitative assessment of lipogenesis with overfeeding

43
Conclusions No significant difference between lean and obese No significant difference between lean and obese “Quantitatively, absolute amounts of fat synthesized from carbohydrate did not represent a significant contribution to overall fat stores after 96 h of excess carbohydrate intake.” “Quantitatively, absolute amounts of fat synthesized from carbohydrate did not represent a significant contribution to overall fat stores after 96 h of excess carbohydrate intake.”

44
Dietary Fat is less thermogenic than dietary carbohydrate of equal energy intake Fat eaten in excess of the amount oxidized is stored as fatFat eaten in excess of the amount oxidized is stored as fat CHO excess is mostly oxidizedCHO excess is mostly oxidized Storage of CHO as fat is inefficient 24% of ingested kcal to store CHO as fat 3% of ingested kcal to store fat as fat

45
Does Exercise Contribute to Weight Loss? Aerobic exercise combined with energy restriction did not preserve fat free mass or result in any greater weight loss than diet alone. Aerobic exercise combined with energy restriction did not preserve fat free mass or result in any greater weight loss than diet alone. –Heymsfield, S., Rate of weight loss during underfeeding: relation to level of physical activity Am. J. Clin. Nutr., 1989,38:215- 223.

46
Exercise and Weight Loss Most studies examining the combination of aerobic exercise and weight loss are short-term. Most studies examining the combination of aerobic exercise and weight loss are short-term. –Out of shape, overweight individuals will not spend many kcals performing exercise –3 months is inadequate to improve aerobic capacity sufficiently for exercise to contribute significantly to daily energy balance.

48
kJ/kgBWd -1 125±3 141±6* Effects of 12 wks of resistance training on energy needs

49
Long-Bout Exercise Long-Bout Exercise –n = 49, instructed to exercise 5d/wk; 20 min/d during weeks 1 - 4, 30 min/d weeks 5 - 8, and 40 min/d for duration of study Short-Bout Exercise Short-Bout Exercise –n = 51, instructed to exercise 5d/wk; progressed from 20 min/d to 40 min/d, performed in multiple 10 minute bouts throughout day Short-Bout Plus Exercise Equipment Short-Bout Plus Exercise Equipment –n = 48, same instructions as short-bout, provided motorized treadmills during study Jackicic, et al, JAMA, 282: 1554-1560, 1999.

50
* * Months Change in Body Weight, kg Jackicic, et al, JAMA, 282: 1554-1560, 1999.

52
“.. dietary modification combined with exercise performed in short bouts does not improve long-term weight loss compared with exercise performed in longer bouts. However, the addition of a home treadmill to the multiple short-bout exercise intervention minimized reductions in long-term exercise participation and improved long-term weight loss.” Jackicic, et al, JAMA, 282: 1554-1560, 1999.

54
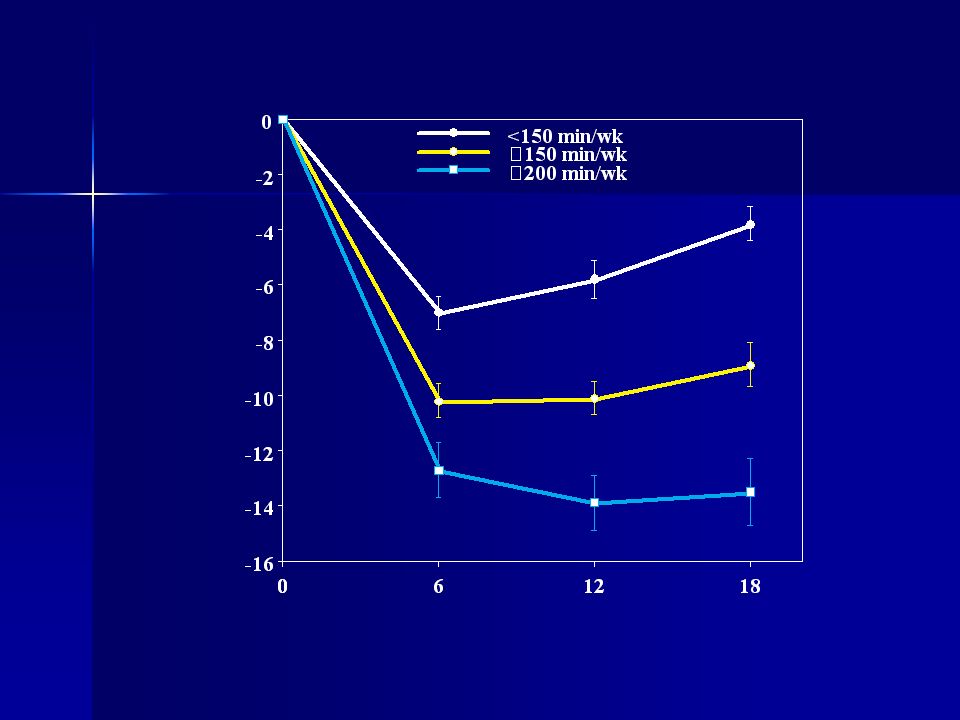
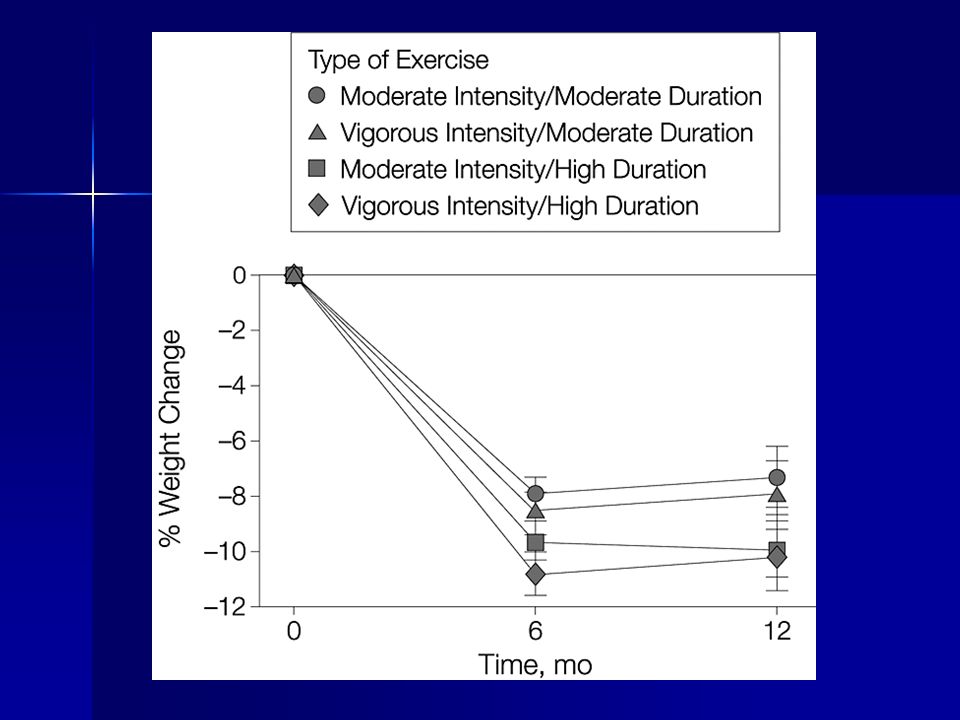
Copyright restrictions may apply. Jakicic, J. M. et al. JAMA 2003;290:1323-1330. Percentage Change in Weight Based on Exercise Duration (N = 196)
.")
55
Long term participation in a regular aerobic exercise program enhances weight loss Long term participation in a regular aerobic exercise program enhances weight loss Greatest value of participation is in maintenance of the weight loss Greatest value of participation is in maintenance of the weight loss –Total number of kcal spent per day in exercise is the most important determiner of success –Intensity appears to be less important

56
Intensity of exercise Does intensity of exercise determine the rate of fat loss? Does intensity of exercise determine the rate of fat loss? Study of Ballor et al controlled kcals spent performing exercise of different intensities. Study of Ballor et al controlled kcals spent performing exercise of different intensities.

58
Mike Huckabee, Governor of Arkansas

59
Hypertension, Type 2 Diabetes, Atherosclerosis, Peripheral Vascular Disease, Cataracts, Nephropathy, Neuropathy

60
Exercise, Diet, and Glucose Metabolism Effects of aerobic exercise, with no change in body weight Effects of aerobic exercise, with no change in body weight Effects of a high carbohydrate diet and exercise, with no change in body weight Effects of a high carbohydrate diet and exercise, with no change in body weight Effects of high carbohydrate, ad libitum diet with and without aerobic exercise Effects of high carbohydrate, ad libitum diet with and without aerobic exercise

61
Intensity: 70% VO 2max ; Frequency: 4 days/wk Duration: 3 months

62
Glucose (mg/dl) Time (minutes) Three months regular aerobic exercise improved oral glucose tolerance in subjects who had impaired glucose tolerance
 Time (minutes) Three months regular aerobic exercise improved oral glucose tolerance in subjects who had impaired glucose tolerance")
63
Exercise without weight loss: Modest improvement in oral glucose tolerance Modest improvement in oral glucose tolerance 10% increase in insulin sensitivity 10% increase in insulin sensitivity 60% increase in muscle glucose transporter-- GLUT-4 60% increase in muscle glucose transporter-- GLUT-4 NO change in body composition NO change in body composition No change in triglycerides, HDL or total cholesterol No change in triglycerides, HDL or total cholesterol

64
Typical, ad libitum diet 48.7 35.2 15. 7

65
High carbohydrate, low fat diet 6020 20

66
High carbohydrate low fat diet Ad Libitum (Arch. Int. Med. 164: 210-217, 2004) When consumed ad libitum will produce weight loss and improved oral glucose tolerance in older subjects with impaired GT. When consumed ad libitum will produce weight loss and improved oral glucose tolerance in older subjects with impaired GT. Groups: Groups: –Control (40% fat, 40% CHO, 20% Pro), no ex –HICHO (20% fat, 60% CHO, 20% Pro), no ex –HICHO, exercise: 3 days/wk, 75% max, 45 min/day
 When consumed ad libitum will produce weight loss and improved oral glucose tolerance in older subjects with impaired GT. When consumed ad libitum will produce weight loss and improved oral glucose tolerance in older subjects with impaired GT. Groups: Groups: –Control (40% fat, 40% CHO, 20% Pro), no ex –HICHO (20% fat, 60% CHO, 20% Pro), no ex –HICHO, exercise: 3 days/wk, 75% max, 45 min/day.")
67
Total energy intake (food weigh-back), kcal/d kcal/d No differences from baseline
, kcal/d kcal/d No differences from baseline")
68
High carbohydrate, ad libitum diet with or without aerobic exercise compared to “typical” American diet (40% kcal from fat) * # # p = 0.07 *p < 0.05 Change in weight #
 * # # p = 0.07 *p < 0.05 Change in weight #")
69
Resting Metabolic Rate kcal/d No change in RMR after three months

70
Respiratory Exchange Ratio use of fat & carbohydrate No change in fasting RER after 3 months

71
Body Fat (%) * interaction (P < 0.05) * *
 * interaction (P < 0.05) * *")
72
Peak Aerobic Capacity (L/min) * interaction (P < 0.05) * Aerobic Capacity
 * interaction (P < 0.05) * Aerobic Capacity")
73
Glucose Disposal (mg/kg body mass/min) * interaction (P < 0.05) * *
 * interaction (P < 0.05) * *")
74
“...whether low-fat diets have an important long- term effect on body weight remains an open question.” “Consumption of foods with a low glycemic index (irrespective of fat intake) does appear to reduce the incidence of of adult onset diabetes, but the effects on long-term weight control remain to be documented.” W. Willett, Am. J. Clin. Nutr., 68, 1998

75
Glycemic Index: “.. our results demonstrate a remarkable degree of consistency in finding a lack of association of glycemic index, glycemic load, and carbohydrate intake with measure of insulin sensitivity, insulin secretion, and adiposity.” (Liese et al, Measures of insulin sensitivity, secretion, and adiposity in the insulin resistance atherosclerosis study, Diabetes Care 28: 2832-8, 2005) “.. our results demonstrate a remarkable degree of consistency in finding a lack of association of glycemic index, glycemic load, and carbohydrate intake with measure of insulin sensitivity, insulin secretion, and adiposity.” (Liese et al, Measures of insulin sensitivity, secretion, and adiposity in the insulin resistance atherosclerosis study, Diabetes Care 28: 2832-8, 2005) Reduction in dietary fat and increase in CHO intake resulted in a significant loss of body weight with no significant effect on lipids. “Neither type of carbohydrate (simple vs. complex) revealed significant differences in body weight loss or blood lipids.” (Saris et al, Randomized controlled trial of changes in dietary carbohydrate/fat ratio and simple vs complex carbohydrates on body weight and blood lipids: the CARMEN study, Int. J. of Obesity, 24: 1310-8, 2000) Reduction in dietary fat and increase in CHO intake resulted in a significant loss of body weight with no significant effect on lipids. “Neither type of carbohydrate (simple vs. complex) revealed significant differences in body weight loss or blood lipids.” (Saris et al, Randomized controlled trial of changes in dietary carbohydrate/fat ratio and simple vs complex carbohydrates on body weight and blood lipids: the CARMEN study, Int. J. of Obesity, 24: 1310-8, 2000)
 .. our results demonstrate a remarkable degree of consistency in finding a lack of association of glycemic index, glycemic load, and carbohydrate intake with measure of insulin sensitivity, insulin secretion, and adiposity. (Liese et al, Measures of insulin sensitivity, secretion, and adiposity in the insulin resistance atherosclerosis study, Diabetes Care 28: , 2005) Reduction in dietary fat and increase in CHO intake resulted in a significant loss of body weight with no significant effect on lipids. Neither type of carbohydrate (simple vs. complex) revealed significant differences in body weight loss or blood lipids. (Saris et al, Randomized controlled trial of changes in dietary carbohydrate/fat ratio and simple vs complex carbohydrates on body weight and blood lipids: the CARMEN study, Int. J. of Obesity, 24: , 2000) Reduction in dietary fat and increase in CHO intake resulted in a significant loss of body weight with no significant effect on lipids. Neither type of carbohydrate (simple vs. complex) revealed significant differences in body weight loss or blood lipids. (Saris et al, Randomized controlled trial of changes in dietary carbohydrate/fat ratio and simple vs complex carbohydrates on body weight and blood lipids: the CARMEN study, Int. J. of Obesity, 24: , 2000).")
76
Low-fat dietary pattern and weight change over 7 years: the Women's Health Initiative Dietary Modification Trial, JAMA 295: 39-49, 2006 48,835 postmenopausal women 48,835 postmenopausal women –29,294 decrease fat, increase fruit and grain intake (no kcal restriction goal) –19,541 control group (diet-related information) Outcome Outcome –Women in intervention group lost an average of 2.2 kg (P<0.001) and maintained lower weight compared to control for 7.5 years. “Weight loss was greatest among women in either group who decreased their % energy from fat”

78
Restaurant Hall of Shame (Center for Science in the Public Interest) Each of these foods has more than 1,000 calories and one to four day's worth of saturated fat KcalFat gSaturated Fat g Cheese fries with ranch dressing3,01021791 Movie theater popcorn with "butter” topping (large)1,64012673 Prime rib, untrimmed (16 oz.)1,2809452 Fettuccine Alfredo1,5009748 Stuffed potato skins with sour cream1,2609548 Fudge brownie sundae1,1305730 Cheesecake Factory Carrot Cake (1 slice)1,5608423 Pizzeria Uno Chicago Classic (1/2 pizza) 1,5007430 Rice (8 cups) 1,600 1 0 Soy burger (30) 1,50033 6
 Each of these foods has more than 1,000 calories and one to four day s worth of saturated fat KcalFat gSaturated Fat g Cheese fries with ranch dressing3, Movie theater popcorn with butter topping (large)1, Prime rib, untrimmed (16 oz.)1, Fettuccine Alfredo1, Stuffed potato skins with sour cream1, Fudge brownie sundae1, Cheesecake Factory Carrot Cake (1 slice)1, Pizzeria Uno Chicago Classic (1/2 pizza) 1, Rice (8 cups) 1, Soy burger (30) 1,")
79
Monster Thickburger 1,420 kcal 1,420 kcal –107 g fat 2, 1/3 lbs of beef 2, 1/3 lbs of beef 4 strips of bacon 4 strips of bacon 3 slices of cheese 3 slices of cheese Mayo and buttered rolls Mayo and buttered rolls

81
CVD Death Rates by Fitness 7,080 women & 25,340 men Adjusted for age, exam year, and other risk factors, Blair, et al JAMA, 276, 205, 1996

82
Adjusted RR for All-Cause Mortality by Fitness and BMI, ACLS Women Adj for age, exam year, smoking and health status Farrell et al Obes. Res. 10:417, 2002

83
Options Diet Diet –Hypocaloric -- Balanced Calorie Deficit Diet –Low Fat -- < 20% Fat, ad libitum CHO Exercise Exercise –Aerobic -- Accumulate 40 min/day, 4 days/wk, intermittent or long bout –Progressive resistance training -- High intensity, upper and lower body, at least 2 x week

85
Atkins CHO restriction: Naturesis (diuresis) CHO restriction: Naturesis (diuresis) Ketosis: Appetite Suppression Ketosis: Appetite Suppression What happens after weight loss? What happens after weight loss? –Water weight gain, increased appetite

86
Body Weight Regulation Gender Metabolic differences Metabolic differences Differences in fat distribution Differences in fat distribution Body image differences Body image differences

87
Weight Control Other questions: New Trends Glycemic Index? New Trends Glycemic Index? Experiences Experiences Exercise and compliance Exercise and compliance Aging and menopause Aging and menopause

88
Contact Information For information about this specific presentation please contact William Evans, PhD at evanswilliamj@uams.eduFor information about this specific presentation please contact William Evans, PhD at evanswilliamj@uams.edu@uams.edu For any questions about the monthly GRECC Audio Conference Series please contact Tim Foley at tim.foley@va.gov or call (734) 222-4328For any questions about the monthly GRECC Audio Conference Series please contact Tim Foley at tim.foley@va.gov or call (734) 222-4328 For the link to the evaluation form for this conference that will confer CE credit please go to http://vaww.sites.lrn.va.gov/vacatalog/cu_detail.asp?i d=24489 and click the “Handout: Registration and Evaluation” linkFor the link to the evaluation form for this conference that will confer CE credit please go to http://vaww.sites.lrn.va.gov/vacatalog/cu_detail.asp?i d=24489 and click the “Handout: Registration and Evaluation” link
 For any questions about the monthly GRECC Audio Conference Series please contact Tim Foley at or call (734) For the link to the evaluation form for this conference that will confer CE credit please go to i d=24489 and click the Handout: Registration and Evaluation linkFor the link to the evaluation form for this conference that will confer CE credit please go to i d=24489 and click the Handout: Registration and Evaluation link")
Similar presentations


>")


 ◦ Amount of ____________ needed to __________ the temperature of 1 _________ of pure water by 1C ______ calories =>")


 of 30 or higher. Obesity: Body Mass Index (BMI) of 30 or higher. Body Mass Index (BMI): A measure.>")

