Download presentation
Presentation is loading. Please wait.

1
Eesti haridus Euroopa võrdluspildis Mati Heidmets Pärnu, 11.02.2010

2
Võrdlustööstus Võrdlusbuum: näitajad, indeksid, järjestused. Inimareng, vabadus, korruptsioon, rahumeelsus, demokraatia, õnnetunne... Haridusvõrdlused: UNESCO, OECD, Eurostat; PISA, TALIS, TIMSS Hea: loob konteksti omaenesetarkusele, osutab tugevustele ja nõrkustele, pakub peeglit Probleemid: pealiskaudsus, usaldusväärsus, lihtsustatud sõnumid meediale ja poliitikutele Avatud aga kriitiline pilk tuleb kasuks. Ükski võrdlus pole lõplik tõde, iga võrdlus on väike vihje tegeliku olukorra kohta

3
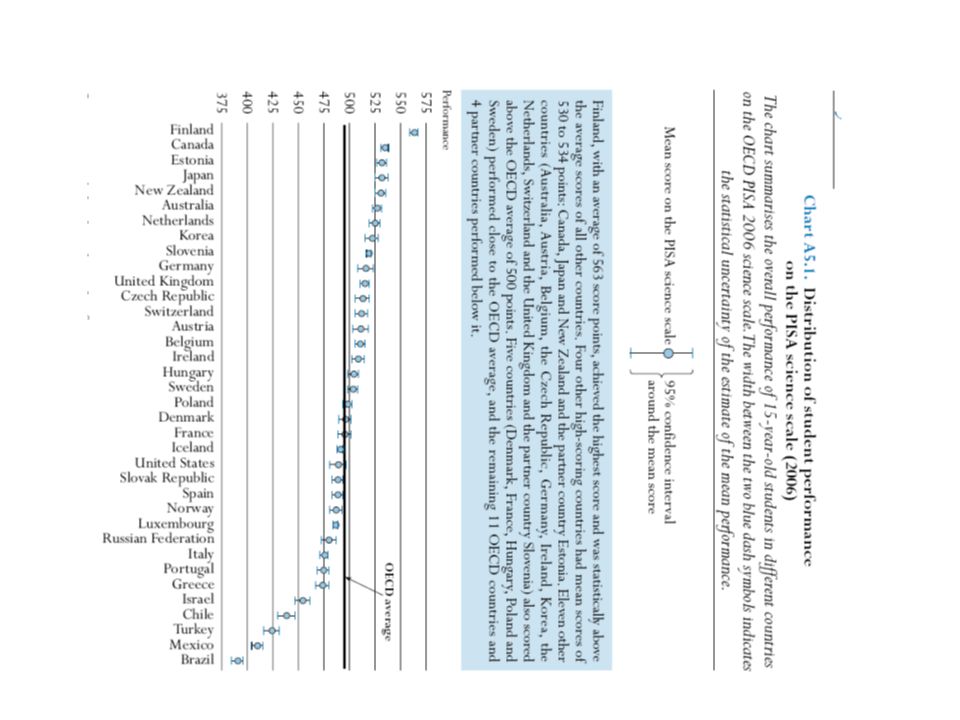
Välispilk Järgnevalt: Eesti positsioon rahvusvahelises haridusvõrdluses - mida võiks sealt kõrva taha panna Oluline tähele panna mida mõõdetakse, mille alusel võrreldakse Valik: näitajad, mille osas Eesti keskmisest, tavapärasest erineb Tagamõte: koolijuhtidelt ideid Eesti haridusstrateegia jaoks Allikad: –OECD Education at Glance, 2009 –OECD TALIS –SPRU, University of York, 2006 –UNESCO Institute of Statistics

6
Õpilaste arv klassis (OECD, 2008)
")
9
Age of teachers

10
Gender distribution of teachers and school principals

12
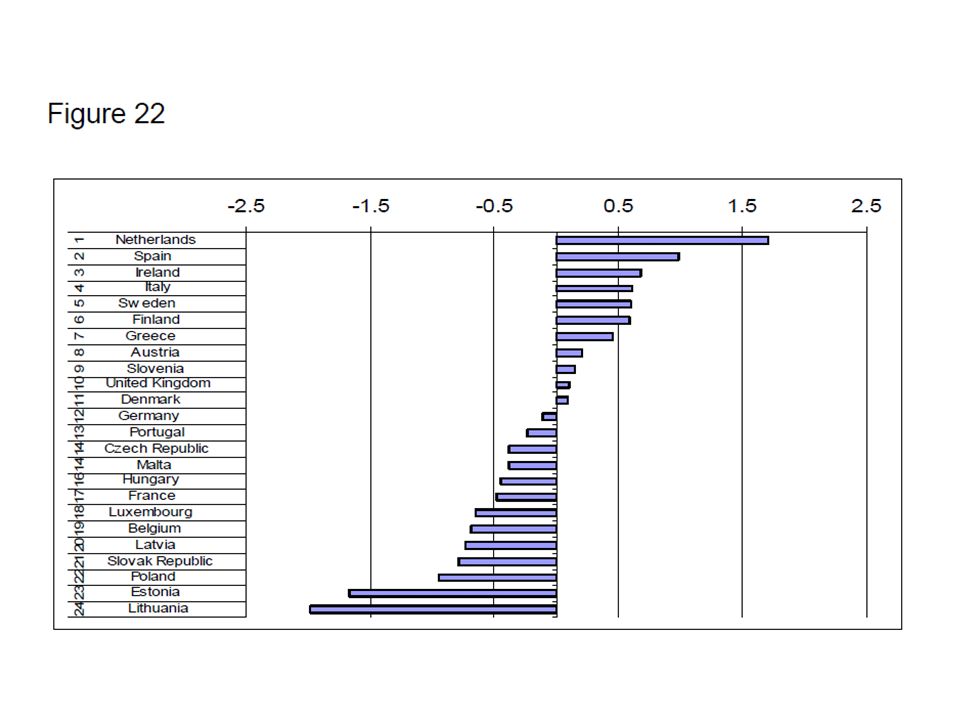
Personal well-being Children’s perceptions of themselves and their peers determine the social experiences they have with their peers and through that their future perceptions. Negative self-perceptions are associated with feelings of depression and hopelessness and less assertive styles of interaction so that children may become an easy target for bullying (Salmivalli and Isaacs 2005). In a similar way feelings of loneliness are mediated by the duration and quality of best friendships, acceptance by peers, friendships and experiences of victimisation (Asher and Paquett 2003). We have combined four variables: 1. Young people above the middle of the life satisfaction scale 2001/02: This indicator captures how children feel overall about their lives, based on a rating from 1 to 10. Children in the Baltics report the lowest life satisfaction with values around 75 per cent. Children in Finland, Greece and the Netherlands are most satisfied with their life, with values between 92 per cent and 94 per cent. 2. Young people feeling like an outsider or left out of things 2003: Data ranges from three per cent in Spain to ten per cent in the Czech Republic. 3. Young people feeling awkward and out of place 2003: While only five per cent of children in Sweden feel this way, more than 15 per cent in Belgium do. 4. Young people feeling lonely 2003: Data ranges from three per cent in the Netherlands to nine per cent in Latvia. Figure 22 presents the combined ranking for personal well-being.
. In a similar way feelings of loneliness are mediated by the duration and quality of best friendships, acceptance by peers, friendships and experiences of victimisation (Asher and Paquett 2003). We have combined four variables: 1. Young people above the middle of the life satisfaction scale 2001/02: This indicator captures how children feel overall about their lives, based on a rating from 1 to 10. Children in the Baltics report the lowest life satisfaction with values around 75 per cent. Children in Finland, Greece and the Netherlands are most satisfied with their life, with values between 92 per cent and 94 per cent. 2. Young people feeling like an outsider or left out of things 2003: Data ranges from three per cent in Spain to ten per cent in the Czech Republic. 3. Young people feeling awkward and out of place 2003: While only five per cent of children in Sweden feel this way, more than 15 per cent in Belgium do. 4. Young people feeling lonely 2003: Data ranges from three per cent in the Netherlands to nine per cent in Latvia. Figure 22 presents the combined ranking for personal well-being..")
14
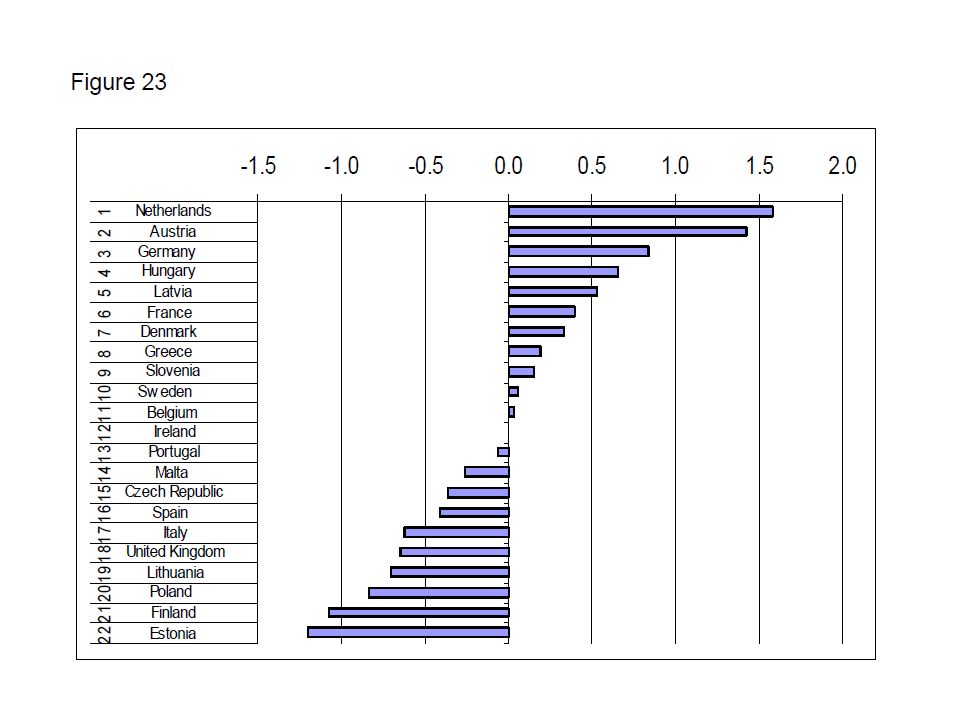
Well-being at school 1. Young people feeling pressured by schoolwork 2001/02: While relatively few children in the Netherlands (13 per cent) and Austria (20 per cent) feel pressured by schoolwork, 59 per cent in Lithuania and 61 per cent in Malta report this kind of stress. 2. Young people liking school a lot 2001/02: Data ranges from eight per cent to 36 per cent. Children in Austria, the Netherlands and Malta like school best, whereas few children in Finland, Estonia and the Czech Republic state that they like school. Figure 23 presents the combined ranking for this domain.
 and Austria (20 per cent) feel pressured by schoolwork, 59 per cent in Lithuania and 61 per cent in Malta report this kind of stress. 2. Young people liking school a lot 2001/02: Data ranges from eight per cent to 36 per cent. Children in Austria, the Netherlands and Malta like school best, whereas few children in Finland, Estonia and the Czech Republic state that they like school. Figure 23 presents the combined ranking for this domain..")
16
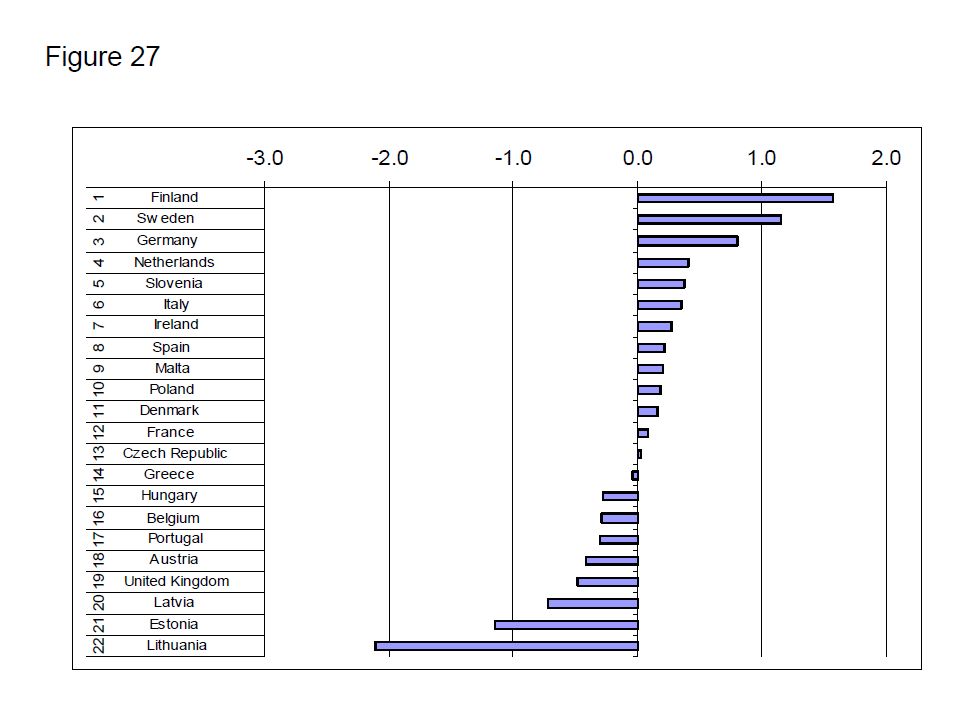
Experience of violence 1. Young people involved in physical fighting in previous 12 months (HBSC) 2001/02: Between 25 per cent and 49 per cent of young people have been involved in physical fighting. Only Finland and Germany have rates below 30 per cent, whereas more than 47 per cent of young people in Estonia, the Czech Republic, Hungary and Lithuania had fights. 2. Young people who were bullied at least once in previous 12 months (HBSC)2001/02: 15 per cent of children in Sweden and 16 per cent in Czech Republic experience bullying. The by far highest rates of bullying are with 64 per cent in Lithuania, followed by Portugal and Latvia with around 48 per cent. Figure 27 presents the composite ranking.
 2001/02: Between 25 per cent and 49 per cent of young people have been involved in physical fighting. Only Finland and Germany have rates below 30 per cent, whereas more than 47 per cent of young people in Estonia, the Czech Republic, Hungary and Lithuania had fights. 2. Young people who were bullied at least once in previous 12 months (HBSC)2001/02: 15 per cent of children in Sweden and 16 per cent in Czech Republic experience bullying. The by far highest rates of bullying are with 64 per cent in Lithuania, followed by Portugal and Latvia with around 48 per cent. Figure 27 presents the composite ranking..")
19
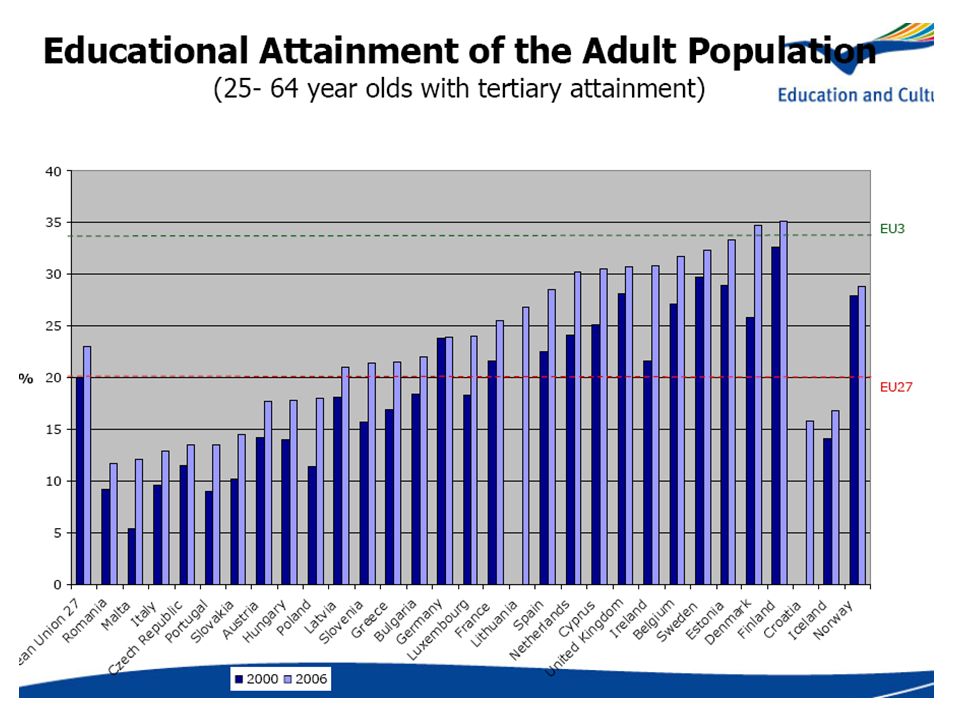
Kõrgharidusega elanikkonna osakaal (OECD, 2008)
")
24
OECD: Keskkooliõpetajate aastapalk riiklikes õppeasutustes 2006 (USD, PPP) Allikas: OECD Education at a Glance 2008, lk 452 Luxemburg: 125 895 Korea:84 139 Soome: 53 867 Portugal:51 552 Rootsi: 38 760 OECD maad:52 360 EU 19: 53 139 Sloveenia: 32 819 Tsehhi: 29 428 Tsiili: 18 321 Türgi: 15 780 Eesti: 13 922
 Allikas: OECD Education at a Glance 2008, lk 452 Luxemburg: Korea: Soome: Portugal: Rootsi: OECD maad: EU 19: Sloveenia: Tsehhi: Tsiili: Türgi: Eesti:")
25
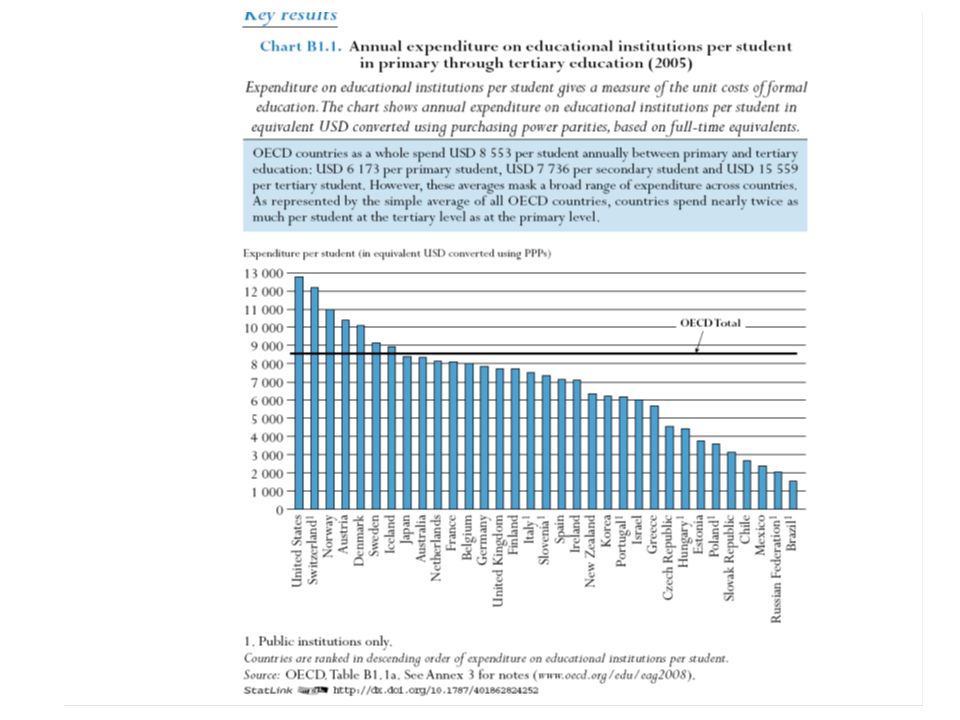
Hariduse rahastamine 2000-2005 (OECD 2008)
")
26
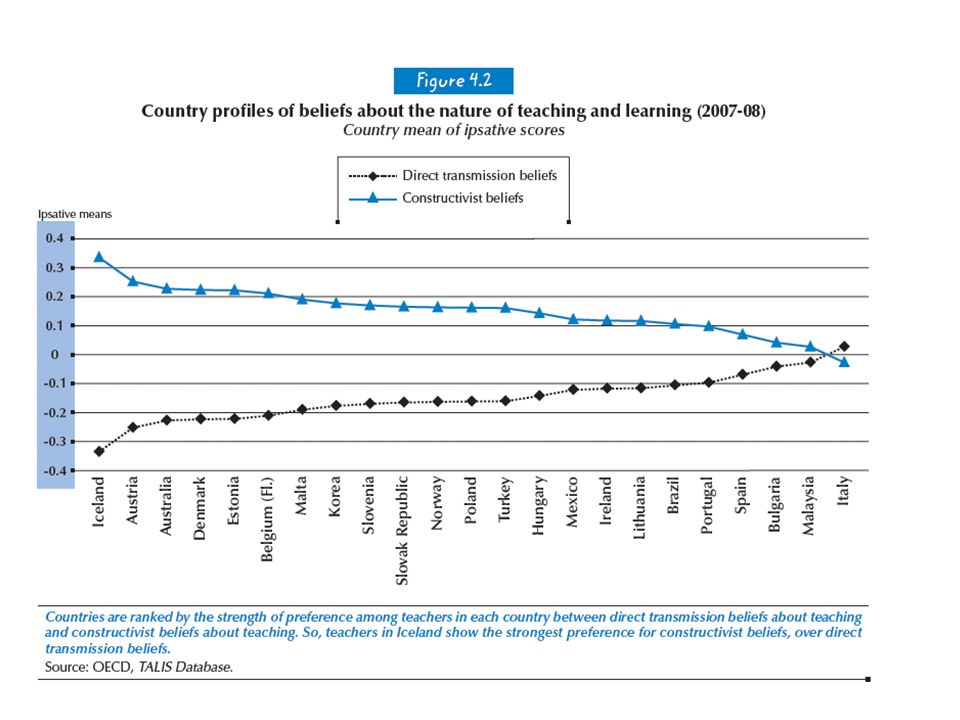
Kokkuvõtteks: kus on Eesti hariduse tegelikud probleemid? Rahvusvaheliselt konkurentsivõimelised õpitulemused Õpetajad on tublid konstruktivistid! Klassid on väiksed, siin on kord ja toimub õpetamine! Head tulemused saavutatakse kõige väiksemate õppetundide arvuga! Õpetajate ja õppurite rahulolematus Koolivägivald Väljalangevus Kogu süsteem alarahastatud! Oleme üliõpilaste eksportijad

Similar presentations


 LXIV International Council Meeting Opatija, Croatia October 28 th - November 3 rd 2013.>")
 & EU(2) Cross border meeting - Visegrad Countries Chris Corbin ePSIplus Analyst Beckov, Slovakia, 11 th.>")


 Presented by.>")

