Download presentation
Presentation is loading. Please wait.

1
2008 Model Schools Conference Orlando, Florida Changing a High School Culture: Moving from a Good School for Some to a Great School for All Donna Salazar, Principal Doug Bluth, Assistant Principal La Quinta High School http://www.dsusd.us/schools/LQHS/

2
Presentation Overview LQHS Profile/Demographics/Recognitions The Need for Change Changes Made and How Implemented Results Practical Advice for Overcoming Obstacles and Creating a Culture of Change Next Steps in Continuous Improvement

3
LQHS Snapshot Location: Southern California Desert, near Palm Springs, California – Riverside County Comprehensive High School Opened:1994 2,950 students 9 th – 12th 182 Staff Members:127 certificated 75 support Graduation Rate: 95% Attendance Rate:96%

4
LQHS Demographics Hispanic:52% White:40% African-American: 2% Asian: 2% English Learners: 9% Poverty: 35% Students w/ Disabilities:7%

6
LQHS Recognitions CA Distinguished School: 1999, 2003, 2005-Exemplary CTE Programs Newsweeks Americas Best High Schools, 2006, 2007, 2008 County HS Model of Excellence Selected by State Superintendent as one of 75 schools in U.S. to participate in the Gates Initiative with ICLEs Successful Practices Network Promising to Proven

7
Test Scores API Gain of +44 points –API 746 (702 to 746) State goal of 800 –Avg. gain county high schools +2 points –Exceeded target by +39 points –Gains in all content areas, all grade levels –Gains in all subgroups AYP Met all targets for all subgroups CAHSEE increased pass rate –Overall 90% ELA, 87% Math census administration –All subgroups higher than county & state (except EL math)
.")
8
State Rankings State Rank Increase * 6 to 8 – two decile growth Similar Schools Rank Increase * 2 to 6 – four decile growth * Out of a scale of 1-10

9
Looking Back – The Need for Change Modest test score gains overall Increasing performance targets Changing demands of post-HS world Divided faculty Perception of Haves vs. Have-nots Unfocused leadership Settling for status quo of pretty good school 2005 decline in test scores Teaching in isolation

10
Our Association with ICLE Selected as 1 of 75 Gates Initiative Promising Schools in fall of 2005 Attended High School Reinvention Symposium in Washington D.C. Oct. 2005 At Reinvention Symposium, we chose two Action Areas: 1. Using Data 2. 9 th Grade Transition Year

11
Our Association with ICLE Attended Model Schools Conferences in 2006, 2007 Attended Whole School Reform Symposium, 2008 Professional Development Focus on Rigor, Relevance and Relationships over past three years: *Daggett, McNulty, Quaglia information and materials *PLC training and development *Quadrant D Gold Seal Lesson Training-Jim Miles *Teachers enrolled in CORR *Ray McNulty scheduled for August, 2008 Principal participated in ICLE Leadership Institute, 06-07

12
Pretty Good There once was a pretty good student Who sat in a pretty good class And was taught by a pretty good teacher Who always let pretty good pass … The pretty good class that he sat in Was part of a pretty good school, And the student was not an exception: On the contrary, he was the rule ….

13
The pretty good school that he went to Was there in a pretty good town … The pretty good town in our story Was part of a pretty good state Which had pretty good aspirations And prayed for a pretty good fate. There once was a pretty good nation Pretty proud of the greatness it had, Which learned much too late, If you want to be great, Pretty good is, in fact, pretty bad. - Charles Osgood

15
What Did We Do? Changes Made: Expanded Personalized Learning Created Teacher Collaboration/PLCs Forged Strong Shared Leadership Focused on 9 th grade Transition Year Emphasized Rigorous & Relevant Inst. Reached out to the Community Created Tools for Wise Use of Data Planned Focused and Sustained Professional Development Created Supports for Struggling Students

16
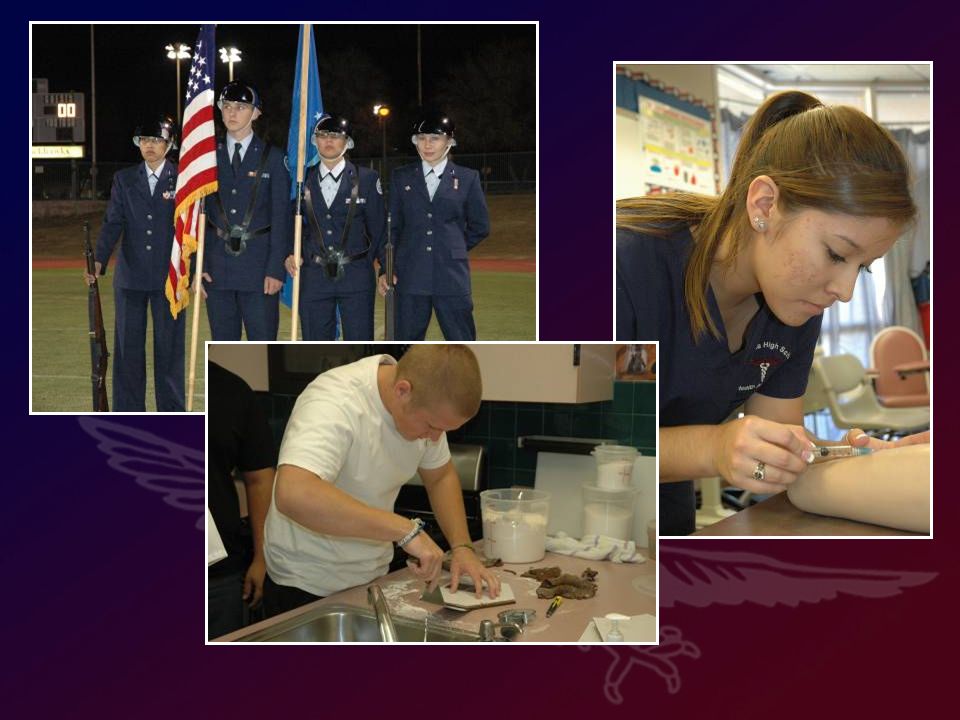
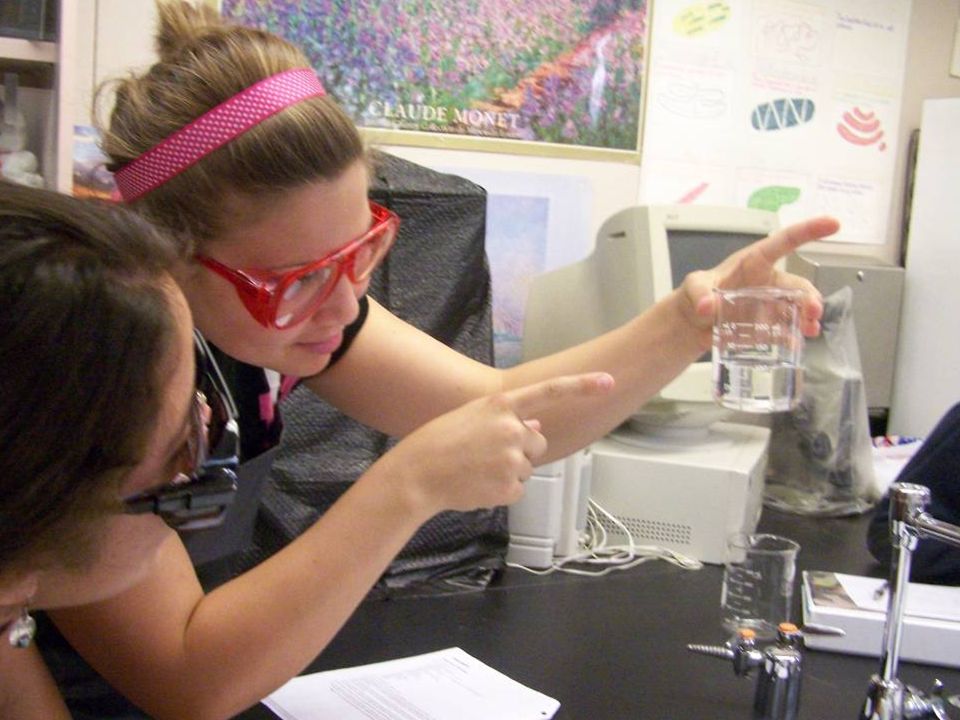
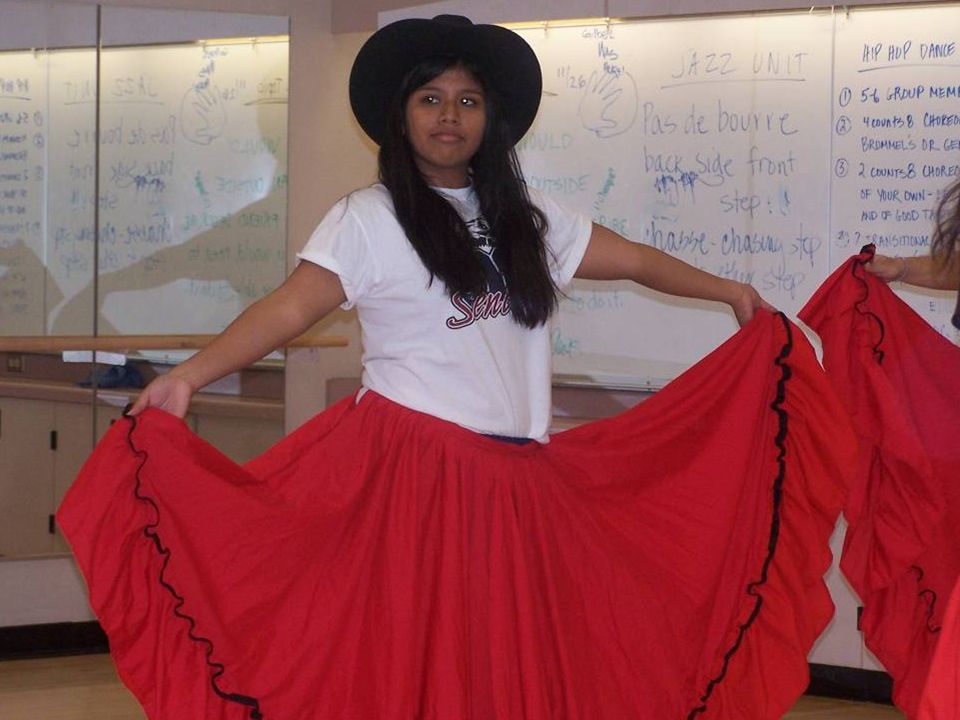
Expanded Our Personalized Learning Communities Career Academies Health Academy Public Service Academy Culinary Arts Institute Education Pathway Jr. ROTC International Baccalaureate Programme AVID Special Ed. In-class Collaboration Model Special Ed. Workability Program

18
Created Committed Professional Learning Communities 32 Content Teams Meet 3 to 4 times per month Tuesday morning PLC 40 minutes Structured and Accountable * Group Norms * Protocols for: -selecting key standards -data analysis/goal setting -selecting instructional strategy/differentiating -examining student work -sharing best practices

20
Forged Strong, Inclusive Leadership Teacher-leaders with broad involvement: Shape vision Create courses and Master Schedule Problem solvers for all school issues Create testing schedule, discipline/attendance policies Help hire teachers Plan Professional Development Lead PLCs in data analysis, instructional strategies and best practices and work with county team (TRAC Team)
")
22
9 th Grade Transition Focus Intervention Courses – READ 180 and Alg. Support Mentoring Program – Link Crew Dedicated Counselors Middle School Outreach Extra Tutoring Proven Teachers w/ Neediest Students

24
Emphasis on Rigorous and Relevant Instruction Entire staff trained by ICLE to use Quadrant D Gold Seal Lessons Teachers enrolled in CORR R & R Framework Poster in every room Staff members submit to Gold Seal Lesson repository Expectation set for Gold Seal Lessons IB & Honors courses open to all students Principal walk-through questions for students

26
Partnerships with the Community CTE Academies Mentors Job shadowing Internships Advisory committees CV Economic Partnership Articulation of local needs Scholarships Local Service Organizations

28
Favorite Quote Good carpenters measure before they cut and after they cut. -Dr. Sandy Sanford Educational Consultant, Eduneering, Inc.

29
LQHS Uses Data to… Decide what and how much to teach Create curriculum maps/pacing guides Create common assessments Identify problems in student learning Improve and differentiate instruction Identify students that need extra support Prompt sharing of best practices Determine courses/teaching assignments Improve student engagement Improve relationships throughout the school Encourage leadership and risk-taking in students Present a comprehensive picture of our students

30
Deciding What and How Much to Teach Data Sources/Tools ICLE Curriculum Matrix National Essential Skills Study State and National Content Standards Test Blueprints/Curr. Maps/Pacing Guides Test Results/Strand Analysis Pre-assessment results Common Assessment results Local community needs

31
Task SequenceAgendaTime Opening: Review and confirm commitment to group norms 2 minutes Selecting a Key Standard: Select a standard based on: Frequency in blueprint Pacing guide Curriculum map High impact standard (carry-over) ICLE Curriculum Matrix NESS Data indicator Demographic impact 10 -15 minutes Instructional Strategies: Select specific strategies the team will use to teach the standard Determine which EL strategies will be most effective 15 minutes Parking Lot: Address off-topic items that came up during the process 3 minutes Agenda Setting: Determine the focus and required resources for the next meeting 2 minutes Parking LotAddress off-topic items that came up during the process TBD Guiding Questions: 1. What is the weight of the standard on common assessments? (State, district, or content area) 2. Is the standard foundational in vertical weight? 3. What does the student need to know for success post-high school? Step1: Selecting Key Standards Objective: Indentify 8-10 Key Standards for each Semester
 2. Is the standard foundational in vertical weight. 3. What does the student need to know for success post-high school. Step1: Selecting Key Standards Objective: Indentify 8-10 Key Standards for each Semester.")
32
Example: English I Team Compile year-long data from all common assessments and pass on to English II team the areas of lowest performance from English I students as a group to assist English II team in determining Key Standards

33
Data Analysis and SMART Goal Guiding Questions: 1. Is the data current? 2. Are key demographic groups represented in the data? 3. Which key standards did students demonstrate proficiency? 4. Which key standards did students not demonstrate proficiency? 5. Is the SMART Goal Specific, Measureable, Attainable, Realistic, and Timely? 6. Do instructional strategies support all demographic groups and use best practices? 7. Are common assessments uniformly applied?

34
Step 2: Data Analysis & SMART Goal TBD Address off-topic items that came up during the process Parking Lot: 1 minutes Determine the focus and required resources for the next meeting Agenda Setting: 3 minutes Define how it will be determined that students learned the topic. Select specific common assessments as measurements Assessment Plan: 10 minutes Determine which instructional strategies reflect best practices Instructional Strategies: 5 minutes Determine pre/post assessment criteria Using pre-assessment data write a specific team SMART Goal: Define the improvement percentages Define the assessment tool Set a target date SMART Goal: 10 -15 minutes Strengths: Identify areas where most students did well Challenges: identify areas where students struggled Determine the SMART Goal Data Analysis: 10 minutes Determine which data is essential to student learning Determine proficiency level Review Data: 3 minutes Based on priority, select a key standard Focus on a Standard: 1 minute Review and confirm commitment to group norms Opening: TimeAgenda Task Sequence

35
Example: Advanced Algebra Team CST data reveals low performance in logarithms and high performance in conics - pacing guide adjusted for time Gold Seal Lesson Rocket Project moved from week before Christmas to after state tests in April and unit on statistics inserted

36
Example: English II Team 1 st Qtr. common assessment reveals lowest performance in passive vs. active voice – prompts instructional focus and revisit on next common assessment Individual teacher data analysis reveals one teachers students particularly low in literary terms and devices – prompts him to seek instructional strategies/best practices from teacher whose students score high in this standard

37
Example: Chemistry Team CST data reveals low performance in organic and biochem standards - curriculum map rearranged based on priority of standard and student performance, not textbook organization

39
TBD Address off-topic items that came up during the process Parking Lot: 2 minutes Determine the focus and required resources for next meeting. Agenda Setting: 3 minutes Determine placement of assessments in the curriculum map and pacing guide Common Assessments: 10 - 15 minutesIdentify specific strategies to support: EL learners B, BB, FBB learners SPED students Targeting student needs: 10 – 15 minutes Determine specific instructional strategies the team will use Instructional Response to data: 10 – 15 minutesAnalyze standard and RTQ for: Academic vocabulary Key terms Testing format Analysis of Released Test Questions: (If applicable) 3 minutes Clarify the standard Target Standard: 2 minutes Review and confirm commitment to group norms Opening: TimeAgendaTask Sequence Guiding Questions: 1. Which instructional strategies incorporate best practices? 2. Which RTQs target deficient student data? 3. Do common assessments target key standards? Step 3: Working with Key Standards
 3 minutes Clarify the standard Target Standard: 2 minutes Review and confirm commitment to group norms Opening: TimeAgendaTask Sequence Guiding Questions: 1. Which instructional strategies incorporate best practices. 2. Which RTQs target deficient student data. 3. Do common assessments target key standards. Step 3: Working with Key Standards.")
40
Example: U.S. History Team Spiral information about Constitution throughout the year; students see it repeatedly Top 5 questions missed go on next quarter common assessment Review results of common assessments with students for multiple purposes: –Re-teach vital content –Teach test-taking skills (academic vocab/stems/distractors) - Team building: rah-rah we can do this
 - Team building: rah-rah we can do this.")
41
Value of Released Items Calibration of the teaching of a standard to how that standard is assessed by the state For example, consider the following standard Calculate perimeters, circumferences, and areas of various two dimensional figures

42
Item 1 1.If a circle has a radius of 4 meters, what is the circumference of that circle in meters? r = 4 meters

43
Item 2 2.The circle below is inscribed in a square so that it just touches each of the four sides. The square has an area of 64 square meters. What is the circumference of the circle in meters?

44
TBD Address off-topic items that came up during the process Parking Lot: 3 minutes Determine the focus and required resources for next meeting Agenda Setting: 5 minutes Validate the effectiveness of common assessments Assessment Review: 5 - 10 minutes Determine re-teaching strategies Remediation Plan: 5 - 10 minutes Select instructional strategies to challenge proficient students Determine specific strategies the team will use to support deficient areas Determine effectiveness of EL, B, BB, FBB and SPED strategies Responding to the data: 10 -15 minutes Strengths – Identify areas where most students did well Challenges – Identify areas where students struggled Student Work Analysis: 2 minutes Review and confirm commitment to group norms Opening: TimeAgendaTask Sequence Guiding Questions: 1. Which strategies can be implemented to remediate students not demonstrating proficiency? 2. Are best instructional practices implemented to target all demographic groups? Step 4: Looking at Student Work

45
Collaboration Notes – Focus Page Department: ______________________ Content Team: ___________________ Date: ________________Todays Objective: ____________________________ Our SMART Goal (Specific – Measureable – Attainable – Realistic – Timely) _____ (Who-Group) _________will increase in____(What – Content Specific)_____ From ____________(Baseline)______% to _____________(Target)________% as measured by ______(How-Assessment tool) ____ by ______(When-Date)_______. This SMART Goal is based on: Response to data Analysis of key standard Revisiting previous team goal Other _______________________________________________________________ Our Group Norms: 1. 2. 3. 4. Todays focus will be: Selecting Key Standards Data Analysis Working with Standards Looking at Student Work Attendance Roll:

46
Summation /Outcomes: Collaboration Notes – Agenda & Accountability Page Other: Team Assignments: Next Step: Common Agreements: Strategies: Analysis: Primary Focus: Notes to Administration:

47
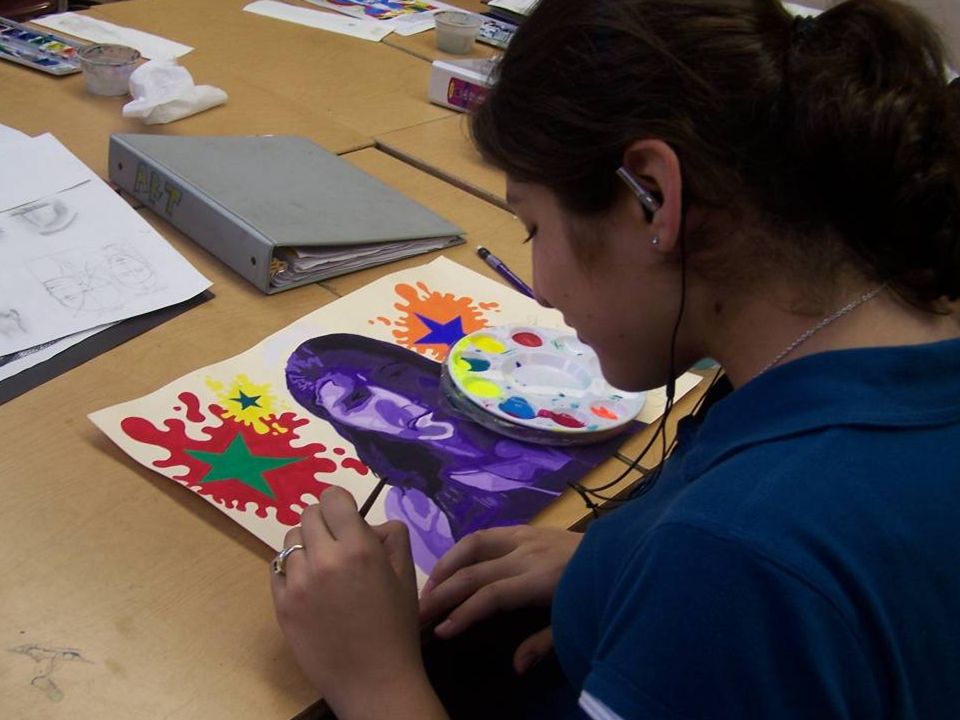
Department: Visual Arts Content Team: S. Fuller, M. Herrera, T. Kauffman, K. Wheeler, T. Williams Date: 1/29/08 Todays Objective: Begin discussion of collaborative project Our SMART Goal (Specific – Measureable – Attainable – Realistic – Timely) The Visual Arts Department will increase in collaboration on a theme-based project From 75% to 100% as measured by school art exhibition/rubric by spring 2009. SMART Goal # 4: The visual arts department will execute a coordinated, theme-based assignment that incorporates California art standards and culminates in a department-wide exhibition for the school community. The standards include Artistic Perception, Creative Expression, Historical and Cultural context, Aesthetic Valuing, Connections, Relationships, and Application. The final product, the art show, will involve every art student in the department. The coordinated art project will be strategic and specific, measurable, attainable, results-based, and time-bound. This SMART Goal is based on: Response to data Analysis of key standard Revisiting previous team goal Other Our Group Norms: 1. Time: Tuesday mornings 2. Listening: Everyone is given equal time to express their views. 3. Confidentiality: The meeting will be open, but what we say in the meeting will be held in confidence. 4. Decision-making: Decisions will be made by consensus. 5. Participation: Attendance is mandatory and will be recorded on an official sign-in sheet. 6. Expectations: Cooperation is expected and everyone will participate equally. Todays focus will be: Selecting Key Standards Data Analysis Working with Standards Looking at Student Work Other Intra-departmental project Attendance Roll: S. Fuller M. Herrera T. Kauffman K. Wheeler T. Williams Please stay on topic with the protocol. Use the Parking Lot for topics best discussed in Department meeting or subsequent content team meetings. Keep this original copy in your folder and provide additional copies to: 1Your Department Coordinator 2 Mr. Hicks
 The Visual Arts Department will increase in collaboration on a theme-based project From 75% to 100% as measured by school art exhibition/rubric by spring SMART Goal # 4: The visual arts department will execute a coordinated, theme-based assignment that incorporates California art standards and culminates in a department-wide exhibition for the school community. The standards include Artistic Perception, Creative Expression, Historical and Cultural context, Aesthetic Valuing, Connections, Relationships, and Application. The final product, the art show, will involve every art student in the department. The coordinated art project will be strategic and specific, measurable, attainable, results-based, and time-bound. This SMART Goal is based on: Response to data Analysis of key standard Revisiting previous team goal Other Our Group Norms: 1. Time: Tuesday mornings 2. Listening: Everyone is given equal time to express their views. 3. Confidentiality: The meeting will be open, but what we say in the meeting will be held in confidence. 4. Decision-making: Decisions will be made by consensus. 5. Participation: Attendance is mandatory and will be recorded on an official sign-in sheet. 6. Expectations: Cooperation is expected and everyone will participate equally. Todays focus will be: Selecting Key Standards Data Analysis Working with Standards Looking at Student Work Other Intra-departmental project Attendance Roll: S. Fuller M. Herrera T. Kauffman K. Wheeler T. Williams Please stay on topic with the protocol. Use the Parking Lot for topics best discussed in Department meeting or subsequent content team meetings. Keep this original copy in your folder and provide additional copies to: 1Your Department Coordinator 2 Mr. Hicks.")
48
Collaboration Notes – Agenda & Accountability Page Primary Focus: Creating department-wide project that covers a smart goal and specific art standards. Analysis: Encourages social interaction among the disciplines. Incorporates national standards Content #1, #3, #4 Strategies: Make and trade artistic trading cards using gel transfer, collage, various papers, stamps (alphabet, rubber), recycled materials, old newspaper and magazines, stencils, etc. Common Agreements: We aim to try the project next year, exhibit, and trade the results. Next Step: Several teachers will try the project this year. Teachers will amass materials and resources to be used. Team Assignments: Teachers will collaborate on the procurement of materials and resources. Other: Order Artist Trading Card Workshop by Berlin, B. ISBN-10:1581808488 Summation /Outcomes: All members have agreed to participate in the project. We will continue to work on it during PLC time. Notes to Administration: Administrators will be invited to the event next year.
, recycled materials, old newspaper and magazines, stencils, etc. Common Agreements: We aim to try the project next year, exhibit, and trade the results. Next Step: Several teachers will try the project this year. Teachers will amass materials and resources to be used. Team Assignments: Teachers will collaborate on the procurement of materials and resources. Other: Order Artist Trading Card Workshop by Berlin, B. ISBN-10: Summation /Outcomes: All members have agreed to participate in the project. We will continue to work on it during PLC time. Notes to Administration: Administrators will be invited to the event next year..")
50
Data – More Than Just Test Scores What additional data can be used to measure the multiple facets of our students and to drive continuous school improvement? The ICLE Learning Criteria, tailored to La Quinta High School

51
The Learning Criteria: another Data Tool Concrete Data Collection and Analysis Comprehensive and Detailed Personalized to Our School Roadmap for Continuous Improvement Additional Tool for Managing Data and Answering the Questions: Hows business at LQHS? and How do you know?

52
The ICLE Learning Criteria 1.Core Academic Learning Standardized State Tests in ELA/Math/Science 2.Stretch Learning Learning beyond minimum requirements 3.Student Engagement Motivation, commitment, relationships 4.Personal Skill Development Leadership, positive behaviors, social skills

53
The Learning Criteria La Quinta High School Core Academic Learning CA HS Exit Exam Census 10 th grade passing LQHSCountyBenchmarked ELA 83%75%+8% Math84%72%+12% CST Life Science 10 th Grade meeting proficiency LQHSStateBenchmarked 39%29%+10% UC/CSU Eligibility LQHSStateBenchmarked 37%35%+2%

54
The Learning Criteria La Quinta High School Stretch Learning Enrollment in IB/AP Courses:+129 seats % enrolled in CTE: Steady @14.9% % in CTE finish program/graduate: 96% +1% state # enrolled in 3+ years Foreign Lang: 16.7% +1.5% increase

56
The Learning Criteria La Quinta High School Student Engagement My Voice Student Aspirations Survey I enjoy being at school: 58.9% 2 yr growthCompared to National Sample +10.6%+8.9% I believe I can be successful: 92% 2 yr growthCompared to National Sample +3%+26% I push myself to do better academically: 79% 2 yr growthCompared to National Sample +7.1%+4%

58
The Learning Criteria La Quinta High School Student Engagement % Earning D and F Grades 2006 D2007 D Benchmarked 15.73%14.36%-1.37% 2006 F2007 FBenchmarked 14.78%12.03%-2.75%

59
The Learning Criteria La Quinta High School Student Engagement Participation in co-curricular activities: 73% to 74.6%+1.6% Attendance Rate LQHS: 2006 95.11% 2007 95.48%+.37% Compared to district high schools: +.96% +.05%

61
The Learning Criteria La Quinta High School Personal Skill Development % suspended for fighting/conflict: 200520062007Benchmarked 1.9%1.9%.06%-1.3% % who view themselves as leaders: 200520062007Benchmarked 55.7%56.5%60.0%+4.3%

62
Focused & Sustained Professional Development PD Limited to Three Areas: *Rigorous and Relevant Instruction for All *Wise Use of Data *Improved Relationships Use of Daggetts Why/What/How model Use of Quaglias Relationship Materials Whole Staff All Day Trainings w/ICLE *R&R Quadrant D – Jim Miles *Literacy Integration – Ray McNulty

63
Supports for Struggling Students Academic Interventions *READ 180 *Algebra Support *Extra tutoring in four core subjects Mentoring program by upperclassmen Induction program for freshmen Parent Institutes for each grade level Proven teachers with neediest students In-class collaboration inst. model for SPED Attitude shift: no longer ok to fail students

64
Results Increased Student Learning Significant Test Score Gains-All Subjects/All Levels/All Measures –AYP, API, Exit Exam, State & Similar Schools Rank, Diagnostic Exit Exam, Learning Criteria Better Alignment of vision/goals/curriculum/ instruction/assessment Reduction in D and F grades Increased Student Engagement Increased Professional Collaboration Improved Relationships Schoolwide Increased Confidence from Community Teacher requests for at-risk student populations

66
Test Scores API Gain of +44 points –API 746 (702 to 746) –Avg. gain county high schools +2 points –Exceeded target by +39 points –Gains in all content areas, all grade levels –Gains in all subgroups AYP Met all targets for all subgroups CAHSEE increased pass rate –Overall 90% ELA, 87% Math census administration –All subgroups higher than county & state (except EL math)
.")
67
746702Total 17 SCF +44729685Subtotal +59186CAHSEE Math +69185CAHSEE ELA World His +119180 American His 021 10th Gd Science +6134128EOC Science +3103100Math +13198185ELA Diff2007 Growth API2006 Base API LQHS Subject Contribution to API

68
La Quinta High School 8th Cycle API Component Analysis Weight 2006 Base* 2007 Growth* ~Diff* Schoolwide 702746+44 ELA26%185+198+13 Math18%101103+3 10th Gd Science3%21 0 EOC Science19%128135+6 US History6%39 +1 World History8%4152+10 CAHSEE ELA10%8592+6 CAHSEE Math10%8692+5 SCF100% 17

69
La Quinta High School API Micro Component Analysis Percentage Correct Weight200520062007N 9th Gd ELA 26% 58%60%63%799 10th Gd ELA62%58%64%773 11th Gd ELA58%59%63%599 Algebra I 18% 37%40%41%813 Geometry52%47%53%497 Algebra II49%48% 413 Integrated I41%195 Integrated II42%88 Summative Math61%60%63%124 10th Gd Science3% 53%56%766 Earth Science 19% 51% 56%824 Biology53%54%57%873 Chemistry51%54%63%405 Physics49%53%65%23 US History6%50%54% 595 World History8%49%48%50%766 CAHSEE ELA*10%74%*69%*74%*998* CAHSEE Math*10%73%*71%*75%*992*

70
Test Score Gains

71
State Rankings State Rank Increase * 6 to 8 – two decile growth Similar Schools Rank Increase * 2 to 6 – four decile growth * Out of a scale of 1-10

72
Exit Exam Pass Rate Classes of 2007-2010

73
La Quinta High School AYP 2005-2008 Based on 2008 Census CAHSEE ELA % ProficientMath % Proficient 20052006200720082005200620072008 Schoolwide 56%51%57%65%51%52%62%57% Hispanic 45%40%44% 42%43%50% White 68%61%71% 62%63%75% SED 38%32%39% 40% 48%

74
ELA Diagnostic Exit Exam Results March 2007March 2008

75
Reduction of D and F Grades

77
Resistance To Change Complacency Fear Too many demands Not enough time Little sense of urgency/need to change

78
Overcoming Resistance Educate your staff Use data to show current status & trends Use Why/What/How format Share research and professional articles Invite, invite, invite staff to become leaders Repeat, repeat, repeat your mantra Combat fear with combination of: –Showing –Growing –Mowing Staff meetings always focus on vision

79
Obstacles to Using Data Theres too darn much of it! Lack of user-friendly data structures Many teachers lack data-analysis skills Not enough time Resistance to collaboration Fear of losing teacher autonomy Fear that data will be used punitively Attitude of This too, shall pass….

80
Overcoming Obstacles Leadership team with key teachers/counselors Focused, sustained Professional Dev. Find someone who can explain data to staff Provide clear directions/tools for data analysis Create accountability structure for PLCs Create time in school day for collaboration Utilize technology to create more time –PLCs have web-based discussion groups –Email info replaced general staff meetings –Department meetings reduced/combined

81
Overcoming Obstacles Create Big Picture vision and keep alive –The Bell Curve article by Atul Gawande –Pretty Good poem by Charles Osgood –Highest Hopes, Worst Fears exercise Professional writings and research ( College Board, IB, Daggett, Reeves, Marzano, Fullan, Collins, DuFours)
")
82
Overcoming Obstacles Creative Staffing to allow for data analysis Inform community of data efforts/results Use data from accreditation self studies to your advantage Transparency of data encourages buy-in Focus on student learning rather than teacher performance

84
Next Steps for Continuous Improvement 1.Staffing Plan 2.Universal Literacy Initiative 3.Freshman Seminar Course 4.Uniform walk-through observation instrument 5.Further refinement of PLCs and data use 6.College Readiness Club 7.Expand CTE offerings

85
1.Staffing Plan (Building consistency & continuity) Hire the right people Ongoing targeted in-service –PLC –Common assessments –Data analysis –Best teaching practices (Gold Seal lessons)
 Hire the right people Ongoing targeted in-service –PLC –Common assessments –Data analysis –Best teaching practices (Gold Seal lessons)")
86
2. Literacy Initiative (Raising Reading & Comprehension skills) 07-08: Preparation Year ULI Committee – Planning and Development Cross Curricular Team – Guiding & Input Literacy Coach – Training & Support 08-09: Implementation Year August 26 – Ray McNulty staff in-service August 27 – Departmental training
 07-08: Preparation Year ULI Committee – Planning and Development Cross Curricular Team – Guiding & Input Literacy Coach – Training & Support 08-09: Implementation Year August 26 – Ray McNulty staff in-service August 27 – Departmental training.")
87
3. Freshman Seminar (Building on Read 180 & Algebra Support) Bridge Course Focus: Developing academic and social transition skills Required year long course – 9 th Grade Level 1 & 2 on CST Two semesters of D/F (math and or ELA) Attendance / Discipline history Counselor / teacher recommendation Parent request
 Bridge Course Focus: Developing academic and social transition skills Required year long course – 9 th Grade Level 1 & 2 on CST Two semesters of D/F (math and or ELA) Attendance / Discipline history Counselor / teacher recommendation Parent request.")
88
Encouragement Keep doing what you know is right until you reach a tipping point, or critical mass and all of the sudden, it will change. Dont worry about the resisters. Change takes time. -Dr. Mel Riddle 2006 National High School Principal of the Year

90
2008 Model Schools Conference Orlando, Florida Changing a High School Culture: Moving from a Good School for Some to a Great School for All Donna Salazar, Principal Doug Bluth, Assistant Principal La Quinta High School http://www.dsusd.us/schools/LQHS/

Similar presentations


>")


>")


