Download presentation
Presentation is loading. Please wait.

6
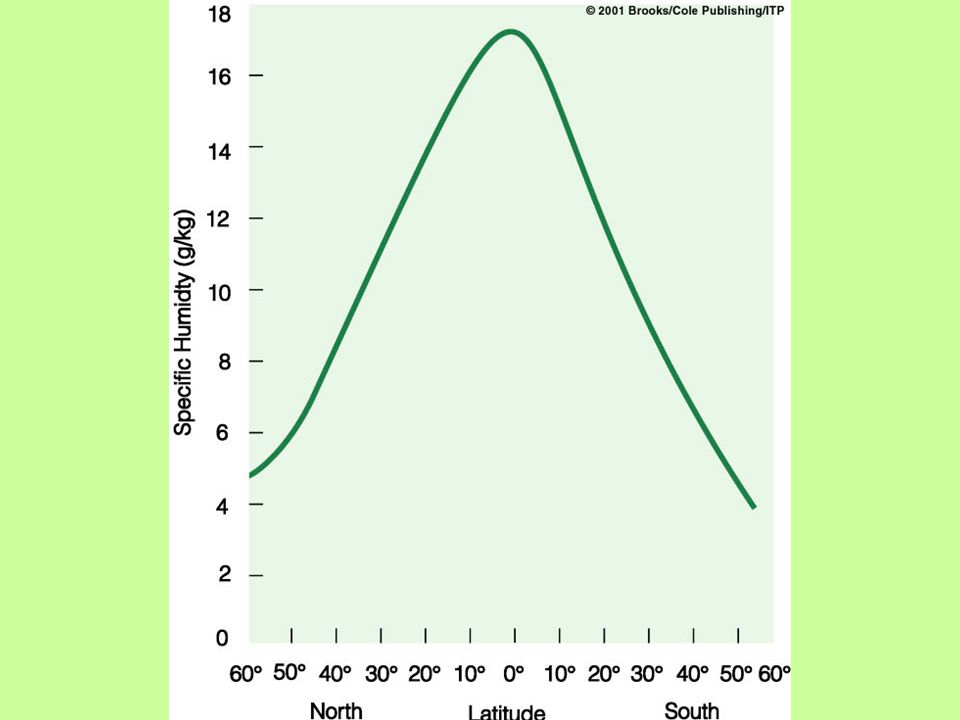
Figure 2. The mean distribution of precipitable water, or total atmospheric water vapor above the Earth's surface, for This depiction includes data from both satellite and radiosonde observations. (Image courtesy of Thomas Vonder Haar and David Randel, Colorado State University, Fort Collins.)
")
18
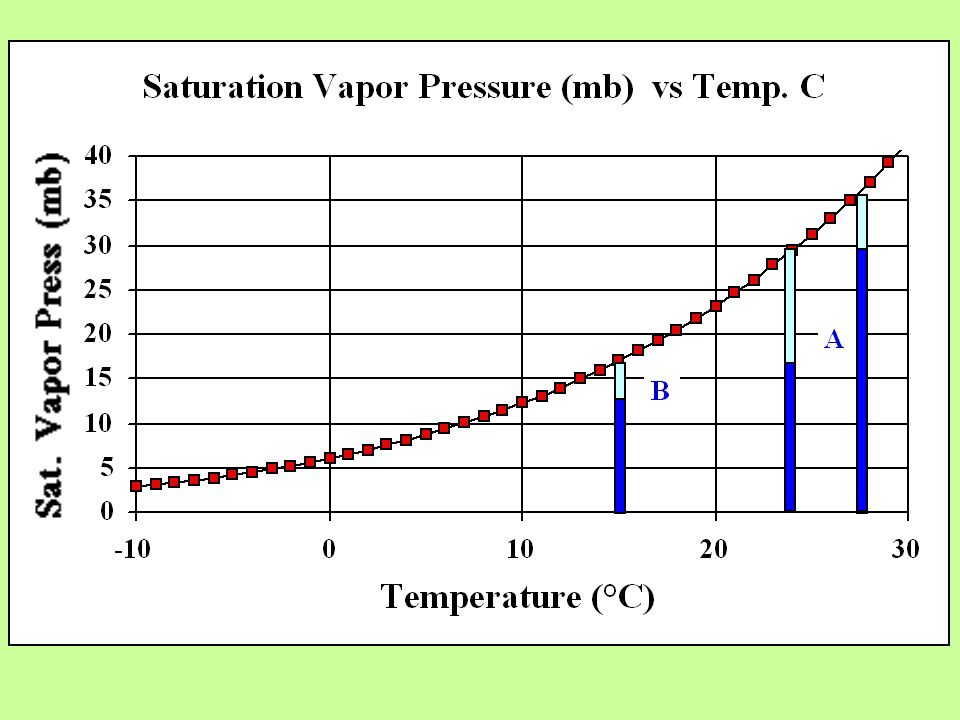
Humidity Vapor Pressure in mb is the fraction of the total air pressure coming from the molecular movement of water vapor molecules. Normal sea level pressure is around 1000 mb So a vapor pressure of 10 mb means that 1% of all air is water vapor. 20 mb 2% 40 mb _______ % An actual humidity of 10 mb means that 1 % of all air molecules are water vapor A saturation humidity of 10 mb means that at most 1 % of all air molecules Can be water vapor

19
Humidity Other measures that are used. Mass of water vapor
volume of air Absolute humidity = g/m3 Mass of water vapor total mass of air Specific humidity = g/kg Mass of water vapor mass of dry air Mixing ratio = g/kg

21
Mt. Hood Mt. Rainer

23
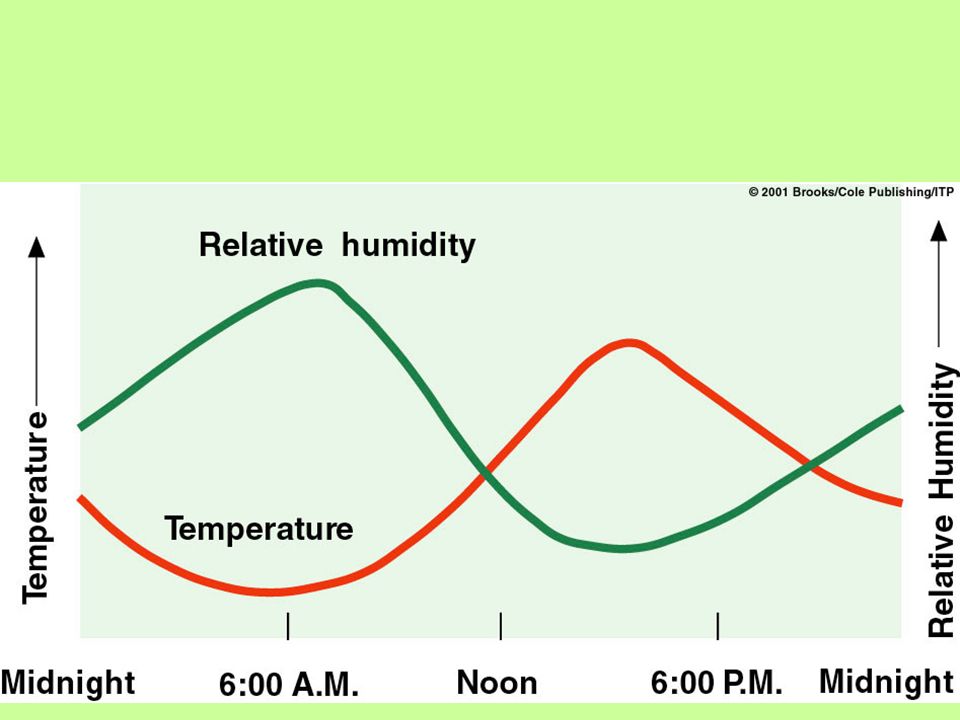
Relative Humidity

26
Dew point Temperature (directly linked to actual humidity)
Temperature that results in saturation or dew forming on surfaces. High dew point high actual humidity Low dew point low actual humidity Dew points in excess of 70 F will normally make one uncomfortable.

28
Outside T = -15 C Td = -15 C RH =100% Inside T = 20 C Td = -15 C RH = 8%

32
Hygrometers measure humidity
A Sling Psychrometer is common

Similar presentations