Download presentation
Presentation is loading. Please wait.

2
These are Abbys science test scores. 97 84 73 88 100 63 97 95 86

3
What can you tell us about these numbers? 97 84 73 88 100 63 97 95 86

5
What is the MEAN? How do we find it? The mean is the numerical average of the data set. The mean is found by adding all the values in the set, then dividing the sum by the number of values.

6
Lets find Abbys MEAN science test score? 97 84 73 88 100 63 97 95 86 + 783 ÷ 9 The mean is 87

7
What is the MEDIAN? How do we find it? The MEDIAN is the number that is in the middle of a set of data 1. Arrange the numbers in the set in order from least to greatest. 2. Then find the number that is in the middle.

8
97 84 73 88 100 63 97 95 86 The median is 88. Half the numbers are less than the median. Half the numbers are greater than the median.

9
Median Sounds like MEDIUM Think middle when you hear median.

10
How do we find the MEDIAN when two numbers are in the middle? 1. Add the two numbers. 2. Then divide by 2.

11
97 84 73 88 100 63 97 95 88 + 95 = 183 183 ÷ 2 The median is 91.5

12
What is the MODE? How do we find it? The MODE is the piece of data that occurs most frequently in the data set. A set of data can have: One mode More than one mode No mode

13
97 84 73 88 100 63 97 95 86 The value 97 appears twice. All other numbers appear just once. 97 is the MODE

14
A Hint for remembering the MODE… The first two letters give you a hint… MOde Most Often

15
Which set of data has ONE MODE ? 9, 11, 16, 8, 16 9, 11, 16, 6, 7, 17, 18 18, 7, 10, 7, 18 A C B

16
Which set of data has NO MODE ? 13, 12, 12, 11, 12 9, 11, 16, 6, 7, 17, 18 18, 7, 10, 7, 18 A C B

17
Which set of data has MORE THAN ONE MODE ? 9, 11, 16, 8, 16 9, 11, 16, 6, 7, 17, 18 18, 7, 10, 7, 18 A C B

18
What is the RANGE? How do we find it? The RANGE is the difference between the lowest and highest values.

19
97 84 73 88 63 97 95 86 97 -63 34 34 is the RANGE or spread of this set of data

20
What is the RANGE of this set of data? 84 71 88 99 48 97 86

21
What is the RANGE of this set of data? 84 71 88 9948 97 86 99 -48 51

22
What is the RANGE of this set of data? 33 67 85 17 48 15 46

23
What is the RANGE of this set of data? 85 -15 70 33 67 85 17 48 15 46

24
What is the RANGE of this set of data? 267 119 357 401 329 483 227

25
What is the RANGE of this set of data? 267 119 357401 329483 227 483 -119 364

26
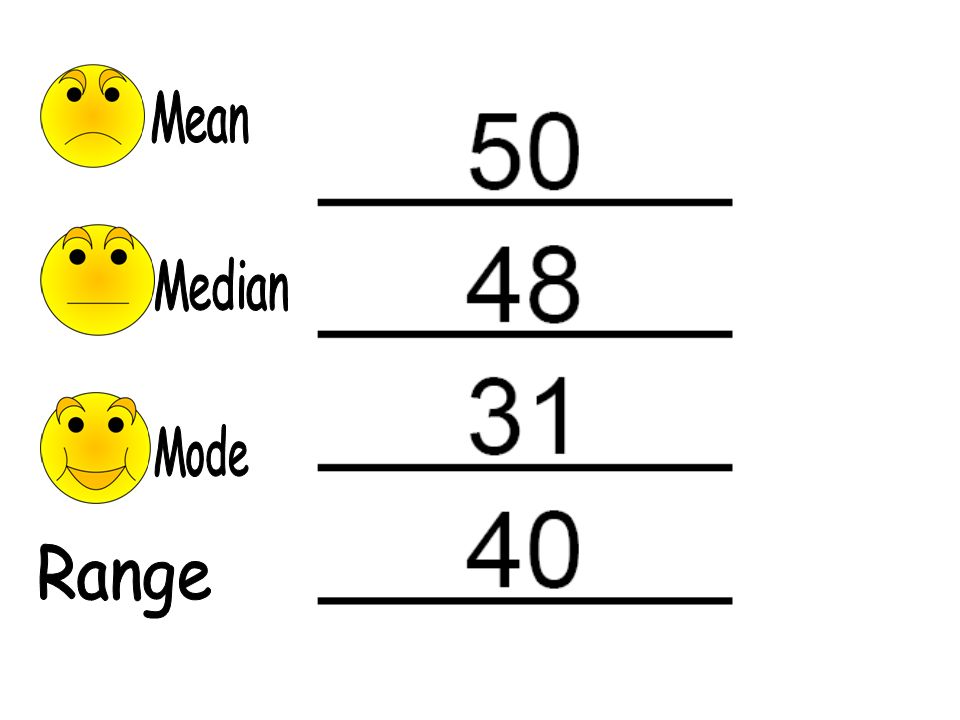
This one is the requires more work than the others. Right in the MIDDLE. This one is the easiest to find Just LOOK.

27
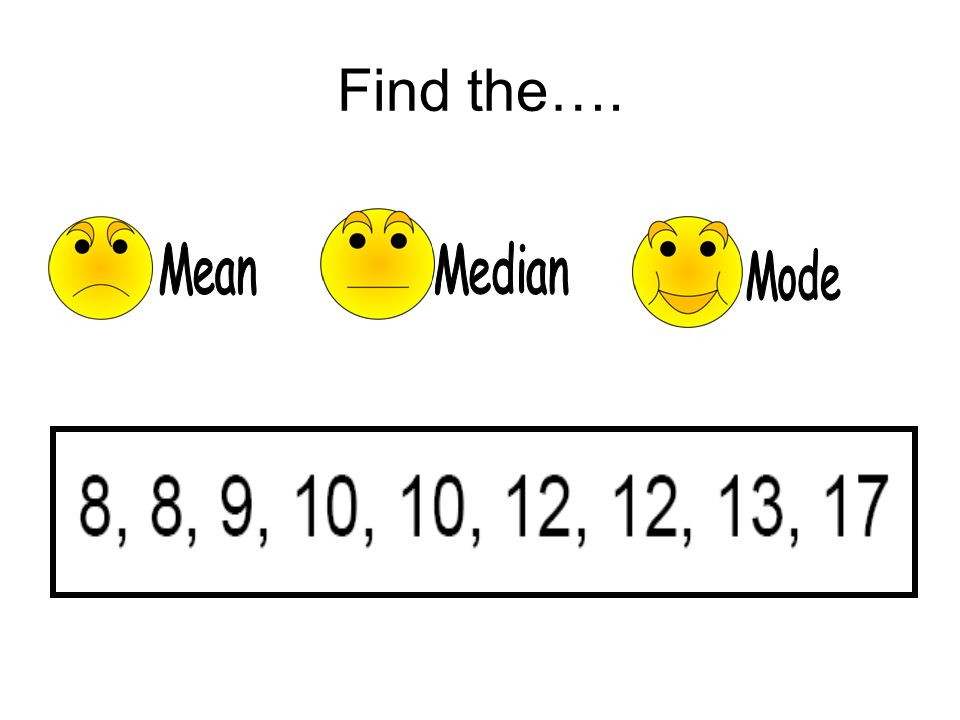
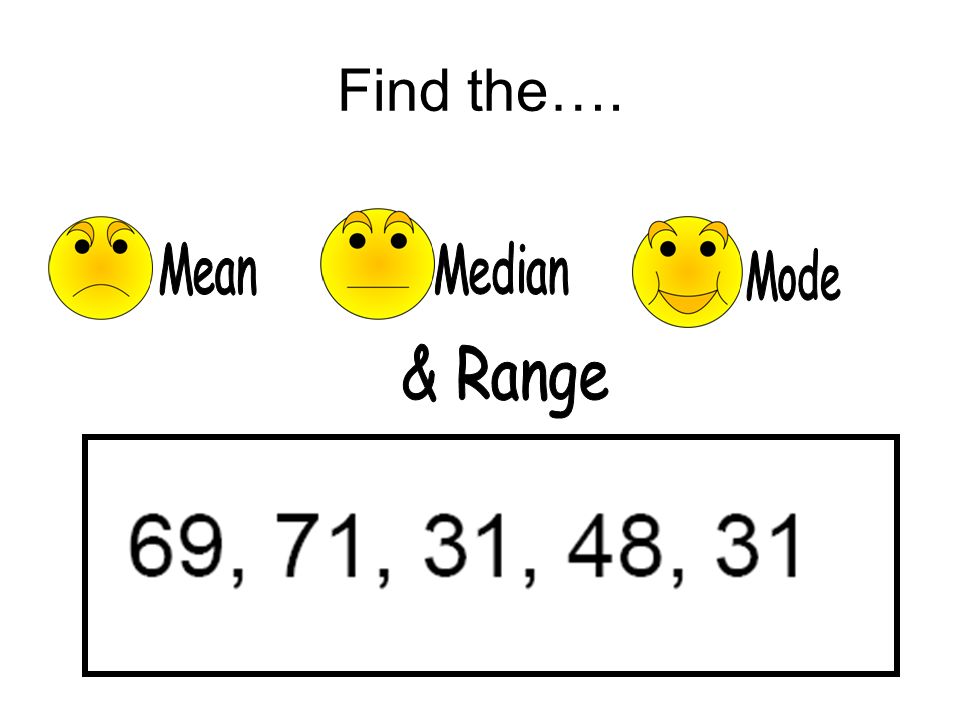
Find the….

Similar presentations