Download presentation
Presentation is loading. Please wait.

1
Flood Management Experiences in the United States January26, 2001 Santiago Chile by Jerome Delli Priscoli Ph.D.

2
What I Will Cover 1. Context and History 2. Current Situation and Trends 3. Institutional Coordination 4. Strategies for Food Plain Management 5. Aspects of Policy, Planning and Analytics 6. Overcoming Barriers and New Directions

3
Context Federal System: state, local –resistance to Federal interference –limited coordination on water Property rights –individualism –free market, private ownership Resistance to land use planning –Flood management must integrate land use Lingering culture of primary structural responses Tradition of helping the victims –reinforces discontinuity b/w assistance vs.mitigation, prevention

4
What is Flood Plain Management? …continuous decision making process that aims to achieve the wise use of the Nation’s flood plain lands and waters Simultaneously present, near future,long term Balancing of relative costs - benefits and best mix structural and non structural tools Reducing risk through loss reduction strategies and tools Wise Use: …activities compatible with natural and human (life and property)
.")
5
What is a Flood? Defining a Flood..100 year flood, 1% annual chance flood or base flood, a flood of size that has a 1% chance of being equaled or exceeded in any given year.(Properties beyond 1% flood area still at risk) Normal Channel Flow Base Flood Regulatory Flood Datum Regulatory Flood Datum Secondary Flood Hazard Area Secondary Flood Hazard Area (a) Primary Flood Hazard Area (a) Primary Flood Hazard Area Secondary Flood Hazard Area Secondary Flood Hazard Area Floodway Fringe Floodway Fringe Floodway Fringe Floodway Fringe Freeboard
 Normal Channel Flow Base Flood Regulatory Flood Datum Regulatory Flood Datum Secondary Flood Hazard Area Secondary Flood Hazard Area (a) Primary Flood Hazard Area (a) Primary Flood Hazard Area Secondary Flood Hazard Area Secondary Flood Hazard Area Floodway Fringe Floodway Fringe Floodway Fringe Floodway Fringe Freeboard.")
6
Principles of Flood Plain Management in US Major Federal interest but basic responsibility with sate and local governments See flood plains in context of total community, regional and national planning and management Flood loss reduction seen in larger context of flood plain management - not an objective in itself Resource management often focus on resource which may not be entirely in flood plain. Benefits and costs interrelated impacts Evaluation of alternative strategies

7
Principles of Flood Plain Management in the US Major Federal interest but basic responsibility with sate and local governments See flood plains in context of total community, regional and national planning and management Flood loss reduction seen in larger context of flood plain management - not an objective in itself Resource management often focus on resource which may not be entirely in flood plain. Benefits and costs interrelated impacts evaluation of alternative strategies

8
The Situation in the US Over 150,000 square miles (94 million acres) or 7% of country prone to floods Almost 10 million households and $390 billion in property are at risk today Rate of urban growth in flood plain twice the rest of country Average annual loss of life from floods stable Average annual flood losses rising Loss of natural flood storage continues But damages have increased in real dollars and disaster relief average $3 billion per year and uninsured losses are growing.
 or 7% of country prone to floods Almost 10 million households and $390 billion in property are at risk today Rate of urban growth in flood plain twice the rest of country Average annual loss of life from floods stable Average annual flood losses rising Loss of natural flood storage continues But damages have increased in real dollars and disaster relief average $3 billion per year and uninsured losses are growing.")
9
Situation (con.) Unprotected development in the 100 yr. plain and continued development just outside the 100 yr.. Plain. Those deciding to live and do business in flood plain not paying proportionate costs of the decisions Grants and other post flood assistance reduce incentives to take preventative measures. 20,000 communities in flood plains, 90% participate in NFIP but less then 20% of occupants buy insurance.

10
Trends Movements to coastal communities, adjacent to lakes and rivers Reduced ability to fund large capital measures those other measures such as codes, regulation increasing Rebalancing from structural to: local planning, regulations, zoning, multipurpose management NFIP a primary tool of management and increased litigation over local government failure to endorse flood plain ordinances New awareness on natural functions of wetlands and internalization of EQ values Balance between public and private rights shifting to: stronger pubic rights as pubic nuisances costs grow high Courts and legislatures evolving to reflect these concerns

11
Real Flood Damages 1903 - 1996 (Billions ‘95 $’s)
")
13
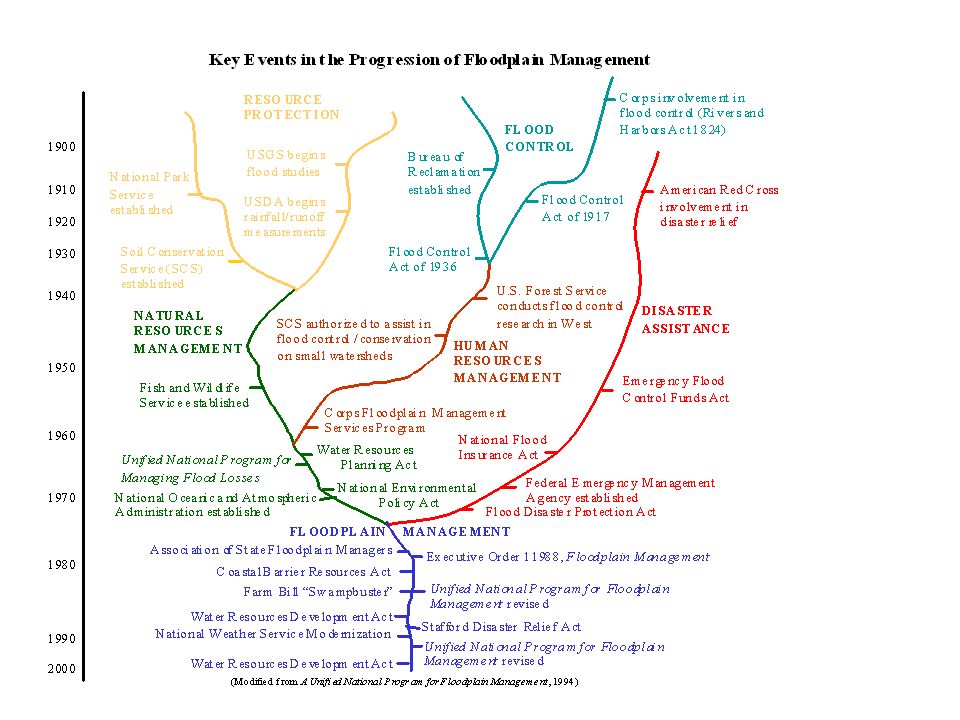
Flood Plain Management US 18th and early 20th century Local problem and small scale structures Mid 20th century Federal role and large structures Later 20 the century back to more local and movement to mix small and large and non structural Can track approaches in language we have used: –1800s flood prevention –early 1900s flood control –mid 1900s flood reduction –latter 1900s flood plain management

14
History Much of History written around the Lower Miss - Delta By 1727 Nouvelle Orleans protected by 4 ft embankment 1543 DeSoto noted: –Indians raised mounds by hand and built high where they could From 1823 Federal role in water emerges -mostly navigation related with continual debate about flood control role with floods in mid 1800’s to 1917 Debate in 1800s and early 1900s: –Ellet - mixed high levees, structure and outlets –Humphreys Corps of engineers -levees only –Humphreys wins out for 60 years until 1927 floods 1879 Miss river Commission Flood Control Act 1917: lower Miss - Sacramento river

15
History (con.) Flood Control Act of 1928: 1927 floods greatest disaster in US history 700,000 homeless, $250 million in losses –previous 200 yrs. locals spent $300 million in lower Miss –In single 1928 act Congress authorizes $325 million - the greatest % of budget for water projects ever in US! –Ellet view of structures comes back –Benefit cost ratio introduced –DOA to work upstream and the Corps down but no coordination mechanism put in place –Between 1936 -1952 spent $11 billion for flood control projects and storage: single and mutli- purpose –Idea was to build way out of the problem 1954 Watershed and Flood Prevention Act SCS of DOA 1940s to 1960’s Broadening views, U of Chicago,

16
History (con.) 1953 first first major test by TVA land use and flood control measures 1950’s, 60’s move for water resources coordination - WRC and River Basin Org.’s 1968 Flood Insurance Act 1976, 79, 86 and 94 National Program for Flood Plain Management revisions 1993 Upper Miss flood: Galloway Report and 1994 Revisions to President - 3 major recommendations; –Full consideration to all possible alternatives, evacuation, warning, proofing, natural and artificial storage –full weight to social economic and environmental values in analysis –more non structural: to reduce vulnerability through use of flood plain management activities and programs
 1953 first first major test by TVA land use and flood control measures 1950’s, 60’s move for water resources coordination - WRC and River Basin Org.’s 1968 Flood Insurance Act 1976, 79, 86 and 94 National Program for Flood Plain Management revisions 1993 Upper Miss flood: Galloway Report and 1994 Revisions to President - 3 major recommendations; –Full consideration to all possible alternatives, evacuation, warning, proofing, natural and artificial storage –full weight to social economic and environmental values in analysis –more non structural: to reduce vulnerability through use of flood plain management activities and programs")
17
Institutional Coordination Private Sector Local Communities States Federal Agencies Multiple actors: owners, businesses, officials at all levels, farmers developers, etc.

18
Resource Protection Flood Management in U.S. Disaster Assistance Red Cross

20
Federal Emergency Management Agency US Army Corps of Engineers Soil conservation Service National Weather Service US Geological Survey Housing and Urban Development Small Business Administration Environmental Protection Agency Department of Energy Forest Service Economic Development Commission Department of Transportation Pubic Health Service Bureau of Reclamation US Fish and Wildlife Service Bureau of Indian Affairs National Ocean Service National Park Service Large Number of Actors Involved: No WRC or formal coordinator Federal Agencies

21
Cost Sharing Today Evolves in Legis, of ‘36 ‘38, ‘41, ‘74, ‘86, ‘96 LERR & D needs identified: Value set and credited to non Fed contribution. Value of LERR & D and 5% cash added: if less then 35% extra cash paid: if more then 50% non Fed is reimbursed. Non Feds pay 50% of separable navigation and recreational costs assigned to project Non Feds provide all LERRD’s and perform all related necessary relocations

22
Strategies and Tools for Flood Plain Management Modify Human Susceptibility to Flood Damage and Disruption Modify the Impact of Flooding on Individual and the Community Modify Flooding Preserve and Restore the Natural Resources Regulations Increasing Focus on Non Structural Measures: –reduce or avoid flood damages without significant altering the nature or extent of flooding….

23
Strategies and Tools for Flood Plain Management Modify Human Susceptibility to Flood Damage and Disruption Modify the Impact of Flooding on Individual and the Community Modify Flooding Preserve and Restore the Natural Resources Regulations Increasing Focus Non Structural Measures: –reduce or avoid flood damages without significant altering the nature or extent of flooding….

24
Modify Human Susceptibility to Flood Damage and Disruption Flood Plain Regulations (Codes and zoning) Development and Redevelopment Policies Disaster Preparedness Disaster Assistance Flood Proofing, Flood Forecasting and Warning System and Emergency plans –Problems linking evacuation and warning Preservation of Natural Resources
 Development and Redevelopment Policies Disaster Preparedness Disaster Assistance Flood Proofing, Flood Forecasting and Warning System and Emergency plans –Problems linking evacuation and warning Preservation of Natural Resources")
25
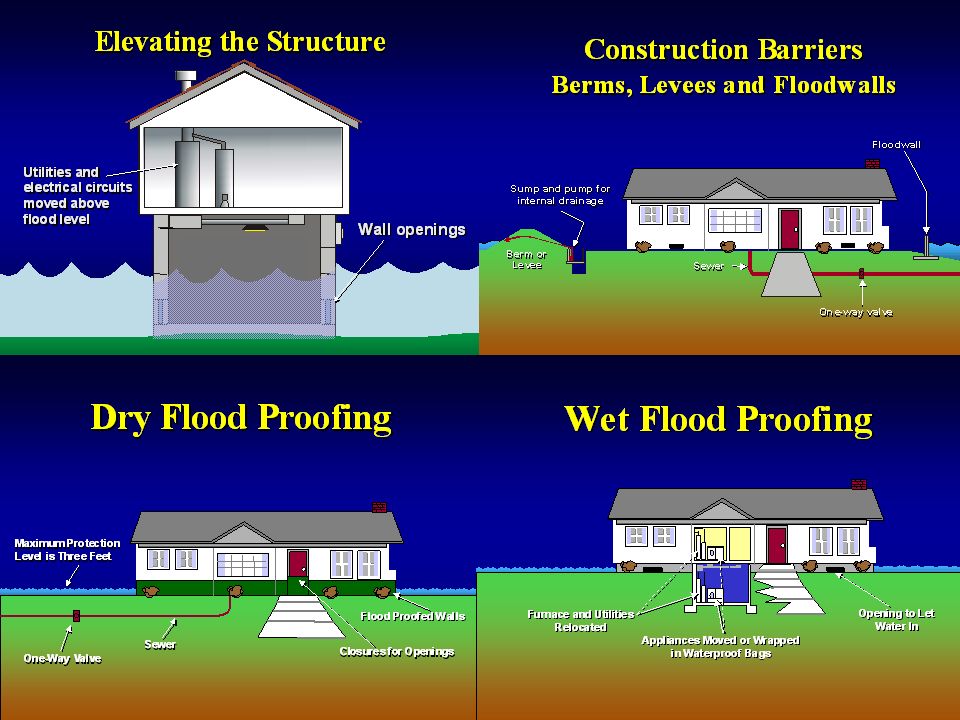
Flood Proofing Measures Elevation Relocation Barriers Dry Flood Proofing Wet Flood Proofing Buyout/Acquisition

27
Preserve and Restore Natural Resources and Functions of Flood Plains Floodplain, wetland, Coastal Barrier regulations –Federal, State, Local, Reg’s, Zoning Development and Redevelopment Policies –land acquisition and open space, relocation, restoration, habitat preservation, location of service utilities Information and Education Tax adjustments Administrative measures Beach Nourishment and Dune Building.

28
Modify Flooding Dams and Reservoirs Dikes, Levees and Flood walls Channel Alterations High Flow Diversions Land Treatment On site Detention Shoreline protection Special Grasses

29
Modify the Impact of flooding Information and education Flood Insurance Tax Adjustments Flood Emergency Measures Post Flood Recovery

30
Key Rules for NFIP No residential living area below 1% flood level No non-residential development subject to damage by 1% flood No rebuilding below 1% if damage 50% or more of structures value Moving to actuarially based premiums or adjust according to use of mitigation Insurance industry participation in WYO program to: bring expertise, spread coverage, improve service Measures must meet minimum FEMA and include: zoning, subdivisions, building requirements, special purpose ordinances, outreach, education, others

31
NFIP (con.) Replacement costs for residential single family and residential condos insured at 80% Some increased costs of compliance paid
 Replacement costs for residential single family and residential condos insured at 80% Some increased costs of compliance paid")
32
Policy, Planning and Analytic Approaches for Choosing Strategies and Tools Analytic Approaches BCA, Design Standards Hydrologic Analysis Planning Policy Principles and Guidance for Water Resources Planners 1983 Uniform NFPM Prg. ’ 76,’79,’86,’94 Exec Orders, Fed -State - Local Laws

33
Principles and Guidance (P & G): US Accounting System for Public Water Investments National Economic Development (NED) –beneficial and adverse effects on the national economy in monetary terms Environmental Quality (EQ) –effects of plans on significant environmental resources and ecological, cultural and esthetic attributes Regional Economic Development (RED) –distribution of regional economic activity from each plan in terms of regional income and employment Other Social Effects (OSE) –effects on urban and community impacts, life, health, safety factors; displacement, long term productivity; energy requirements and energy conservation
: US Accounting System for Public Water Investments National Economic Development (NED) –beneficial and adverse effects on the national economy in monetary terms Environmental Quality (EQ) –effects of plans on significant environmental resources and ecological, cultural and esthetic attributes Regional Economic Development (RED) –distribution of regional economic activity from each plan in terms of regional income and employment Other Social Effects (OSE) –effects on urban and community impacts, life, health, safety factors; displacement, long term productivity; energy requirements and energy conservation")
34
Some Project Level Policies Must look at without Project Condition Flood Plain Management: avoid its dev. and focus is on existing development Use risk based analytical framework; expected performance (no minimum) not levels of protection –can more small dams + more residual Reflect residual damages Mitigation of induced flooding Address minimum flow Evaluate EQ mitigation No projects for single properties Include steps of the NFIP: maps, etc.
 not levels of protection –can more small dams + more residual Reflect residual damages Mitigation of induced flooding Address minimum flow Evaluate EQ mitigation No projects for single properties Include steps of the NFIP: maps, etc..")
35
Benefits Calculations Urban –Inundation Reduction Benefits –Intensification Benefits –Location Benefits –Damages: Physical damages, Income loss, emergency costs Agriculture –Damage Reduction –Intensification –Reduction in damage costs; erosion, sedimentation, inadequate water supply –Value of increased production of crops –Economic efficiency of increasing production of crops NOT CREATING NEW FLOODWAY DEVELOPMENT Benefits cannot exceed the increased flood damage potential in comparing existing activity to the intensified/ changed activity

36
Delineate Affected Area Determine Flood plain Determine existing flood damages Estimate other flood related costs Estimate future flood damages Forecast activities in affected area Estimate potential land use Allocate land use Collect market value data Compute benefits Urban Flood Damage Benefit Evaluation

37
Agricultural Benefit Evaluation Procedure Identify land use - cropping pattern with and without plan For land where cropping pattern does not change with plan For land where cropping pattern changes with plan Determine damage reduction benefit Select method for intensification benefits Use farm budget analysis Use land value analysis Determine Total Crop Benefit

38
Problems/Analytical-Planning Impediments BCA does not account for EQ, Social and Distribution effects Project by project impedes systematic Poorest with most serious problems not participating Lower value of poor in flood plain provide less economic justification Exclude reduction in disaster recovery cost as benefit Does not include avoided damages as additional benefits Communities w/o vitality resist NSF

39
Comparison Flood Depths vs. Location Minn. vs. West Va.

40
Benefits of Non Structural Measures Flood Warning Preparedness Methods for Quantifying Benefits “Ad Hoc Method” Warning shifts stage-damage curve downward

41
Flood Warning Preparedness ( “Day Curve”) 0612182430364248 0 5 10 15 20 25 30 35 40 Reduction in Damages (%) Forecast Lead Time (in hours)
 Reduction in Damages (%) Forecast Lead Time (in hours)")
42
Policy Barriers to Non Structural Full accounting of EQ and non monetary social impacts on NSF is difficult Procedures used for BCR are based on certain assumptions that limit non-structural Emergency flood relief and recovery payments by Government (FEMA) create incentives against non structural FPM not being pursued in comprehensive fashion at all levels of government Those who live and work in flood zones not paying proportional cost of the decisions National policy on disaster response and assistance not aligned to management: actually still creating incentives for locating in flood plain.
 create incentives against non structural FPM not being pursued in comprehensive fashion at all levels of government Those who live and work in flood zones not paying proportional cost of the decisions National policy on disaster response and assistance not aligned to management: actually still creating incentives for locating in flood plain.")
43
Analytical Barriers to NSFC Analytical: Benefit Cost Analysis BCA –Assess aggregate and blind to distribution –Perfect market conditions assumed –Dealing with non-monetized impacts –based on economic return thus may encourage investments in high risk areas Policy: Principles and Guidance P & G and Policy –NED maximization rule biased against EQ -Social Accounts –Bias against broader non traditional benefits of NSF –System not set up to recognize least cost alternative which may not be the best BCR –Issue for Treasury is cash flow and policy does focus on minimizing tomorrow's losses

44
Overcoming Barriers: Policy Directions Sustainability Nonstructural Structural Agricultural Policies Coastal Data and Technology Risk Repetitive Losses Property Rights.

45
Sustainability Move toward likely future conditions to make risk analysis more realistic Including disaster resiliency in community planning: e.g. -FC measures flood resistant construction storm water management - Community zoning subdivision regulations

46
Increase Use of Non structural Measures Buyouts (1993 flooding) Elevating buildings Buffer zones and Levee set backs Keep vacated land in pubic ownership Seeking permanent authority for NSFC National riparian zone policy Natural storage capacity Building codes - International building code
 Elevating buildings Buffer zones and Levee set backs Keep vacated land in pubic ownership Seeking permanent authority for NSFC National riparian zone policy Natural storage capacity Building codes - International building code")
47
Increase Use of Non structural Measures New construction 1 - 3 feet of freeboard above base flood elevation Use confidence levels (90% -95%) for flood peak flows predictions No rise flood ways with no surface and velocity impacts Record waivers and disallow flood disaster assistance
 for flood peak flows predictions No rise flood ways with no surface and velocity impacts Record waivers and disallow flood disaster assistance")
48
Structural Must integrate structures and NSFC measures in planning Use water shed or basin wide approach Estimate useful life of existing FC structures and dam safety –200 failures in last 10yrs –9,200 categorized as high hazard –35% not inspected since 1990 –Rehab estimate = over $1 billion New structures should be built to protect beyond the 1% to the 0.2% chance flood - avoid catastrophic floods Include failure zones of structures on flood hazard maps Increase incentives for dam safety program in states

49
Agricultural Policies Crop losses often exceed urban losses: 1/2 all losses Examine prevalence of repeat areas of losses Need voluntary permanent Easements programs- deny subsidies-disaster payments if refuse Buffer zones: - Conservation Reserve- 150+ ft. Levees; stop rebuilding where cost is greater then land value - reduce Federal subsidy of 80% of costs Construct levees so no impact on height of 1% flood Crop insurance programs can encourage plant in flood plains: 1999 payments largest in US history at $28 billion-they guarantee 50% of average yield 60%-65% of all losses paid in 1998

50
Coastal Existing polices foster rather then discourage construction on coasts despite 1982 Barriers act NFIP not working for coastal areas, need: –integrate coastal areas into NFIP –surcharge on areas subject to erosion –setback requirements Shoreline erosion: shift from jetties, sea walls to beach nourishment –expensive and need better cost sharing –consider setbacks and acquisition strategies –increase pubic access to improved beaches

51
Data and Technology No one entity has responsibility for collecting and storing data about floods, defining floods, or damage!! # of structures in flood hazard zone not known; need data on repetitive loss structures FEMA Improving methods for estimating flood damage Stream gauge network is shrinking New modeling that include unsteady flow conditions, levee breaches, split flows and unstable land forms a debris flow being developed. Design manuals updated to include alternatives to structures and bioengineering.

52
Risk Need to improve risk communication: –100 yr. becomes 1% or high risk flood –500 yr. becomes 0.2% or moderate risk flood Movement to risk based may mean more structures and away from design to a minimum standard and more structures will be built and increased exposure. Structures at 1% flood risk has 25% chance of being flooded during its 30 yr. Mortgagee: a 1% chance that same structure will have a fire - yet almost all have fire insurance and less then 25% have flood insurance. Residual risk below structures: Maps need to keep failure zones after structures in place

53
Risk - Perceptions Key to all is linking risk with behavior: active choice/acceptance of risk versus passive being taken care of Engineers argued people felt more secure if see high levee or if see high earth dams versus stronger thin shell concrete Risk perception: People living on St. Andraes fault cannot understand how people can live in the Delta exposed to risk: Those in delta cannot understand those living on the fault line!

54
Property Rights Willing seller scenarios is basis –key is partnership among levels of gov.and people (eg. Charles River in 1970s) Denial to rebuild as abridgment of rights –eligibility criteria exists Restriction on right to flood fight as abridgment –subject to state and community reg.’s –subject to liability of impacts on others National EQ programs as taking –eg. Wetland permitting
 Denial to rebuild as abridgment of rights –eligibility criteria exists Restriction on right to flood fight as abridgment –subject to state and community reg.’s –subject to liability of impacts on others National EQ programs as taking –eg. Wetland permitting.")
55
Conclusions Flood Management is Complex We have much experience but still trying We have moved from fear to control to prevention to management and working with the floods Structures and non structures must work together. Changing behavior is critical. Movement to: Active acceptance of risk and responsibility vs. passive paternalism The civic culture and civic infrastructure come together in flood management: a learning ground for building Democratic civic culture.

56
Lessons for GWP Flood management important part of IWRM - optimal use but brings complexity –links land to water: upstream to downstream –is a public good (eg.defense) thus offers additional revenue sources for IWRM projects –help negotiating benefits vs. allocating flows Need to link post event reaction policy to anticipation, damage prevention and mitigation policies Hard to get benefits to poor if BC analysis is based on property values Critical issue is risk and culture changes –communicating risk and reacting to warnings –active choosing risk versus passive acceptance links to governance: building civic culture and democracy –From paternalism to informed consent

57
The Best Flood Proofing Measure … Don’t Build in an Area that Floods. The Best Flood Proofing Measure … Don’t Build in an Area that Floods.

Similar presentations


 May.>")


 Understanding Advisory Information and the Implications for Your Home December 2012.>")


