Download presentation
Presentation is loading. Please wait.

1
An Overview of CCSSM- oriented Core Math Tools

2
Goals for the Session Overview of Core Math Tools CAS Spreadsheet Synthetic Geometry Coordinate Geometry Data Analysis & Probability Simulation Mini-Lesson using Core Tools

3
Genesis of Core Math Tools In spite of the considerable promise that computer technology provides for the improvement of school mathematics and student learning, the fulfillment of that promise has been stymied by issues of finance, access, and equity, among others. Heid 1997, 2005

4
Common Core State Standards for Mathematics Mathematical Practice: Use appropriate tools strategically. Mathematically proficient students consider the available tools when solving a mathematical problem. These tools might include pencil and paper, concrete models, a ruler, a protractor, a calculator, a spreadsheet, a computer algebra system, a statistical package, or dynamic geometry software. Proficient students are sufficiently familiar with tools appropriate for their grade or course to make sound decisions about when each of these tools might be helpful.... They are able to use these tools to explore and deepen their understanding of concepts. Common Core State Standards for Mathematics 2010, p. 7

5
Translating the CCSSM into practice will require “meaningful curriculum organizations that are problem-based, informed by international models, connected, consistent, coherent, and focused on both content and mathematical practices. These new models should exploit the capabilities of emerging digital technologies … with due attention to equity.” Confrey & Krupa A Summary Report from the Conference “Curriculum Design, Development, and Implementation in an Era of Common Core State Standards,” 2010

6
Parent-Teen Cell Phone Survey, September 2009 Pew Internet & American Life Project 95% of youth aged 14–17 are online; 92% of families have a computer at home; 93% of teens use a desktop or laptop; and 76% report having high-speed Internet access. Access and Equity

8
Core Math Tools Use Use by Teachers and Students: Core Math Tools can be saved on computers and USB drives, making it possible to use them without internet access. Files can be saved and reloaded by students and teachers. Its portability allows easy access for students, teachers and parents outside the classroom. Core Math Tools will automatically check for updates when launched and Internet access is available.

10
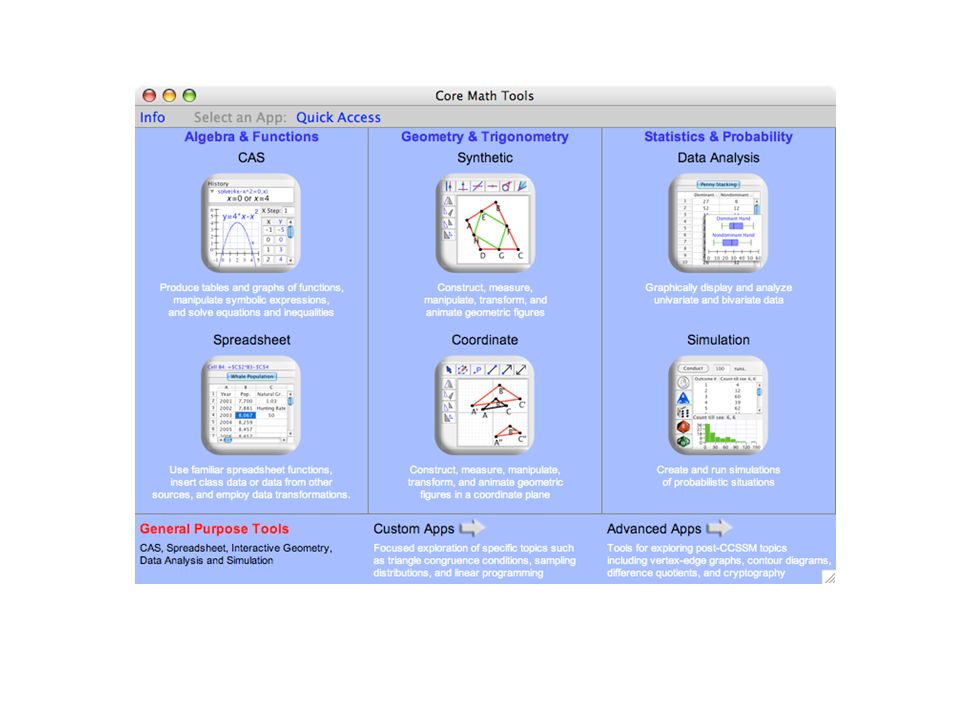
Three Families of Software Algebra & Functions—The software for work on algebra problems includes an electronic spreadsheet and a computer algebra system (CAS) that produces tables and graphs of functions, manipulates algebraic expressions, and solves equations and inequalities.
 that produces tables and graphs of functions, manipulates algebraic expressions, and solves equations and inequalities.")
11
Algebra tools include an electronic spreadsheet and a computer algebra system (CAS) that produces tables and graphs of functions, manipulates algebraic expressions, and solves equations and inequalities;
 that produces tables and graphs of functions, manipulates algebraic expressions, and solves equations and inequalities;")
12
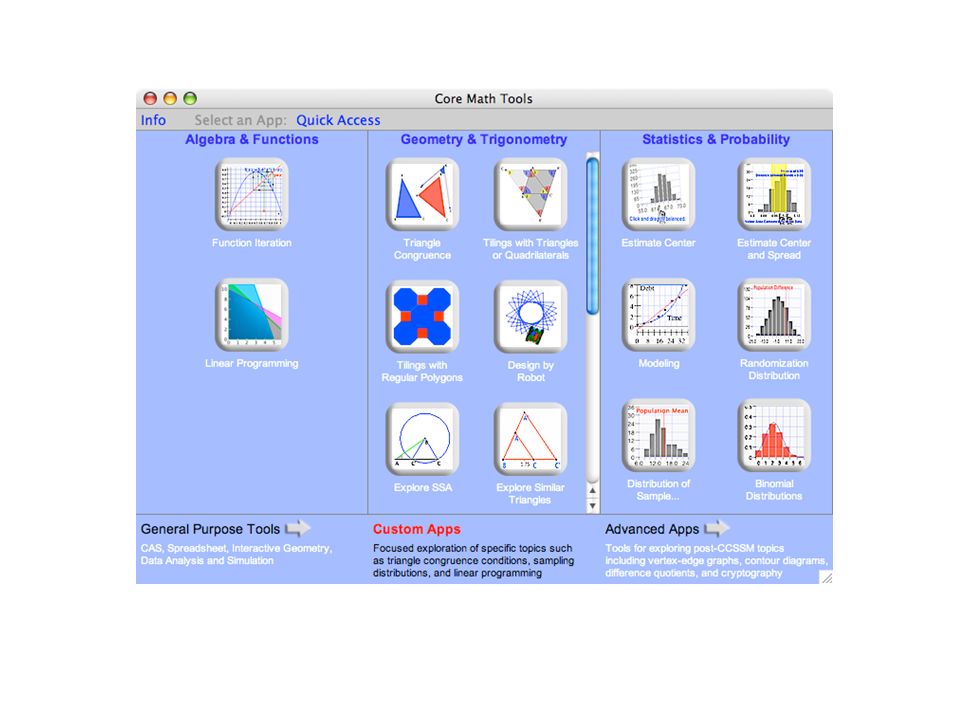
and custom apps supporting mathematical modeling.

13
Geometry & Trigonometry—The software for work on geometry problems includes an interactive drawing program for constructing, measuring, and manipulating geometric figures and a set of custom apps for exploring properties of two- and three-dimensional figures.

14
Geometry tools include an interactive drawing tool for constructing, measuring, manipulating, and transforming geometric figures, a simple object- oriented programming language for creating animation effects,

15
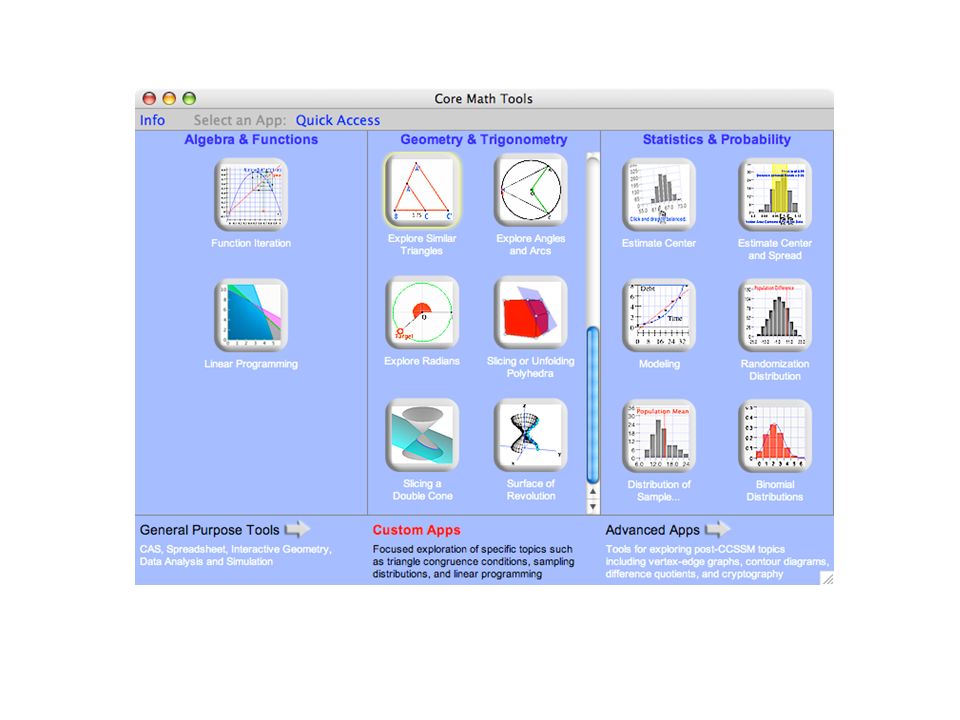
and custom apps for studying geometric models of contextual situations, physical mechanisms, tessellations, and special shapes.

16
Statistics & Probability—The software for work on data analysis and probability problems provides tools for graphic display and analysis of data, simulation of probabilistic situations, and mathematical modeling of quantitative relationships.

17
Statistics tools include tools for graphic display and analysis of univariate and bivariate data, simulation of probabilistic situations

18
and mathematical modeling of quantitative relationships. Spreadsheets allow easy insert of class data or data available from other sources. CMT includes pre-loaded data sets for developing key statistical ideas.

23
Overview of CAS

24
Algebra Tools

25
Graphing

26
Points of Intersection

27
Trig Functions

28
Overview of Spreadsheet App

29
Graph of Population Growth Model

30
Overview of Synthetic Geometry

31
Circumcenter of a Circle

32
Coordinate Geometry

33
Simulation Tool

34
Simulation

35
Example Aaron Rodgers – QB for Green Bay Packers completes about 65% of passes that he throws. Suppose he makes 10 passes in a game. Estimate the probability that he completes at least 7 of the 10 passes.

36
Custom Event Editor

37
Count number of successes

38
Conduct the Simulation

39
Repeat a large number of times

40
Donating Blood In the United States, approximately 10% of the population has type B blood. On a certain day, a blood center needs 1 donor with type B blood. How many donors, on average, should they have to see in order to obtain exactly 1 with type A blood?

41
Setting Up the Simulation

42
One Trial

43
Summary of 101 trials

44
Fire Alarms Simulation From Navigating Through Probability 9-12 (NCTM) A local high school installed 3 fire alarms in the cafeteria. Each alarm is estimated to sound the alarm for a fire 75% of the time. What is the probability that at least one of the alarms will go off if a fire starts in the cafeteria?

45
Build Custom Event

46
Conduct trials

47
Data Analysis tool

48
Analyzing Bivariate Data Health and Nutrition The data in the table show how average daily food supply (in calories) is related to life expectancy (in years) and infant mortality rates (in deaths per 1,000 births) in a sample of countries in the western hemisphere. (Source: World Health Organization Global Health Observatory Data Repository; www.populstat.info/Americas)

49
Relationship between daily calories and Life expectancy

50
Scatterplot

51
Moveable Line show residuals and squares

52
Least Squares Regression Line

53
Residual Plot

54
Plot Summary

55
Another Model

56
Investigation: Memorizing Words From Focus in High School Mathematics Reasoning and Sense Making (NCTM)
")
57
Student Experiment A ninth-grade class of thirty students was randomly divided into two groups of fifteen students. One group was asked to memorize the list of meaningful words; the other group was asked to memorize the list of nonsense words. The number of words correctly recalled by each student was tabulated, and the resulting data are as follows:

58
Results from a Grade 9 Class Number of meaningful words recalled: 12, 15, 12, 12, 10, 3, 7, 11, 9, 14, 9, 10, 9, 5, 13 Number of nonsense words recalled: 4, 6, 6, 5, 7, 5, 4, 7, 9, 10, 4, 8, 7, 3, 2

59
Analyze the Data Enter data into Column A and B. Find the five number summary, mean, and standard deviation for both lists of data. Construct parallel box plots On the basis of the summary statistics and the display, what observations can be made regarding how the students assigned the meaningful words performed compared with how the students assigned the nonsense words performed?

60
Descriptive Statistics

61
Summary Statistics

62
Parallel Box Plots

63
7 th grade CCSSM 7.SP.3. Informally assess the degree of visual overlap of two numerical data distributions with similar variabilities, measuring the difference between the centers by expressing it as a multiple of a measure of variability.

64
Calculate the Interquartile range (IQR) for both sets of data. How many IQR’s are the medians separate by? Do you think this is a significant spread?

65
Going Beyond an Informal Approach

66
CCSSM High School S-IC-5. Use data from a randomized experiment to compare two treatments; use simulations to decide if differences between parameters are significant.

67
Going beyond an informal approach Question: Is the difference between the means a significant difference?

68
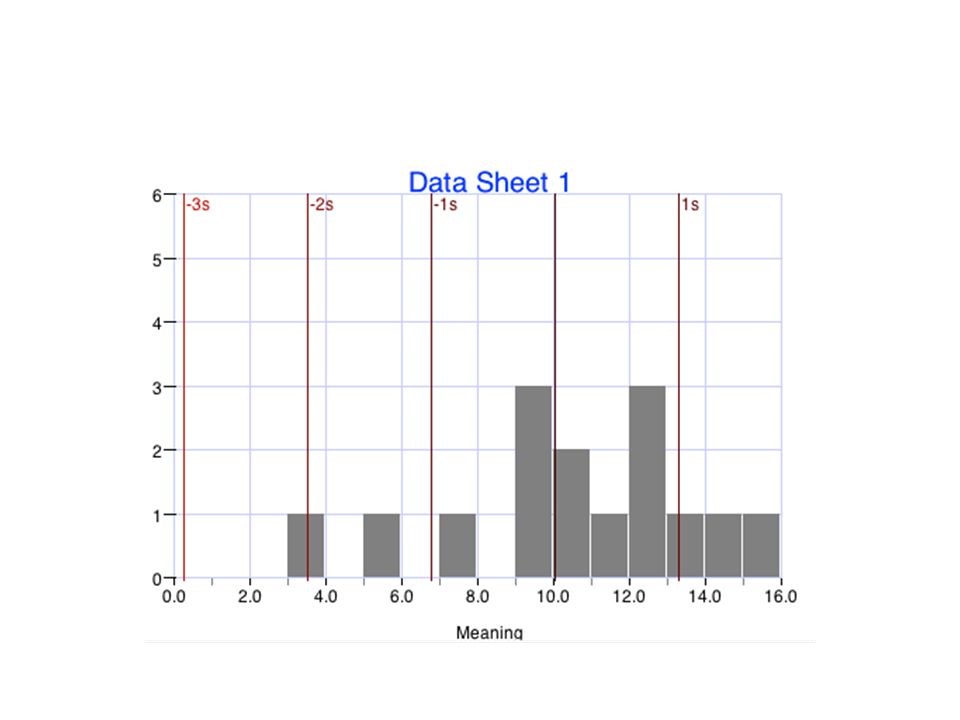
Visually See the Difference Construct a histogram of each list of data. Make a sketch of your histogram and mark the mean and one standard deviation above and below the mean on the histogram.

71
The two means differ by 4.27 words. They are 1.3 standard deviations apart. Question: Is this a significant difference?

72
Randomization Test

73
Set-up for the experiment Assumption: Assume there is no difference between the mean number of meaningful words and the mean number of nonsense words. This would mean that the spelling list a person received had nothing to do with how many words they were able to memorize. If a person memorized 5 words from the meaningful list that person would have memorized 5 words from the nonsense list.

74
Question is: How often would we see a difference in the means as large or larger than 4.27 words assuming the list don’t matter? How likely is it to see a difference of 4.27 or more purely by chance? If the probability of seeing a difference of 4.27 is high then this would not be a significant difference.

75
Shuffle the 30 cards together and then “deal” the cards into two piles of 15 cards. Designate one pile A (meaningful) and the other B (nonsense)
 and the other B (nonsense).")
76
Enter the scores written on the cards from pile A into Column C. Enter the scores written on the cards from pile B into Column D Find the mean of each list and then find the difference in the means (mean of A – mean of B) Report the difference between the means. Repeat this procedure many more times.
 Report the difference between the means. Repeat this procedure many more times..")
77
Randomization Test Core Math Tools Using Core Math Tools to run this simulation that we did with the cards a large number of times.

78
Setup of Randomization Test

79
Results

80
Analyzing the Differences Describe the histogram –What do the values represent? –Where do the values center? –Does this value make sense? Where does the value of 4.27 words (actual difference) fall in this distribution? Is this difference likely to have happened by chance? What conclusions can we draw?
 fall in this distribution. Is this difference likely to have happened by chance. What conclusions can we draw .")
81
Core Math Tools Download today at: www.nctm.org/coremathtools

Similar presentations


>")


