Download presentation
Presentation is loading. Please wait.

1
CHARLS – Introduction and Health- SES Associations Among the Elderly Yaohui Zhao, Peking University Xiaoyan Lei, Peking University Albert Park, Oxford University Yan Shen, Peking University Jim Smith, RAND Corporation John Strauss, University of Southern California July 2009 Alex Yang provided excellent research assistance

2
Significance of CHARLS China is one of the most rapidly aging countries in the world Economy is rapidly growing from a low level, so elderly in China face different challenges and opportunities than elderly in higher income countries China is in the process of transition from planned to market economy, so part of the transition is to replace the old public social safety nets

3
Health and Nutrition Transitions Nutrition: from under-nutrition and malnutrition to over-nutrition Health: from infectious to chronic diseases Implications: –Chronic diseases affect elderly more –Unawareness of chronic illness by individuals –The public health system is designed to handle infectious diseases and not chronic diseases –Low health insurance coverage on chronic diseases New Rural Cooperative Medical Insurance Urban Resident Health Insurance –Low incomes: inadequate resources to handle the expensive treatment of chronic illnesses

4
Financial and Personal Care Needs Public pension coverage is low Personal saving undependable Number of children is decreasing Rural elderly work to support self

5
Aims of CHARLS Provide a high quality HRS-type data for behavioural and policy research Harmonize survey instruments with other HRS- type surveys to enable cross-country comparative studies

6
Research Design and Methods Biennial survey representative of the residents of China aged 45 and older –Age 45 is the early retirement age We interview one household member aged 45 and older and their spouse We will track the individuals in follow-up surveys to form a panel Institutional residents excluded but can show up in later waves Pilot in 2008, national baseline 2011

7
PILOT Pilot in 2 provinces-Zhejiang and Gansu –Dynamic coastal province and inland low income province

8
Funding National Institute of Aging –R21-AG031372 –R21-AG033675 –R13-AG030312 World Bank, China grant 7145915 National Natural Science Foundation of China, grant 70773002

9
Sampling Design Multi-stage: counties, villages, household, persons Stratification: by province, regions and urban/rural Principal sampling units (PSUs) are village-level units –administrative villages in rural areas –communities ( 社区 ) or residence committees ( 居委会 ) in urban areas
 are village-level units –administrative villages in rural areas –communities ( 社区 ) or residence committees ( 居委会 ) in urban areas")
10
Sampling Procedures 1.Within each province, randomly select 16 county level units using PPS, stratified by regions and urban/rural 2.Within each county, randomly select 3 village-level units using PPS (village-level units include administrative villages in rural areas and neighborhoods ( 社区 ) or residence committees ( 居委会 ) in urban areas 3.Within each PSU, randomly select 25-36 from a complete list of dwelling units generated from a map 4.Within each chosen dwelling unit, determine the number of age- eligible households. If more than one, randomly select one age- eligible household. 5.In sampled age-eligible households, randomly select one age- eligible person and also interview spouse.

13
Questionnaire Cover screen Demographics Family structure/transfer Health status and functioning Biomarkers Health care and insurance Work, retirement and pension Income and consumption Assets (individual and household) Community level information
 Community level information")
14
Sections of Survey Instrument (0) Cover screen (determine household membership, age eligibility and respondents) –Basic Information (sex, age, relationship, marital status) about household members (a) Demographics (respondent and spouse): –Birth place –Migration and registration history –Education –Marriage history –Simple questions about spouse if divorced or widowed (birth year, education, year of divorce or death, cause of death)
 Cover screen (determine household membership, age eligibility and respondents) –Basic Information (sex, age, relationship, marital status) about household members (a) Demographics (respondent and spouse): –Birth place –Migration and registration history –Education –Marriage history –Simple questions about spouse if divorced or widowed (birth year, education, year of divorce or death, cause of death)")
15
(b) Family Structure/Transfer Additional information on household members other than respondent and spouse: education, registration, migration For parents and children, more details: –Biological or not; birth place –Year and cause of death if deceased –If living, current & past work, place of residence –Number of children of each child –Whether child lived away from parents during childhood Simple questions on siblings: number living, no. died after age 10 Living arrangement of parents Contact with each parent and child: how often do you/they visit Financial and time transfers with non-cohabitating parents and each child

16
(c) Health Status and Functioning General health now and before age 16 Doctor diagnoses of chronic illnesses –Are you receiving treatment? Accidents, falls, prostate, vision, hearing, teeth Lifestyle and health behaviours: sleep, physical activities, social activities, smoking, drinking Subjective expectation of mortality ADLs, IADLs

17
(c) Health Status-2 Cognition tests: calendar, season recognition, memory, numeracy, drawing Depression- short CES/D Health vignettes
 Health Status-2 Cognition tests: calendar, season recognition, memory, numeracy, drawing Depression- short CES/D Health vignettes")
18
Biomarkers Anthropometric measurements: –height, weight, waist circumference, lower right leg length and arm length (shoulder to wrist) Lung capacity, grip strength, timed sit and stand, hypertension Dried blood spots as part of a sister survey of CHARLS-to be analyzed for: –C-reactive protein, hemoglobin, total and HDL cholesterol
 Lung capacity, grip strength, timed sit and stand, hypertension Dried blood spots as part of a sister survey of CHARLS-to be analyzed for: –C-reactive protein, hemoglobin, total and HDL cholesterol")
19
(d) Health Care and Insurance Health insurance coverage –Present insurance (type, location of issuance, premium and reimbursement details) –Past insurance if currently not covered Health cost and utilization –Outpatient care Number in the past month For the most recent visit, type of facility, distance, location, cost of transportation, disease name, treatment, cost and insurance coverage –Inpatient care in the past year
 Health Care and Insurance Health insurance coverage –Present insurance (type, location of issuance, premium and reimbursement details) –Past insurance if currently not covered Health cost and utilization –Outpatient care Number in the past month For the most recent visit, type of facility, distance, location, cost of transportation, disease name, treatment, cost and insurance coverage –Inpatient care in the past year")
20
(e) Work, Retirement and Pension Work status Work history; whether or not processed retirement Earnings and labor supply for both employed and self-employed Job search and last job information for currently not working Detailed questions on retirement, pensions, social security and job-related health insurance Circumstances at the time retirement was processed
 Work, Retirement and Pension Work status Work history; whether or not processed retirement Earnings and labor supply for both employed and self-employed Job search and last job information for currently not working Detailed questions on retirement, pensions, social security and job-related health insurance Circumstances at the time retirement was processed")
21
(f) Income, Expenditure and Assets Household income –Incomes of household members other than R and spouse if he/she worked independently –Household agricultural income –Household nonfarm business income –Household public transfer income Household expenditure: week, month, year Household assets –Housing (value, mortgage, windfall gain from housing reform, characteristics [telephone, internet, cooking and heating fuel]) –Land; productive equipments, value of household consumer durables –Financial assets; debts Individual income and assets belonging to R and spouse Inheritance history
![(f) Income, Expenditure and Assets Household income –Incomes of household members other than R and spouse if he/she worked independently –Household agricultural income –Household nonfarm business income –Household public transfer income Household expenditure: week, month, year Household assets –Housing (value, mortgage, windfall gain from housing reform, characteristics [telephone, internet, cooking and heating fuel]) –Land; productive equipments, value of household consumer durables –Financial assets; debts Individual income and assets belonging to R and spouse Inheritance history](http://images.slideplayer.com/23/6648136/slides/slide_21.jpg "(f) Income, Expenditure and Assets Household income –Incomes of household members other than R and spouse if he/she worked independently –Household agricultural income –Household nonfarm business income –Household public transfer income Household expenditure: week, month, year Household assets –Housing (value, mortgage, windfall gain from housing reform, characteristics [telephone, internet, cooking and heating fuel]) –Land; productive equipments, value of household consumer durables –Financial assets; debts Individual income and assets belonging to R and spouse Inheritance history")
22
Community Survey Instruments Basic information –Land policy in village Infrastructure and utilities –Road access, distance to hospital, schools, bank, market, bus and train stations, communal elderly care facility, and other public facilities –Source of water, fuel –Sewage, electricity, %households with telephone, TV, refrigerator Labor, education and out-migration Health facilities: characteristics, distance Health insurance: coverage, policy details Community wage level Community leaders: education, years of service Facilities for the old people to exercise and socialize: availability and source of funding History of policy change, natural disasters or epidemics Price levels: food, fuel, electricity, housing Statistics: population, in-migration, finance

23
The Plan for Future CHARLS National baseline survey in 2011 About 10,000 households, 15,000 individuals to be surveyed in some 212 counties County sample sizes proportionate to population Follow up every two years

24
Health Status-SES gradients Health Outcomes –General health –BMI –Hypertension and under-diagnosis –ADLs & IADLs –CES-D –Survival expectations SES –Education –PCE –Rural vs. urban and Province

25
Health status-SES gradients In this analysis is not causal Can show health status differentials by SES

26
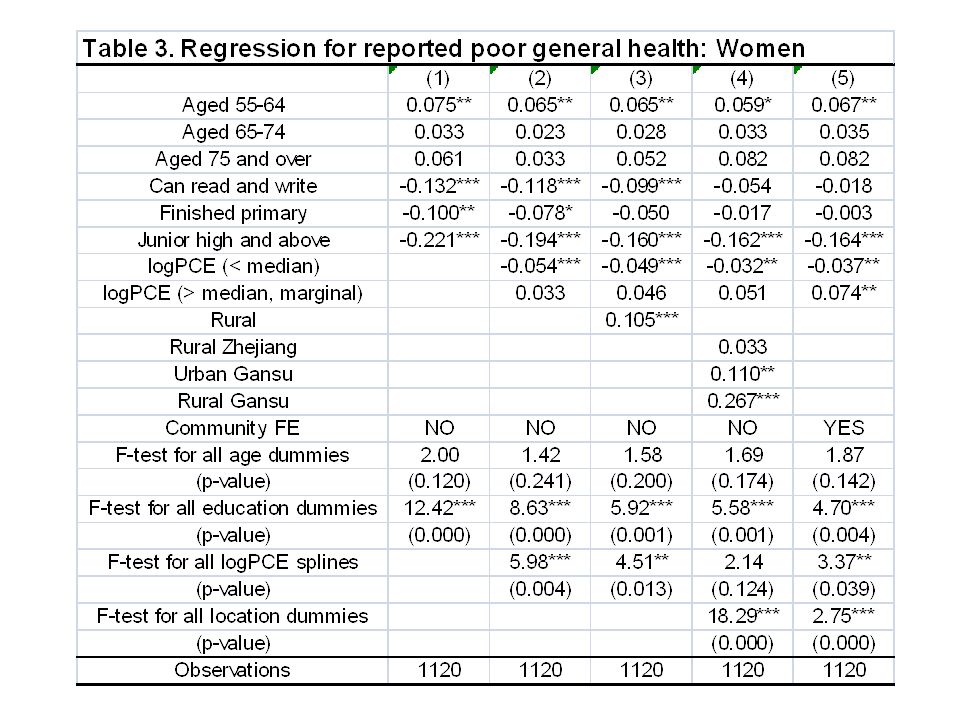
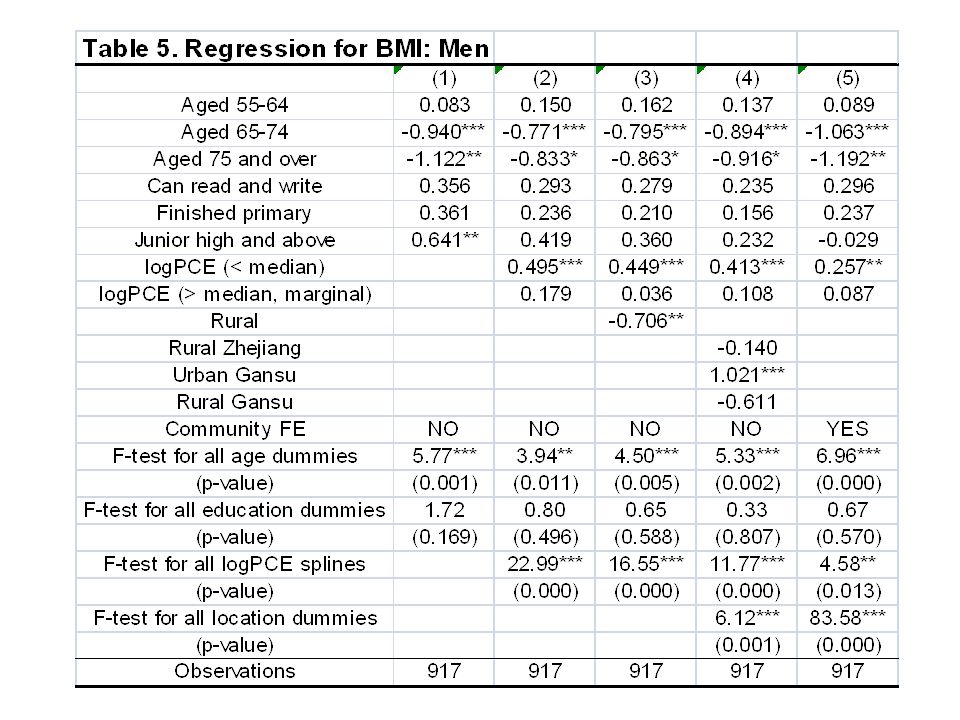
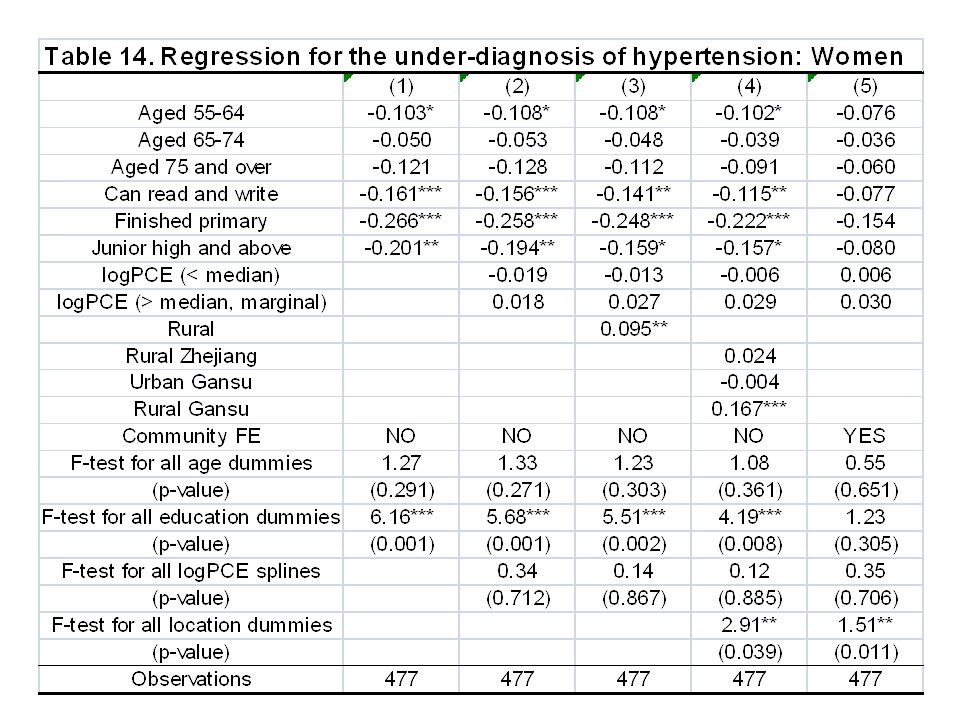
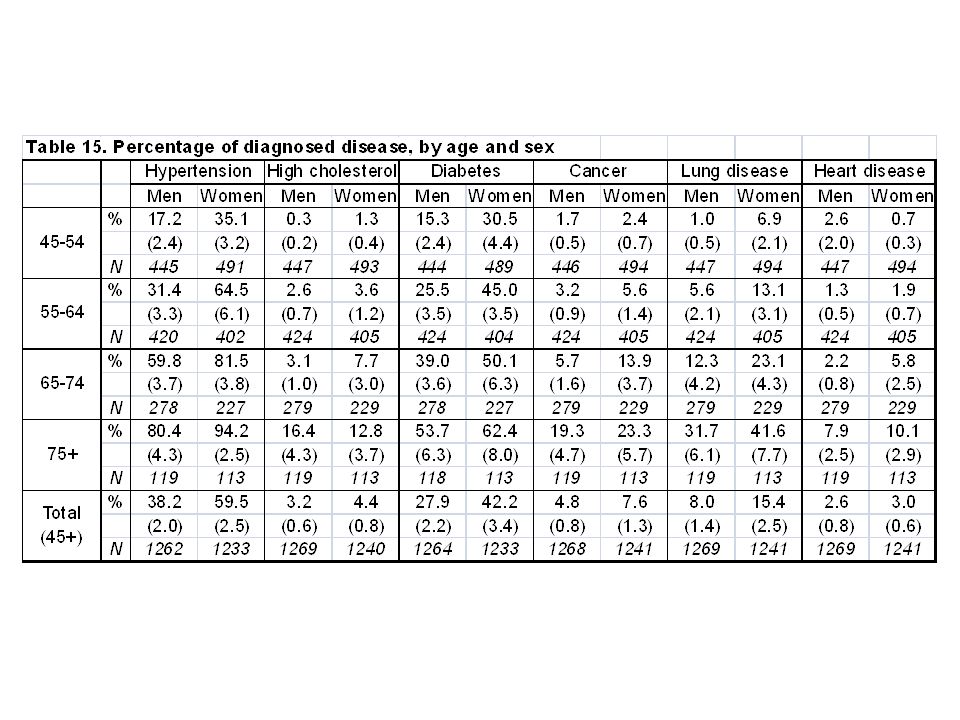
Summary of results Results show that education tends to be more important than percapita expenditure Some outcomes: hypertension-invariant to SES Others: General health, IADLs, CES-D, survival expectations, strongly related in expected ways- better health positively correlated with higher schooling Others: Underdiagnosis of hypertension, BMI, related for women, but not men

27
Critical importance of region/community As provincial rural/urban and then community dummies are added SES sometimes loses significance and coefficients go towards zero- especially so for PCE Even when SES not significant, community dummies are-hypertension for example Demonstrates the critical importance of location- location coefficients are jointly statistically significant

28
Regional differences Regional differences found to be critical for almost all health outcomes examined, except for hypertension People who live in Gansu province have worse health outcomes, even AFTER controlling for schooling, income and age differences! –For men urban and rural Gansu roughly same –For women, rural Gansu worse

34
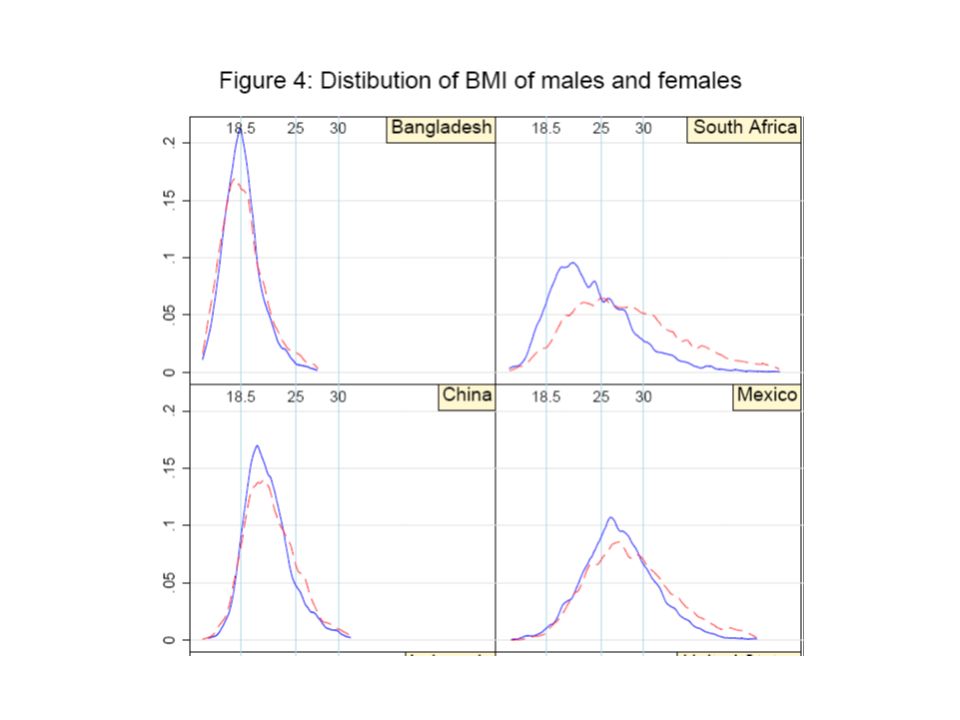
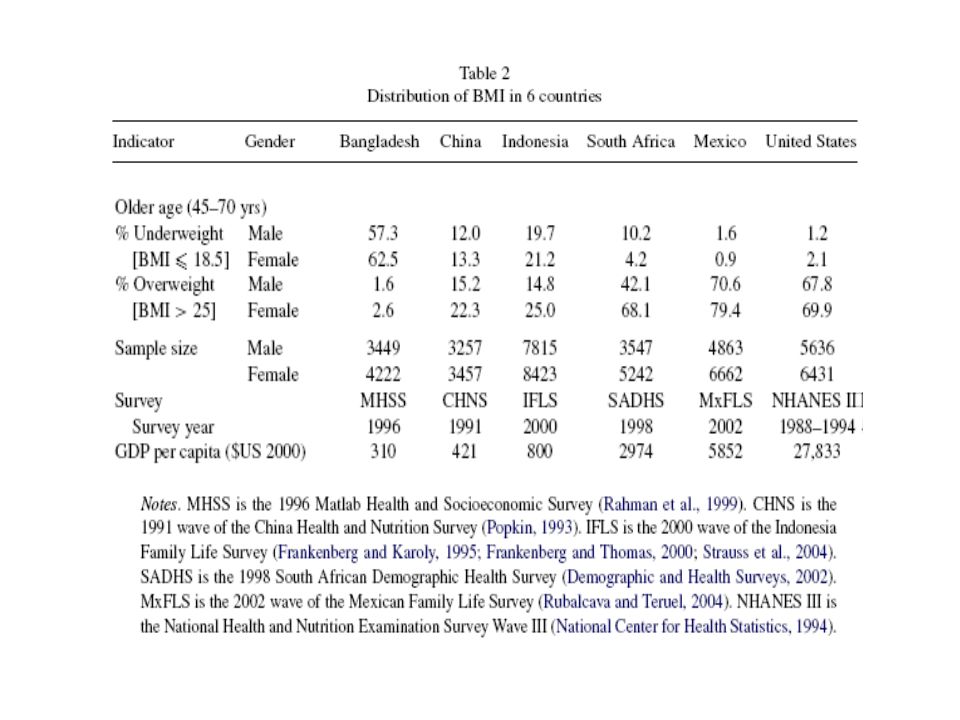
Country BMI differentials We know BMI distribution within countries shifts over time during health-nutrition transtion Figures from Strauss and Thomas, 2008 demonstrate from country cross-section What is less known is the education gradient of BMI also shifts –Becomes inverted u-shape from upwards sloping, for women, but not for men –CHARLS data duplicates

49
Hypertension and Underdiagnosis No SES results for hypertension –Same as Indonesia However, not so for hypertension underdiagnoses, especially for women

61
ADLs-IADLs ADLs have some SES gradient, but IADLs have strong SES gradient

73
Strong CES-D differentials with SES Especially for women Same as Indonesia

76
Survival expectations Survival expectations asked similar to HRS Have problem that depending on age, are asked about survival to different ages We use 2 approaches: –First, we standardize each answer by mean answer given by all who are asked about same survival age as respondent –Second, we use only respondents under 65, all of whom are asked about survival to 75

86
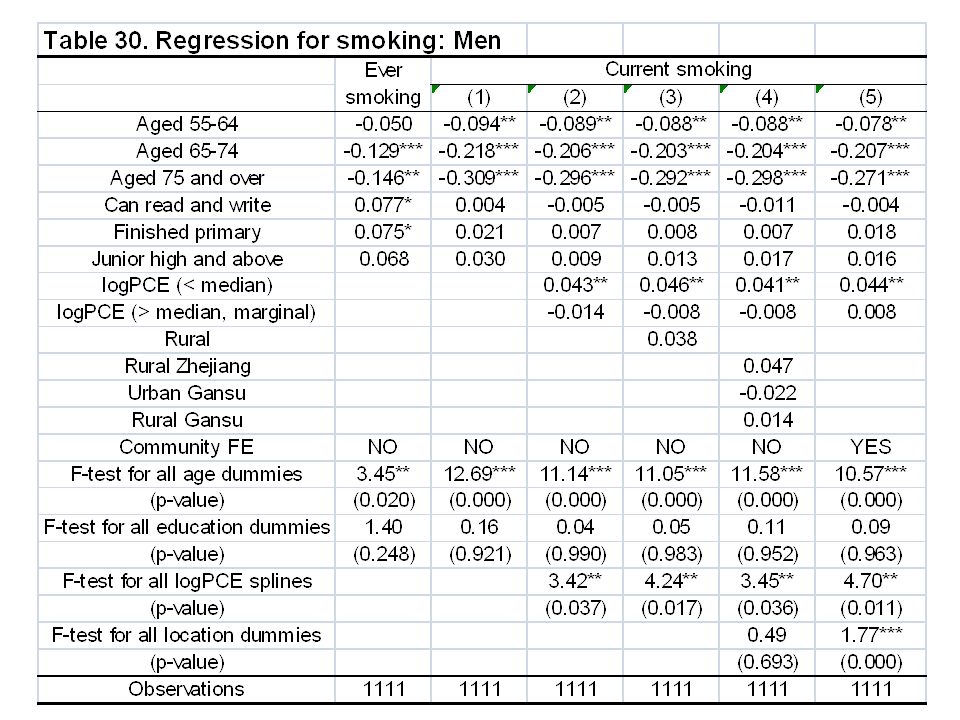
Ever and Current Smoking As in the rest of Asia, smoking is a male vice, women don’t smoke per se Are cohort effects in who ever smoked Is some quitting as men age Current smoking status unrelated to SES –A bit different from Indonesia

90
Community-Redux The apparent importance of regional and community factors is a major result of this analysis---WHY? In our theory we talk about different prices, different health care availability and quality –These are likely to explain some, but almost surely there are other, unmeasured factors Different health environment: air, water Different food preferences: diet

91
Community-Redux 2 Understanding the factors behind these community effects must be the subject of future research CHARLS is well-placed for that in part because of the detailed community information we collect- far more detailed than other HRS-type surveys

Similar presentations


 1.>")


