Download presentation
Presentation is loading. Please wait.

1
YEAR 10 REVISION BLASTER

2
GCSE MATHS REVISION UNIT 1 – all about DATA Probability Averages
Cumulative frequency Histograms Percentages

3
Probability

4
KEY POINTS The probability scale goes from 0 to 1.
Probability of a certain event = 1 Probability of an impossible event= 0 P(event)= No. of ways that event can happen Total no. of ALL possible outcomes
= No. of ways that event can happen. Total no. of ALL possible outcomes.")
5
22 Sweets in a bag, 7 are red, 6 are blue, 9 are green.
What is the probability of randomly picking a blue sweet? 22 6 P(event)= No. of ways that event can happen Total no. of ALL possible outcomes P (BLUE) = =
= No. of ways that event can happen. Total no. of ALL possible outcomes. P (BLUE) = =")
6
Calculate the Probability of NOT picking a blue sweet.
P(event Not happening)=1 – P(event happening) P (NOT BLUE) = 1 – P(picking blue) P (NOT BLUE) = 1 – P (NOT BLUE) =
=1 – P(event happening) P (NOT BLUE) = 1 – P(picking blue) P (NOT BLUE) = 1 – P (NOT BLUE) =")
7
Calculating the Probability of combined events.
STARTER: P(garlic bread)=0.2; P(dough balls)= 0.8 MAIN: P(pasta)=0.2; P(Salad)= P(Pizza) = 0.6 Calculate the probability of having; garlic bread followed by pizza. Calculate the probability of having ANY starter followed by salad.
=0.2; P(dough balls)= 0.8. MAIN: P(pasta)=0.2; P(Salad)=0.2 P(Pizza) = 0.6. Calculate the probability of having; garlic bread followed by pizza. Calculate the probability of having ANY starter followed by salad.")
8
OR RULE= ADD PROBABILITIES
SO we add together the possibilities: = 0.20 Probability of having ANY starter followed by salad is 0.20 There are TWO possibilities here; garlic bread and then salad, OR dough balls and the salad. OR RULE= ADD PROBABILITIES P(garlic bread)=0.2; P(dough balls)= 0.8 P(pasta)=0.2; P(Salad)= P(Pizza) = 0.6 Calculate the probability of having ANY starter followed by salad. Calculate the probability of having; garlic bread followed by pizza. MAIN Pasta Salad 0.2 0.6 STARTER Answer= 0.12 0.2 0.2 x 0.2 = 0.04 Garlic Bread 0.6 0.2 0.2 0.2 Pizza 0.2 x 0.6 = 0.12 Pasta Salad 0.2 0.6 AND RULE (Going ALONG the branches) We MULTIPLY the Probabilities. 0.8 0.8 Dough Balls 0.2 0.8 x 0.2 = 0.16 Pizza
=0.2; P(dough balls)= 0.8. P(pasta)=0.2; P(Salad)=0.2 P(Pizza) = 0.6. Calculate the probability of having ANY starter followed by salad. Calculate the probability of having; garlic bread followed by pizza. MAIN. Pasta. Salad STARTER. Answer= x 0.2 = Garlic Bread Pizza. 0.2 x 0.6 = Pasta. Salad AND RULE (Going ALONG the branches) We MULTIPLY the Probabilities Dough. Balls x 0.2 = Pizza.")
9
Relative Frequency: An estimate for theoretical probability
Relative Frequency = Frequency of the event Total Number of trials Calculate the relative frequency of the toast landing jam side up. No. of drops No. of jam side up Relative Frequency 12 6 12/6 =2

10
The relative frequency of seeing a red car go past your window is 0.6.
Relative Frequency = Frequency of the event Total Number of trials Frequency of the event = 0.6 x = Frequency = Frequency The relative frequency of seeing a red car go past your window is 0.6. You watch 100 cars go past your window. How many would you expect to be red? 0.6 100

11
Probability Answers 1. (a) ½ (b) 300 2. (a) (i) 11/12 or 0.92
(ii) 8/12 or 2/3 (b) (i) 15/22 (allow 14 or 15 on top 22 or 21 on bottom) (ii) 5/11 or any equivalent fraction 3. (a) 0.4 on first branch & all other branches correct (b) (i) or 4/25 or 16 % (ii) or 21/25 or 84 % (a) (b) 15 (c) More than expected with a suitable qualification (allow expect 10)
 8/12 or 2/3. (b) (i) 15/22 (allow 14 or 15 on top 22 or 21 on bottom) (ii) 5/11 or any equivalent fraction. 3. (a) 0.4 on first branch & all other branches correct. (b) (i) 0.16 or 4/25 or 16 % (ii) 0.84 or 21/25 or 84 % (a) (b) 15. (c) More than expected with a suitable qualification (allow expect 10)")
12
Averages

13
MEAN Mode Median 3+3+4+4+4+5+5+6+7=41 41 9 = 4.55…
3, 3, 4, 4, 4, 5, 5, 6, 7 3, 5, 4, 3, 5, 4, 4, 6, 7 3, 3, 4, 4, 4, 5, 5, 6, 7

14
Calculate the mean. Mean = sum of ALL the values = 140 = 1.84 2105263
9 10 15 17 20 Frequency 4 5 1 Numbers of sports played TOTAL 76 Frequency x Numbers of sports played 0 × 20 = 0 1 × 17 = 17 2 × 15 = 30 3 × 10 = 30 4 × 9 = 36 5 × 3 = 15 6 × 2 = 12 140 Mean = sum of ALL the values sum of frequencies = 140 = 1.84 76

15
Javelin distances in metres
Calculate an estimate for the mean. 1 35 ≤ d < 40 3 10 12 8 Frequency 30 ≤ d < 35 25 ≤ d < 30 20 ≤ d < 25 15 ≤ d < 20 10 ≤ d < 15 5 ≤ d < 10 Javelin distances in metres 36 TOTAL Midpoint Frequency × midpoint 7.5 1 × 7.5 = 7.5 12.5 8 × 12.5 = 100 17.5 12 × 17.5 = 210 22.5 10 × 22.5 = 225 27.5 3 × 27.5 = 82.5 32.5 1 × 32.5 = 32.5 37.5 1 × 37.5 = 37.5 695 Mean = sum of ALL frequency x midpoint sum of frequencies = 695 = 19.3 36 055555…

16
Averages Answers 99.7 (allow 100) 2. (a) 131.6 (allow 131 to 132)
(b) 110 £ t < 130 3. (a) (allow 26) (b) Frequency polygon from (10, 42) to (70, 3) joined with approximately straight lines (c) Comment - eg. Higher mean on Saturday, or Larger range on Saturday, or More money spent on Saturday
 110 £ t < (a) 26.4 (allow 26) (b) Frequency polygon from (10, 42) to (70, 3) joined with approximately straight lines. (c) Comment - eg. Higher mean on Saturday, or Larger range on Saturday, or More money spent on Saturday.")
17
Year 10 Unit 1 Exam. Tuesday 9th November- TOMORROW!!
AD BREAK Year 10 Unit 1 Exam. Tuesday 9th November- TOMORROW!! Don’t Forget: CALCULATORS PEN PENCIL RULER REVISE

18
CUMULATIVE FREQUENCY

19
The cumulative frequency is the RUNNING TOTAL OF FREQUENCIES
Used for finding the MEDIAN and UPPER AND LOWER QUARTILES

20
Marks in a Yr 10 Maths Test 2 2 13 32 68 110 141 154 160 11-20 21-30
Frequency Cumulative Frequency 11-20 21-30 11 31-40 19 41-50 36 42 61-70 31 71-80 13 81-90 6 2 2 13 110 people scored 60 marks OR less 32 68 51-60 110 141 154 160

21
Plot the top value in each group against cumulative frequency

22
=65 -44 =21 Interquartile range
Median shows that ½ of people score less than 53 marks and ½ score more Lower Quartile shows 25% of people scored 44 marks or less Interquartile range = =21 Upper Quartile shows 75% of people scored 65 marks or less

23
Cumulative Frequency Answers
1. (a) Any value from 55 to 57 inclusive (b) 6 ± 0.4 2. (a) 12, 27, 56, 72, 83, 90 (b) Correct graph ‘increasing’ (S shape) (c) (i) Median line from 45(.5) e.g (ii) IQR lines from Q1 (22.5) and Q3 (67.5) and subtract their answers (eg 16 – 20) (d) Approx 48
 Any value from 55 to 57 inclusive. (b) 6 ± (a) 12, 27, 56, 72, 83, 90. (b) Correct graph ‘increasing’ (S shape) (c) (i) Median line from 45(.5) e.g (ii) IQR lines from Q1 (22.5) and Q3 (67.5) and subtract their answers (eg 16 – 20) (d) Approx 48.")
24
HISTOGRAMS

25
Finding lengths given areas
If the width is 10 What must the height be to make an area of 25? 2.5 25 As 10 x 2.5 = 25 10

26
Bar Graphs Bar graphs are great to use when you have equal class intervals:

27
Histograms Histograms are used when you have different sized class intervals. The area of the rectangle represents the frequency. The width is the size of the class interval. The height is what we call the frequency density.

28
We have different sized class intervals
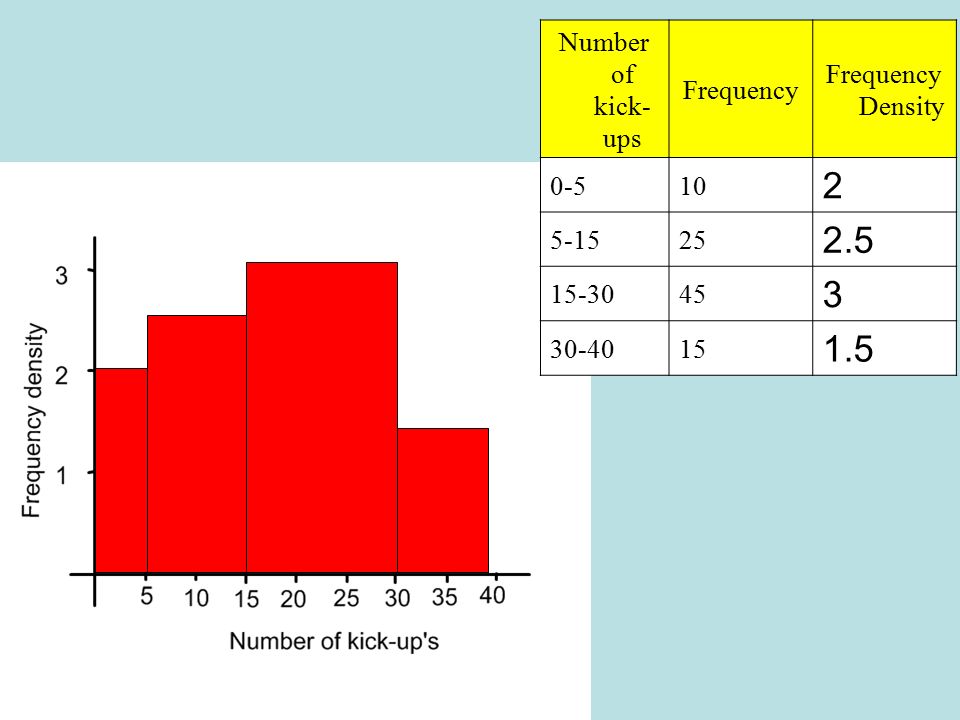
The table below shows the number of kick-ups completed in a competition at a local primary school. Number of kick-ups Frequency Frequency Density 0-5 10 5-15 25 15-30 45 30-40 15 Our class interval width is 5, and our frequency (area) is 10. 2 2.5 So, Frequency Density (height) = 10/5 3 1.5 We have different sized class intervals
 is So, Frequency Density (height) = 10/ We have different sized class intervals.")
29
2 2.5 3 1.5 Number of kick-ups Frequency Frequency Density 0-5 10 5-15
25 2.5 15-30 45 3 30-40 15 1.5
30
Estimate how many students managed ten kick-ups or less.
Frequency = 5 x 2.5 = 12.5 Frequency= 5 x 2 = 10 So, = 22.5 We can estimate that 22.5 students made ten kick-ups or less.

31
Comparing Histograms and Bar Graphs

32
Histograms Answers 1. (a) 0.4, 0.4, 0.5, 0.1 (b) 21
(a) Correct histogram: Widths: 15, 5, 5, 10, 15 Heights: 0.6, 4.2, 4.8, 3.1, 1 (b) 42
 Correct histogram: Widths: 15, 5, 5, 10, 15. Heights: 0.6, 4.2, 4.8, 3.1, 1. (b) 42.")
34
Percentage Increase and Decrease

35
Increase by 15% so 1.15 is the multiplier
Method 1 Find 15% 10% = £2 5% = £1 so 15% = £3 Now add it on to £20 £20 + £3 = £23 Method 2 I need to find 115% OF original amount 115% of £20 is 1.15 x £20 = £23 Increase by 15% so 1.15 is the multiplier

36
Decrease £60 by 5% Method 2 Method 1
A decrease of 5% is same as 95% of original amount So 0.95 x £60 = £57 Method 1 Find 5% of £60 10% = £ % = £3 Subtract from £60 £60 - £3 = £57 95% of original amount means 0.95 is the multiplier

37
Compound Interest OR 1000 x 1.05 x 1.05 x1.05= 1.05 is the multiplier!
£1,000 in bank earns 5% interest per year. How much will you have in 3 years? After 1 year 1000 x 1.05 = 1050 After 2 years 1050 x 1.05= After 3 years x 1.05 = OR 1000 x 1.05 x 1.05 x1.05= 1000 x 1.05³=£ 1.05 is the multiplier!

38
Percentages Answers 1. £2140 (allow £140) 2. (a) 1.029 (b) (allow ) 3. 1st year is £20; 2nd year is £20.80 Interest is £40.80 so Amir is wrong 4. (a) 2.04 (b) 6 (windmills)
 (b) 6 (windmills)")
Similar presentations


 Collect, organise and interpret univariate numerical data in order to determine measures of dispersion,>")


 – all about: SHAPE & ALGEBRA & NUMBER Circle theorems Angles & lines & shapes.>")


