Download presentation
Presentation is loading. Please wait.

1
How to use renewable energy to rise islands welfare Eksamples from Bornholm and Sardinia taken from the TransPlan project Per Alex Sørensen PlanEnergi

2
TransPlan n TransParent Energy Planning and Implementation n Bornholm (Rügen), Gotland (Öland), Åland, Saaremaa (Hiiumaa), Sardinia Sassari province (+ 3 other provinces) n PlanEnergi n Islenet
, Gotland (Öland), Åland, Saaremaa (Hiiumaa), Sardinia Sassari province (+ 3 other provinces) n PlanEnergi n Islenet")
3
Why is it always me?

4
RISE OF WELFARE n New workplaces during implementation and maintenance n Cheaper energy n Technological development and sale of know how and equipment n Reduction of environmental problems n Less dependency of imported fuels and services

5
Means n Local energy resources instead of imported fuels n Local labour force instead of imported fuels

6
The principle in energy balances

7
Energy Planning Tool (EPT) n Samsø 1997-99-01-03-05-07 n 14 municipalities on Fyn n 12 provinces in Thailand n TransPlan (Bornholm, Gotland, Åland, Saaremaa, Sardinia) n Region Midtjylland 2005-06-07 and 13 municipalities within Region Midtjylland n Kolding, Aalborg, Vesthimmerland, Rebild, Fredericia, Vejle
 n Samsø n 14 municipalities on Fyn n 12 provinces in Thailand n TransPlan (Bornholm, Gotland, Åland, Saaremaa, Sardinia) n Region Midtjylland and 13 municipalities within Region Midtjylland n Kolding, Aalborg, Vesthimmerland, Rebild, Fredericia, Vejle")
8
Lessons learned n Simple n Transparent n Action oriented n Comparable n Easy to update

9
1.st. workshop n Explanation of inserted data n Insert missing data n Discussion of energy balance and key figures n Business as usual scenario

10
2.nd workshop n Presentation of inspiration catalogue n Single technology spreadsheet. Presentation and calculation of examples n Elaboration of list of actions n Elaboration of alternative future energy plan

11
3.rd workshop n Presentation of alternative future energy plan including prioritised list of actions n Elaboration of implementation program for each action

12
1. District Heating in Towns (Bornholm) n Target: District heating with biomass and solar. 9 new towns and switch fuel in Rønne. n Assumptions: –Local fuels: 15.000 t straw and 25.000 m 3 wood chips –Import: 7.000 m 3 wood chips. –12.500 m 2 solar thermal. n Result: 68.000 t CO 2 saved n Proposed Actions: –Coordination of transmission pipes, fuels, optimise pipes n Stakeholders: Utilities, fuel suppliers and public authorities

13
Marstal PlanEnergi IDA d.19. august 2008

14
2. Switching fuels outside district heating areas (Bornholm) n Target: All oil consumption will be replaced by heat pumps, wood pellet stoves, solar heating etc. n Assumptions: –Solar thermal plants (1000 units) when implementing wood pellet stoves (2000 units) –2000 heat pumps n Result: 32,000 t CO 2 saved n Proposed Actions: –Information campaigns and direct personal advice –Investigate possibilities for local wood pellet production n Stakeholders: ?
 n Target: All oil consumption will be replaced by heat pumps, wood pellet stoves, solar heating etc. n Assumptions: –Solar thermal plants (1000 units) when implementing wood pellet stoves (2000 units) –2000 heat pumps n Result: 32,000 t CO 2 saved n Proposed Actions: –Information campaigns and direct personal advice –Investigate possibilities for local wood pellet production n Stakeholders: .")
15
3. Windpower (Bornholm) n Target: 90 MW new capacity established n Assumptions: –On shore: 15 MW –Off shore: 75 MW n Result: –33.000 t CO2 saved –Electricity-export n Proposed Actions: –On shore: Getting permissions –Off shore: Dialogue with the Danish state –Regulation of electricity consumption n Stakeholders: Østkraft and private partners
 n Target: 90 MW new capacity established n Assumptions: –On shore: 15 MW –Off shore: 75 MW n Result: – t CO2 saved –Electricity-export n Proposed Actions: –On shore: Getting permissions –Off shore: Dialogue with the Danish state –Regulation of electricity consumption n Stakeholders: Østkraft and private partners.")
16
4. Biogas (Bornholm) 4. Biogas (Bornholm) n Target: Utilize 40 % more of the total production of slurry n Assumptions: –Implementation of further biogas capacity with CHP –Connection to district heating (26 GWh) –Upgrading to public transport (7 GWh) –Connection to electric grid (15 MWh) n Result: 3.000 t CO 2 saved n Proposed Actions: –Planning and design –Coordination of sale (heat etc.) n Stakeholders: ?
 n Target: Utilize 40 % more of the total production of slurry n Assumptions: –Implementation of further biogas capacity with CHP –Connection to district heating (26 GWh) –Upgrading to public transport (7 GWh) –Connection to electric grid (15 MWh) n Result: t CO 2 saved n Proposed Actions: –Planning and design –Coordination of sale (heat etc.) n Stakeholders: .")
17
5. Electrical driven cars (Bornholm) n Target: 40 % of petrol consumption replaced by electricity n Assumptions: –Profitable for users –80 % efficiency for electrical driven cars n Result: 14.000 t CO 2 saved n Proposed Actions: –Car pioneers: Østkraft, BRK and others. –Establish filling stations –Renting cars to tourists n Stakeholders: Østkraft and others?
 n Target: 40 % of petrol consumption replaced by electricity n Assumptions: –Profitable for users –80 % efficiency for electrical driven cars n Result: t CO 2 saved n Proposed Actions: –Car pioneers: Østkraft, BRK and others. –Establish filling stations –Renting cars to tourists n Stakeholders: Østkraft and others .")
18
6. Ethanol (Bornholm) n Target: Establish the planned 2.nd generation bio- ethanol plant n Assumptions: –Financing solved n Result: 30.000 t CO2 saved (include 12.000 t from fuel pellets and 16.000 t from bio ethanol replacing petrol) n Stakeholders: BornBioFuel
 n Target: Establish the planned 2.nd generation bio- ethanol plant n Assumptions: –Financing solved n Result: t CO2 saved (include t from fuel pellets and t from bio ethanol replacing petrol) n Stakeholders: BornBioFuel.")
19
7. Ethanol cars (Bornholm) n Target: 40 % of petrol consumption replaced by 10.000 m 3 ethanol n Assumptions: –Production and distribution of bio ethanol to competitive price n Result: 16.000 t CO 2 saved n Proposed Actions: –Establish filling stations –Establish mixing facilities –Marketing vehicles n Stakeholders: BornBioFuel, petrol distributors, car sellers, fleet owners (BRK, companies)
 n Target: 40 % of petrol consumption replaced by m 3 ethanol n Assumptions: –Production and distribution of bio ethanol to competitive price n Result: t CO 2 saved n Proposed Actions: –Establish filling stations –Establish mixing facilities –Marketing vehicles n Stakeholders: BornBioFuel, petrol distributors, car sellers, fleet owners (BRK, companies).")
20
8. Electricity savings (Bornholm) n Target: Electricity consumption reduced with 5% (excl. heat pumps and electrical driven cars) n Assumptions: –Active direct advise and marketing, campaigns etc. n Result: 4.000 t CO 2 saved n Proposed Actions: –Coordinated energy advising n Stakeholders: Østkraft, “Energitjenesten”, BRK, plumbers and building sector, banks ?
 n Assumptions: –Active direct advise and marketing, campaigns etc. n Result: t CO 2 saved n Proposed Actions: –Coordinated energy advising n Stakeholders: Østkraft, Energitjenesten , BRK, plumbers and building sector, banks .")
21
9. Savings in Heat Consumption (Bornholm) n Target: Heat consumption reduced with 10% n Assumptions: –Active direct advise and marketing, campaigns etc. – n Result: 15.000 t CO 2 saved n Proposed Actions: –Coordinated energy advising – n Stakeholders: “Energitjenesten”, District heating companies, BRK, plumbers and building sector, banks ?
 n Target: Heat consumption reduced with 10% n Assumptions: –Active direct advise and marketing, campaigns etc. – n Result: t CO 2 saved n Proposed Actions: –Coordinated energy advising – n Stakeholders: Energitjenesten , District heating companies, BRK, plumbers and building sector, banks .")
22
10. Savings in Land Transport (Bornholm) n Target: Max 10 % increase in fuel consumption for land transport n Assumptions: –Active direct advise and marketing, campaigns etc n Result: 5.000 t CO 2 saved n Proposed Actions: –Rearrangement/increase in public transport –Eco-driving, campaigns and information n Stakeholders: ?
 n Target: Max 10 % increase in fuel consumption for land transport n Assumptions: –Active direct advise and marketing, campaigns etc n Result: t CO 2 saved n Proposed Actions: –Rearrangement/increase in public transport –Eco-driving, campaigns and information n Stakeholders: .")
23
11. Coordinated Energy Advising (Bornholm) n Target: Establish broad team of advisers for companies and private people n Assumptions: –Pooling of resources –Common targets and strategies among stakeholders –The Will! n Result: Realisation of points: 2+7+8+9 n Proposed Actions: –Description of, agreement upon and establishing of team of advisers n Stakeholders: Utilities, “Energitjenesten”, BRK, plumbers and building sector, banks ?
 n Target: Establish broad team of advisers for companies and private people n Assumptions: –Pooling of resources –Common targets and strategies among stakeholders –The Will. n Result: Realisation of points: n Proposed Actions: –Description of, agreement upon and establishing of team of advisers n Stakeholders: Utilities, Energitjenesten , BRK, plumbers and building sector, banks .")
24
12. Energy Forum (Bornholm) n Target: Ensure coordination and progress towards the targets in the energy strategy (BE2025) n Assumptions: –Will and interest! n Proposed Actions: –Continuous evaluation of the energy strategy (for instance every two years) –Continuous feed back to stakeholder groups n Stakeholders: Present Energy Forum?
 n Target: Ensure coordination and progress towards the targets in the energy strategy (BE2025) n Assumptions: –Will and interest. n Proposed Actions: –Continuous evaluation of the energy strategy (for instance every two years) –Continuous feed back to stakeholder groups n Stakeholders: Present Energy Forum .")
26
Proposed Priority of Actions - start 2008-09 (Bornholm) 1.District heating in Hasle, Aakirkeby, Nylars, Snogebæk and Balka 2.Change of fuels outside district heating areas 3.Windmills 6.Bornbiofuel 7.Ethanol cars 8.Electricity savings 9.Savings in heat consumption 11.Team of advisers 12.Energy Forum
 1.District heating in Hasle, Aakirkeby, Nylars, Snogebæk and Balka 2.Change of fuels outside district heating areas 3.Windmills 6.Bornbiofuel 7.Ethanol cars 8.Electricity savings 9.Savings in heat consumption 11.Team of advisers 12.Energy Forum")
27
Proposed Priority of Actions - start 2010-12 (Bornholm) 1.District heating in Sorthat-Muleby 4.Biogas 5.Electrical driven cars 10. Savings in land transport

28
Proposed Priority of Actions - start after 1012 (Bornholm) Proposed Priority of Actions - start after 1012 (Bornholm) 1. District heating in Nyker, Vestermarie, Østerlars and Østermarie. Change of fuel, Rønne + ”Coming..”: n Large heat pumps for district heating n Wave power n Hydrogen n Solar PV n ?????

29
Bornholm (key figures) CO2 Per cap. Ships & flights RES* IMPORT 1000 t (t) 1000 t % Mio € 2005 253 5,8 61 24 67 BE2025 86 2,0 61 82 24 *) incl. imports
 1000 t % Mio € , BE , *) incl. imports.")
30
Windpower (Sardinia) n 1.000 MW installed. The total electricity production is 175 ktep or 2.030 GWh. In calculation of the CO2 –reduction coal produced electricity is replaced In calculation of the CO2 –reduction coal produced electricity is replaced n CO2 –reduction 441.100 tons/year

31
Biogas (Sardinia) n 40 MW biogas installed. The total electricity production is estimated to be 324,8 GWh. The efficiency in the electricity production is expected to be 38%. Therefore 854,7 GWh biogas is needed. The biogas comes from manure (75% = 641 GWh) and waste (25% = 213,7 GWh). In calculation of the CO2 – reduction coal produced electricity is replaced. biogas is needed. The biogas comes from manure (75% = 641 GWh) and waste (25% = 213,7 GWh). In calculation of the CO2 – reduction coal produced electricity is replaced. n CO2 –reduction: 242.200 tons/year.
 and waste (25% = 213,7 GWh). In calculation of the CO2 – reduction coal produced electricity is replaced. biogas is needed. The biogas comes from manure (75% = 641 GWh) and waste (25% = 213,7 GWh). In calculation of the CO2 – reduction coal produced electricity is replaced. n CO2 –reduction: tons/year..")
32
Electricity savings (Sardinia) n The electricity consumption in 2025 is expected to be 20% lower than the electricity consumption in 2005 (compared to 16% higher in Business as usual 2025!). The total electricity consumption in 2025 will then be 10.089 GWh The total electricity consumption in 2025 will then be 10.089 GWh In calculation af the CO2 –reduction coal produced electricity is replaced. In calculation af the CO2 –reduction coal produced electricity is replaced. n CO2 –reduction: 3.572.100 tons/year.

33
Savings in heat consumptions (Sardinia) n Also end use of heat is reduced with 20% compared to 2005. The total consumption for heating will then be reduced to 1.959 GWh n CO2 –reduction: 213.600 tons/year.

34
Savings in process heat (Sardinia) n End use of process heat is reduced with 20%. n CO2 –reduction: 458.300 tons/year

35
Savings transport (Sardinia) n The fuel consumption for transport is expected to be reduced with 20% compared to 2005 (in stead of an increase with 48,6% in Business as usual 2025!) Therefore fuel consumption will be 9.732 GWh n CO2 –reduction: 2.270.000 tons/year
 n The fuel consumption for transport is expected to be reduced with 20% compared to 2005 (in stead of an increase with 48,6% in Business as usual 2025!) Therefore fuel consumption will be GWh n CO2 –reduction: tons/year")
36
Solar electricity (Sardinia) n 100 MW of solar power is installed producing 139,3 GWh/year –reduction coal produced electricity is replaced. In calculation of the CO2 –reduction coal produced electricity is replaced. n CO2 –reduction: 102.300 tons/year

37
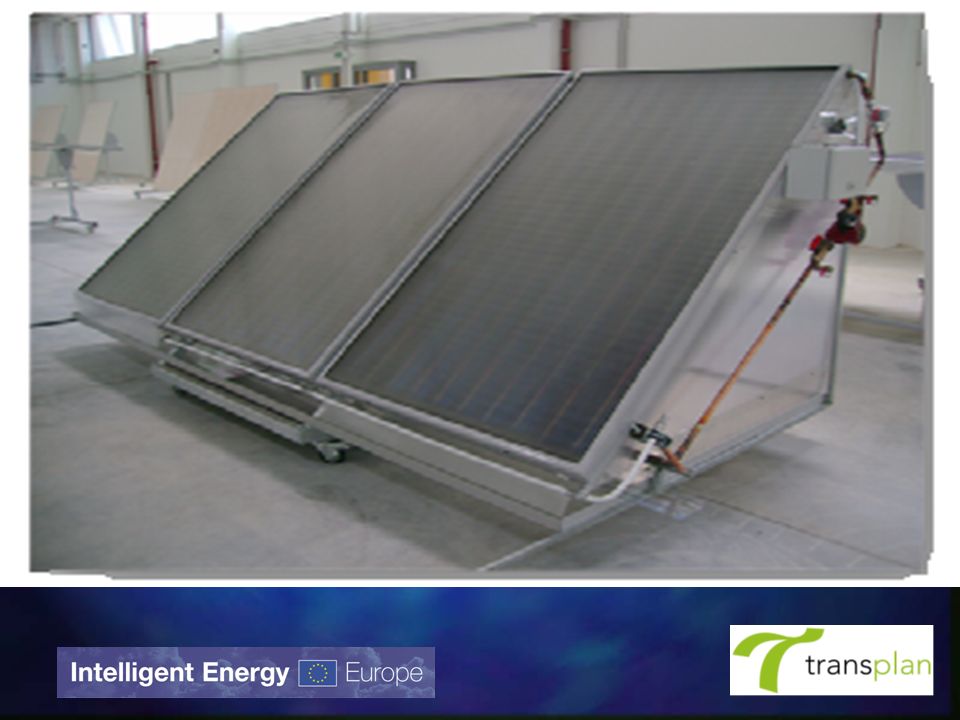
Solar thermal (Sardinia) n 350 MW solar thermal is installed producing 417,6 GWh/year The production replaces electricity for hot water production. The production replaces electricity for hot water production. In calculation of the CO2 –reduction coal produced electricity is replaced. In calculation of the CO2 –reduction coal produced electricity is replaced. n CO2 –reduction: 325.600 tons/year

38
Biomass produced electricity (Sardinia) n 70 MW biomass fired power plants is installed. The electricity production is expected to be 684,4 GWh/year. The fuel consumption with 30% efficiency is 2.281,3 GWh 2.281,3 GWh In calculation of CO2 –reduction 1.486 GWh coal and 6 GWh heavy oil is replaced. In calculation of CO2 –reduction 1.486 GWh coal and 6 GWh heavy oil is replaced. n CO2 –reduction: 509.900 tons/year

39
Waste inceneration (Sardinia) n 25 MW is installed. If running hours/year are 6.500 electricity production will be 162,5 GWh/year. And if efficiency in electricity production is 20% fuel consumption will be 812,5 GWh 812,5 GWh In calculation of CO2 –reduction heavy oil is replaced. In calculation of CO2 –reduction heavy oil is replaced. n CO2 –reduction: 50.500 tons/year. (extra CO2 –reduction compared to reduction from 80,2 GWh electricity produced in 2005)
.")
40
Biomass for heating (Sardinia) n 1.213,4 GWh biomass (wood) is expected to be used for heating. Wood is replacing oil calculated as 75 GWh wood will replace 70 GWh oil. Wood is replacing oil calculated as 75 GWh wood will replace 70 GWh oil. n CO2 –reduction: 287.300 tons/year.

41
Biofuel for transport (Sardinia) n 10% of fuel for transport is replaced by biofuels. n CO2 –reduction: 279.200 tons/year

42
Sardinia (key figures) CO2 Per cap. Ships & flights RES* 1000 t (t) 1000 t % 200517241 10.4 ? 3.3 BE2025 9751 5.9 ? 21.9 *) incl. imports
 incl. imports.")
43
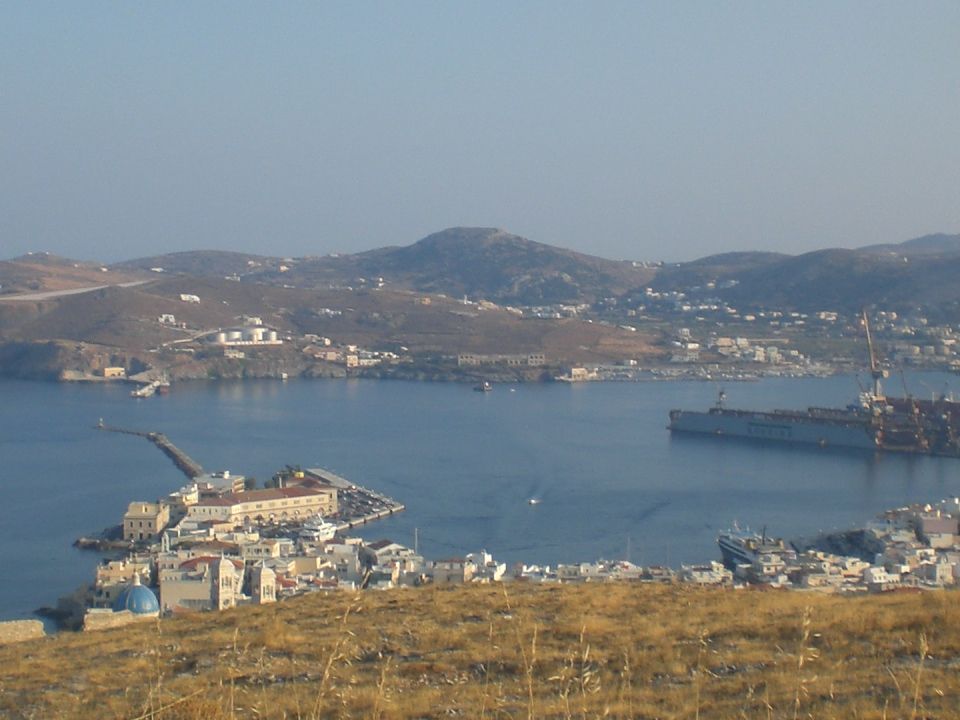
Syros? n Electricity savings. Electricity production was 96 GWh in 2004 and is expected to be 217 GWh in 2025!! n Savings in heat consumption n Savings in transport fuels

45
Syros? n Solar thermal n Solar electricity n Solar electricity and desalination

46
PlanEnergi Aalborg, d. 15. januar 2008

49
Syros? n Windmills. Yearly consumption 96 GWh in 2004. 8% wind. Max load 20 MW. 3.5 MW wind installed n Waste to energy 10.000 t waste/year? n District cooling

54
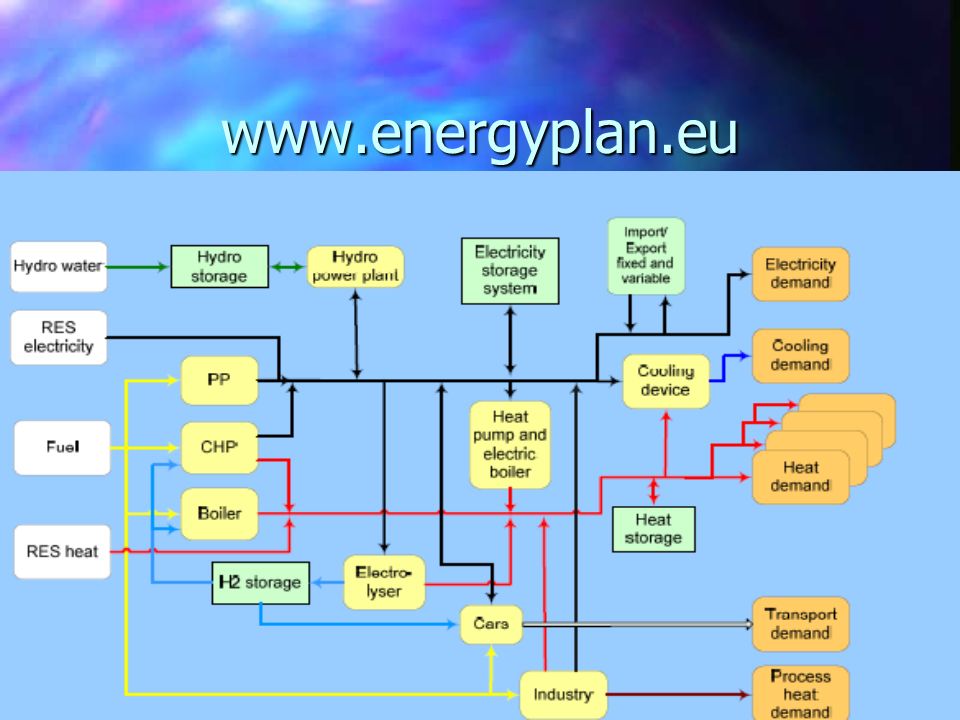
www.energyplan.eu
55
District cooling

56
Syros? n Biogas busses 2000 tons organic waste gives 200000 m3 biogas or 325000 km in busses (890 km/day) n Electric cars
 n Electric cars.")
57
Economy (Syros) 2 MW windpower1 MW PV 2 MW windpower1 MW PV Investment 2.2 mio €3.12 mio € Simple payback period 7.1 years4.7 years Internal rate (IRR) 15%24% Employment 23 person years 12 person years Subsidies, investment35%35% Feed-in tarif 87 €/MWh 503 €/MWh
 2 MW windpower1 MW PV 2 MW windpower1 MW PV Investment 2.2 mio €3.12 mio € Simple payback period 7.1 years4.7 years Internal rate (IRR) 15%24% Employment 23 person years 12 person years Subsidies, investment35%35% Feed-in tarif 87 €/MWh 503 €/MWh")
58
Obstacles for picking the low hanging fruits in Syros? n Technical obstacles? n Economical/financing obstacles? n Legal obstacles? n Organisational obstacles? n Political obstacles?

59
Thank you for your attention More informations n www.transplanproject.eu (EPT guidelines and Inspiration catalogue) www.transplanproject.eu n www.energyplan.eu (software for calculating system balance) www.energyplan.eu n www.europeanislands.net (island projects) www.europeanislands.net n www.planenergi.dk
 n (software for calculating system balance) n (island projects) n")
Similar presentations


 Kirkels MSc Staff member centre Technology for Sustainable Development Eindhoven.>")
