Download presentation
Presentation is loading. Please wait.

1
Bivariate Relationships Analyzing two variables at a time, usually the Independent & Dependent Variables Like one variable at a time, this can be done visually with charts and graphs (such as a scatterplot), and with frequency tables. To see two univariate frequency tables together at the same time, you cross-table them, that is, you create a cross-tabulation (or shorthand: Crosstab). Guidelines for creating crosstabs: (1) Put the Dependent variable in ROWS (2) Put the Independent variable in COLUMNS (3) Calculate percentages in the direction of the independent variable (Columns in this case). You are comparing the distributions of each category (value) of the independent variable with one another in terms of the categories of the dependent variable. For example, if you want to see if there is a relationship between gender and religion, you compare the values of gender (that is, male and female) across the various religions. When the number of men and the number of women are not exactly the same, you must standardize to compare by presenting the results in terms of percentages. The percentages of men who are Catholic, Jewish, etc. with the percentages of women who are Catholic, Jewish, etc. To compare, the percentages of men must add up to 100% as does the percentages of women.
. Guidelines for creating crosstabs: (1) Put the Dependent variable in ROWS (2) Put the Independent variable in COLUMNS (3) Calculate percentages in the direction of the independent variable (Columns in this case). You are comparing the distributions of each category (value) of the independent variable with one another in terms of the categories of the dependent variable. For example, if you want to see if there is a relationship between gender and religion, you compare the values of gender (that is, male and female) across the various religions. When the number of men and the number of women are not exactly the same, you must standardize to compare by presenting the results in terms of percentages. The percentages of men who are Catholic, Jewish, etc. with the percentages of women who are Catholic, Jewish, etc. To compare, the percentages of men must add up to 100% as does the percentages of women..")
2
Hypothesis: There is no relationship between Sex and College Status (Graduated or Left the College) Which is the Independent and Dependent Variables? What are the levels of measurement? Put into words: 74.9% of __________ have _____________. This is not the same as saying 74.9% of those who graduated are Female. If 71.8% of the entire four year period graduated, then compare the percentages of women with men relative to that 71.8%. Who tends to graduate disproportionately higher or lower than the overall rate?

3
This table, however, says: 61.7% of ___ are _______. To say that 80% of sociology majors are women is not the same as saying that 80% of women are sociology majors. You must always compare the categories (or values) of the independent variable by calculating percentages within each category separately. Each must add up to 100%. And if 59.5% of all respondents are Female and 40.5% are Males, then who graduates disproportionately higher or lower than their distribution in the sample?
 of the independent variable by calculating percentages within each category separately. Each must add up to 100%. And if 59.5% of all respondents are Female and 40.5% are Males, then who graduates disproportionately higher or lower than their distribution in the sample .")
4
Put into words what this table is telling us.

5
But how do we know if the differences between categories is big enough? What if we find that 75% of men own Toyotas and 79% of women own them? Is 4% a large enough difference or is that just sampling error? To decide if a difference is significant enough to hold a press conference, we must use some statistical tests which will tell us what the odds are – the probability – that these findings occurred by chance alone, that is, by accident and not a real finding. If the odds are small, we have a significant finding, because the probability of the finding happening by accident is so small that it must be due to a real impact of the independent variable on the dependent variable – not an accidental impact. For tell this you have to look for two things: (1)The Value of the Statistic (2) The Probability of that statistic occurring by chance If the probability of a statistic occurring by chance is less than 5% (p <.05), then you reject the null (or accept the positive) and declare that there is a relationship between the independent and dependent variables.
The Value of the Statistic (2) The Probability of that statistic occurring by chance If the probability of a statistic occurring by chance is less than 5% (p <.05), then you reject the null (or accept the positive) and declare that there is a relationship between the independent and dependent variables..")
6
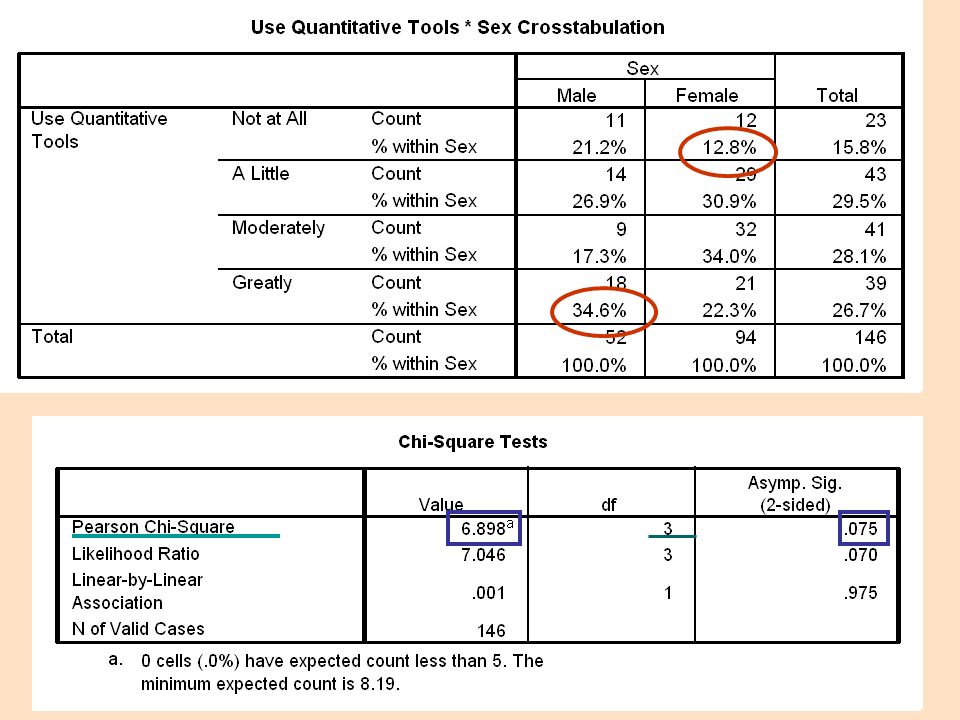
Chi-Square: a measure of association between the independent and dependent variables (usually nominal or ordinal measures). If the probability of obtaining a particular Chi-Square value by chance alone is less than.05, then we declare we have supported our hypothesis (or rejected our null). We hold a press conference and declare that indeed there is a relationship between the independent and dependent variables. Then we state in words what the relationship is (such as, women are more likely than men to vote Independent). For the following data, (a) state the null hypothesis being tested (b) What are the independent & dependent variables? (c) What levels of measurement are they?
. We hold a press conference and declare that indeed there is a relationship between the independent and dependent variables. Then we state in words what the relationship is (such as, women are more likely than men to vote Independent). For the following data, (a) state the null hypothesis being tested (b) What are the independent & dependent variables. (c) What levels of measurement are they .")
8
The value of Chi-square does not tell you much in and of itself. You must depend on the probability level to tell you if it is significant and then all it tells you is that there is an association between the variables. However, there are statistics that can tell you how strong a relationship is between your variables, not just whether there is one or not. These are called correlations. They tell you how much of variability of the dependent variable is explained by knowing the variability of the independent variable. Nominal variables: Lambda Ordinal variables: Gamma, Spearman’s rho Interval/Ratio variables: Pearson r All correlations have two components: (1)The value which ranges from 0 to 1.0, where 1.0 is a perfect strong correlation and 0 is no correlation at all. (2) For those variables that have a direction (an order: ordinal, ratio measures), a plus or minus sign to indicate a positive or inverse relationship
The value which ranges from 0 to 1.0, where 1.0 is a perfect strong correlation and 0 is no correlation at all. (2) For those variables that have a direction (an order: ordinal, ratio measures), a plus or minus sign to indicate a positive or inverse relationship.")
9
A Lambda correlation of.75 between race and religion tells us that this is a strong relation (it’s close to 1.0) and therefore the variation in religion among our sample can be explained by the variation in race. You would then look to see which religions depend on which races and report that information (such as Whites tend to be Protestant, Latinos are Catholic, and so on). A guideline: Correlations between 0 and.30 tend to be weak Correlations between.30 and.70 tend to be moderate Correlations between.70 and 1.0 tend to be strong A Pearson r correlation of -.60 is just as strong as one that is.60, and stronger than a correlation of.50, for example. The minus sign just tells us that it is inverse: those who score low on one variable, score high on the other. It does not mean it is weak or less than any positive correlation.
. A guideline: Correlations between 0 and.30 tend to be weak Correlations between.30 and.70 tend to be moderate Correlations between.70 and 1.0 tend to be strong A Pearson r correlation of -.60 is just as strong as one that is.60, and stronger than a correlation of.50, for example. The minus sign just tells us that it is inverse: those who score low on one variable, score high on the other. It does not mean it is weak or less than any positive correlation..")
10
Visual Version of Correlation: Scatterplots Pearson r =.84

11
Certain correlations also tell us the proportion reduction in error or PRE. This means that the proportion (or percentage) of errors that are made in predicting the values of a dependent variables is reduced by knowing the values of an independent variable. For example: A Lambda of.45 between race and religion would indicate that 45% of the errors in explaining the variability of religion among the respondents in our sample are reduced by knowing the variability of races in the sample. For Lambda and Gamma, PRE is simply the correlation coefficient. (Multiply by 100 to get a percent instead of a proportion). For Pearson r and Spearman’s rho, you must square the correlation value to determine the proportion of error reduction (r 2 or rho 2 ). So a Pearson r correlation of -.50 between high school GPA and SAT scores would suggest that.25 or 25% of the errors in predicting SAT scores would be reduced once we know the respondents’ high school GPAs.
 of errors that are made in predicting the values of a dependent variables is reduced by knowing the values of an independent variable. For example: A Lambda of.45 between race and religion would indicate that 45% of the errors in explaining the variability of religion among the respondents in our sample are reduced by knowing the variability of races in the sample. For Lambda and Gamma, PRE is simply the correlation coefficient. (Multiply by 100 to get a percent instead of a proportion). For Pearson r and Spearman’s rho, you must square the correlation value to determine the proportion of error reduction (r 2 or rho 2 ). So a Pearson r correlation of -.50 between high school GPA and SAT scores would suggest that.25 or 25% of the errors in predicting SAT scores would be reduced once we know the respondents’ high school GPAs..")
12
Put these findings into words

13
Review (1) Determine the independent and dependent variables in the hypothesis. (2) Label the levels of measurement for each variable. (3) Decide the appropriate statistics to use. (4) Evaluate the value of the statistic and the probability (or significance) level. (5) If the p-value is less than.05, then reject the null and accept the positive hypothesis. (6) If the statistic is a correlation (lambda, gamma, Pearson r, Spearman rho), then determine the PRE. (7) Put the findings into words for (a) fellow statistics experts and (b) for the general public on your Facebook page or Twitter feed!
 Label the levels of measurement for each variable. (3) Decide the appropriate statistics to use. (4) Evaluate the value of the statistic and the probability (or significance) level. (5) If the p-value is less than.05, then reject the null and accept the positive hypothesis. (6) If the statistic is a correlation (lambda, gamma, Pearson r, Spearman rho), then determine the PRE. (7) Put the findings into words for (a) fellow statistics experts and (b) for the general public on your Facebook page or Twitter feed!.")
14
Example There is no relationship between High School GPA and SAT scores. There is a relationship between High School GPA and College GPA. (1) What are the independent & dependent variables? (2) Levels of measurement? (3) Which statistic do you use? (4) What do the values of the Pearson r mean? (5) What are the Significance levels? (6) What are the PRE interpretations? (7) Put into words for a statistical audience and for the general public.
 What are the independent & dependent variables. (2) Levels of measurement. (3) Which statistic do you use. (4) What do the values of the Pearson r mean. (5) What are the Significance levels. (6) What are the PRE interpretations. (7) Put into words for a statistical audience and for the general public..")
Similar presentations


 –Difference of proportions –Ratios of proportions –the odds ratio Measures.>")
 and dependant (Y) variables.>")


![Correlation Question 1 This question asks you to use the Pearson correlation coefficient to measure the association between [educ4] and [empstat]. However,](/19/5827231/big_thumb.jpg "Correlation Question 1 This question asks you to use the Pearson correlation coefficient to measure the association between [educ4] and [empstat]. However,>")


